- Global Locations -
Headquarters
Future Market Insights, Inc.
Christiana Corporate, 200 Continental Drive, Suite 401, Newark, Delaware - 19713, United States
T: +1-845-579-5705
Americas
Future Market Insights, Inc.
616 Corporate Way, Suite 2-9018,
Valley Cottage, NY 10989,
United States
T: +1-347-918-3531
MEA
Future Market Insights

1602-6 Jumeirah Bay X2 Tower, Plot No: JLT-PH2-X2A,

Jumeirah Lakes Towers, Dubai,

United Arab Emirates

Europe
Future Market Insights
3rd Floor, 207 Regent Street,
London W1B 3HH
United Kingdom
T: + 44 (0) 20 8123 9659
D: +44 (0) 20 3287 4268
Asia Pacific
Future Market Insights Global & Consulting Pvt. Ltd.
Office No. 401-A, 4th Floor,
VANTAGE 9, S.No. 36/1/1,
Baner, Pune 411045 India

Optical Imaging Market

Optical Imaging Market By Technology, Application & Region | Forecast 2022 to 2032

Market Insights on Optical Imaging covering sales outlook, demand forecast and up-to-date key trends

Request Sample

Optical Imaging Market Overview (2022 to 2032)

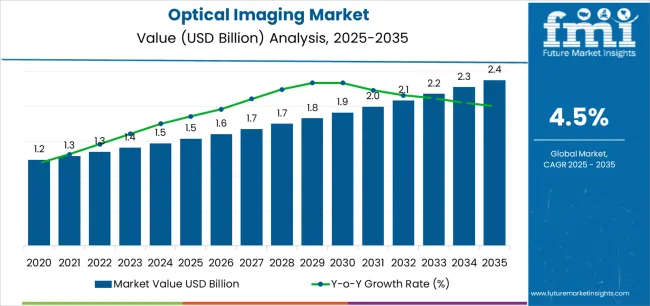
The optical imaging market is anticipated to rise at a stable CAGR of 10.8% during the forecast period.

Rising awareness about the neurological and ophthalmological problems in the population and demand for imaging diagnosis will upkeep the revenue growth of the optical imaging market.

The rise in government initiatives to control visual impairment and the increase in the geriatric population, which is more susceptible to a wide range of diseases such as neurology disorders, ophthalmic conditions, and cardiovascular conditions, are driving the growth of the global optical imaging market.

An increase in the prevalence of eye illnesses such as glaucoma and cataracts is fueling market expansion.

Compact optical imaging solutions are expected to provide optical imaging market players with increasing opportunities for innovating their product offerings.

With high-valued and technologically advanced solutions offered in the optical imaging market, the demand for innovative and next-generation solutions is expected to bring open new avenues for optical imaging providers.

Attribute Details

CAGR (2022 to 2032)

10.8%

Historical Value for 2020

US$ 1.9 Billion

Don't pay for what you don't need

Customize your report by selecting specific countries or regions and save 30%!

How can the Global Optical Imaging Market Segmented?

The market in developing countries is predicted to grow rapidly during the forecast period, owing to increased investments in healthcare infrastructure and increased knowledge about optical imaging, which would provide opportunities for manufacturers to profit from the market.

The optical imaging market is analyzed in detail with its division on the basis of technologies and the areas where optical imaging is applied.

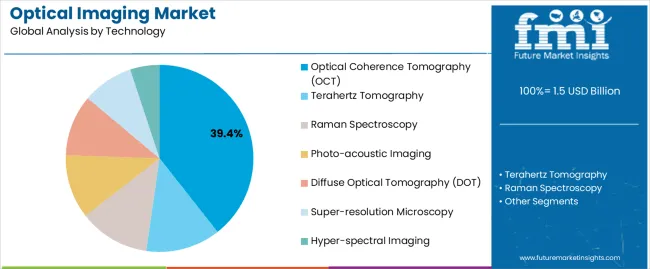
When segmented based on the technology, the optical imaging market includes segments such as terahertz tomography, optical coherence tomography (OCT), Raman spectroscopy, photo-acoustic imaging, diffuse optical tomography (DOT), super-resolution microscopy, and hyper-spectral imaging.

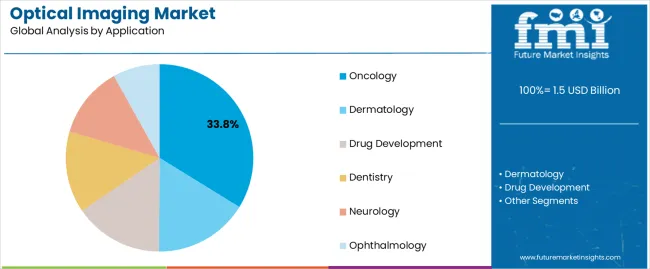
Optical imaging finds its application in various application segments including Dermatology, Drug development, Oncology, Dentistry, Neurology, and Ophthalmology.

Which Region Reigns the Global Optical Imaging Market?

Leading players are investing in developed nations to leverage the opportunities provided by them owing to increasing technological advancements and greater steps taken to boost innovations in the global optical imaging market.

The presence of the market is analyzed based on its presence in key regions such as Western and Eastern Europe, North and Latin America, the Middle East and Africa, Japan, and Asia Pacific.

North America is predicted to increase at the fastest rate, with a compound annual growth rate (CAGR) of 9.80 percent throughout the projection period (2022 to 2032).

An optical imaging company, Topcon Medical Systems, Inc. entered into an agreement with the leading AI diagnostics company, IDx. The objective of the agreement is to upscale AI diagnostics solutions in the market of USA. With this collaboration, the company expands its Harmony imaging platform for its customers in Europe.

Sabyasachi Ghosh
Sabyasachi Ghosh
Principal Consultant
LinkedIn
Talk to Analyst

Find your sweet spots for generating winning opportunities in this market.

What are the Key Global Optical Imaging Market Trends?

Optical imaging's capacity to distinguish between healthy and infectious tissues is providing a big opportunity.

Emerging markets like India, China, Japan, and Brazil are likely to provide considerable growth potential for optical imaging market participants. These countries are among the world's fastest-growing economies.

According to estimates from the World Economic Forum, emerging nations would account for roughly one-third of global healthcare spending in 2020.

In 2020, the imaging systems category led the global market, and this trend is expected to continue during the projected period (2022 to 2032). This might be ascribed to an increase in demand for imaging systems, which can be linked to the advantages that imaging systems have over other imaging modalities, such as their non-invasive nature. Furthermore, optical imaging techniques greatly limit the amount of hazardous radiation that patients are exposed to.

How is the Competition Landscape in the Global Optical Imaging Market?

The companies are working towards bringing innovations in their product offerings and also working towards building a sustainable position in the optical imaging market.

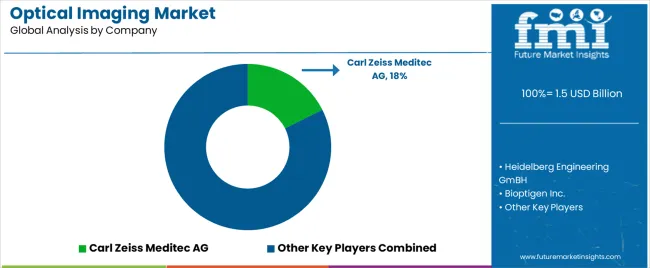
The major players included in the optical imaging market include Heidelberg Engineering GmBH, Carl Zeiss Meditec AG, Bioptigen Inc., Somanetics Corporation, Raytheon ELCAN Optical Technologies, ChemImage Corporation, Cytoviva Inc., Michelson Diagnostics, Headwall Photonics Inc., PerkinElmer Inc., ASE Optics Inc., St. Jude Medical Inc., Topcon Medical Systems Inc., Volcano Corporation, and Optical Imaging Ltd.

The leading optical imaging market players are involved in key strategies to work their way to the top when it comes to developments and investments. Carl Zeiss Meditec AG, an optical imaging provider, recently acquired IanTECH for expanding its portfolio and offerings for cataract surgery, owing to the cutting-edge surgical technology offered by IanTech. This would elaborate the aim of the company in improving its service offerings.

Another key optical imaging market player ChemImage Corporation demonstrated the detection and visualization of tissues during endoscope. The company is constantly focused on innovations owing to which the company developed a new approach to molecular chemical imaging.

Bruker, an optical imaging solutions provider, recently introduced a revolutionary light-sheet microscope to achieve the imaging of optically cleared samples. This new technology allows faster and high-resolution imaging along with minimal photodamage.

Get the data you need at a Fraction of the cost

Personalize your report by choosing insights you need
and save 40%!

Scope Of Report

Attributes Details

Forecast Period

2022 to 2032

Historical Data Available for

2018 to 2020

Market Analysis

US$ Million for Value

By Technology

  • Terahertz Tomography
  • Optical Coherence Tomography (Oct)
  • Raman spectroscopy
  • Photo-acoustic Imaging
  • Diffuse Optical Tomography (DOT)
  • Super-resolution Microscopy
  • Hyper-spectral Imaging

By Application

  • Dermatology
  • Drug development
  • Oncology
  • Dentistry
  • Neurology
  • Ophthalmology

By Region

  • North America
  • Latin America
  • Europe
  • East Asia
  • South Asia
  • Oceania
  • Middle East & Africa

Major Players

  • Heidelberg Engineering GmBH
  • Carl Zeiss Meditec AG
  • Bioptigen Inc.
  • Somanetics Corporation
  • Raytheon ELCAN Optical Technologies
  • ChemImage Corporation
  • Cytoviva Inc.
  • Michelson Diagnostics
  • Headwall Photonics Inc.
  • PerkinElmer Inc.
  • ASE Optics Inc.
  • St. Jude Medical Inc.
  • Topcon Medical Systems Inc.
  • Volcano Corporation
  • Optical Imaging Ltd.

Key Segments

By Technology:

  • Terahertz Tomography
  • Optical Coherence Tomography (Oct)
  • Raman spectroscopy
  • Photo-acoustic Imaging
  • Diffuse Optical Tomography (DOT)
  • Super-resolution Microscopy
  • Hyper-spectral Imaging

By Application:

  • Dermatology
  • Drug development
  • Oncology
  • Dentistry
  • Neurology
  • Ophthalmology

By Region:

  • North America
  • Latin America
  • Europe
  • East Asia
  • South Asia
  • Oceania
  • Middle East & Africa

Frequently Asked Questions

The global optical imaging market is expected to register a CAGR of 10.8% from 2022 to 2032.

The healthcare sector is a key driver in the global optical imaging market.

The Asia Pacific region is anticipated to dominate the global optical imaging market during the forecast period.

The global optical imaging market is likely to hold a valuation of US$ 6.50 billion by 2032.

The current valuation of the global optical imaging market in 2022 is US$ 2.33 billion.

Table of Content

1. Executive Summary | Optical Imaging Market

    1.1. Global Market Outlook

    1.2. Demand-side Trends

    1.3. Supply-side Trends

    1.4. Technology Roadmap Analysis

    1.5. Analysis and Recommendations

2. Market Overview

    2.1. Market Coverage / Taxonomy

    2.2. Market Definition / Scope / Limitations

3. Market Background

    3.1. Market Dynamics

        3.1.1. Drivers

        3.1.2. Restraints

        3.1.3. Opportunity

        3.1.4. Trends

    3.2. Scenario Forecast

        3.2.1. Demand in Optimistic Scenario

        3.2.2. Demand in Likely Scenario

        3.2.3. Demand in Conservative Scenario

    3.3. Opportunity Map Analysis

    3.4. Product Life Cycle Analysis

    3.5. Supply Chain Analysis

        3.5.1. Supply Side Participants and Their Roles

            3.5.1.1. Producers

            3.5.1.2. Mid-Level Participants (Traders/ Agents/ Brokers)

            3.5.1.3. Wholesalers and Distributors

        3.5.2. Value Added and Value Created at Node in the Supply Chain

        3.5.3. List of Raw Material Suppliers

        3.5.4. List of Existing and Potential Buyers

    3.6. Investment Feasibility Matrix

    3.7. Value Chain Analysis

        3.7.1. Profit Margin Analysis

        3.7.2. Wholesalers and Distributors

        3.7.3. Retailers

    3.8. PESTLE and Porter's Analysis

    3.9. Regulatory Landscape

        3.9.1. By Key Regions

        3.9.2. By Key Countries

    3.10. Regional Parent Market Outlook

    3.11. Production and Consumption Statistics

    3.12. Import and Export Statistics

4. Global Market Analysis 2017 to 2021 and Forecast, 2022 to 2032

    4.1. Historical Market Size Value (US$ Million) & Volume (Units) Analysis, 2017 to 2021

    4.2. Current and Future Market Size Value (US$ Million) & Volume (Units) Projections, 2022 to 2032

        4.2.1. Y-o-Y Growth Trend Analysis

        4.2.2. Absolute $ Opportunity Analysis

5. Global Market Analysis 2017 to 2021 and Forecast 2022 to 2032, By Product Type

    5.1. Introduction / Key Findings

    5.2. Historical Market Size Value (US$ Million) & Volume (Units) Analysis By Product Type, 2017 to 2021

    5.3. Current and Future Market Size Value (US$ Million) & Volume (Units) Analysis and Forecast By Product Type, 2022 to 2032

        5.3.1. Equipment

        5.3.2. Software

    5.4. Y-o-Y Growth Trend Analysis By Product Type, 2017 to 2021

    5.5. Absolute $ Opportunity Analysis By Product Type, 2022 to 2032 Deep-dive segmentation will be available in the sample on request

6. Global Market Analysis 2017 to 2021 and Forecast 2022 to 2032, By Application

    6.1. Introduction / Key Findings

    6.2. Historical Market Size Value (US$ Million) & Volume (Units) Analysis By Application, 2017 to 2021

    6.3. Current and Future Market Size Value (US$ Million) & Volume (Units) Analysis and Forecast By Application, 2022 to 2032

        6.3.1. Pathology Screening

        6.3.2. Pre-clinical Imaging

        6.3.3. Intra-operative Imaging

    6.4. Y-o-Y Growth Trend Analysis By Application, 2017 to 2021

    6.5. Absolute $ Opportunity Analysis By Application, 2022 to 2032 Deep-dive segmentation will be available in the sample on request

7. Global Market Analysis 2017 to 2021 and Forecast 2022 to 2032, By End User

    7.1. Introduction / Key Findings

    7.2. Historical Market Size Value (US$ Million) & Volume (Units) Analysis By End User, 2017 to 2021

    7.3. Current and Future Market Size Value (US$ Million) & Volume (Units) Analysis and Forecast By End User, 2022 to 2032

        7.3.1. Hospitals

        7.3.2. Diagnostic Centers

        7.3.3. Specialty Clinics

        7.3.4. Academic Institutes

        7.3.5. Contract Research Organizations

        7.3.6. Biotechnology Companies

        7.3.7. Ambulatory Surgical Centers

    7.4. Y-o-Y Growth Trend Analysis By End User, 2017 to 2021

    7.5. Absolute $ Opportunity Analysis By End User, 2022 to 2032 Deep-dive segmentation will be available in the sample on request

8. Global Market Analysis 2017 to 2021 and Forecast 2022 to 2032, By Region

    8.1. Introduction

    8.2. Historical Market Size Value (US$ Million) & Volume (Units) Analysis By Region, 2017 to 2021

    8.3. Current Market Size Value (US$ Million) & Volume (Units) Analysis and Forecast By Region, 2022 to 2032

        8.3.1. North America

        8.3.2. Latin America

        8.3.3. Europe

        8.3.4. East Asia

        8.3.5. South Asia & Pacific

        8.3.6. Middle East and Africa

    8.4. Market Attractiveness Analysis By Region

9. North America Market Analysis 2017 to 2021 and Forecast 2022 to 2032, By Country

    9.1. Historical Market Size Value (US$ Million) & Volume (Units) Trend Analysis By Market Taxonomy, 2017 to 2021

    9.2. Market Size Value (US$ Million) & Volume (Units) Forecast By Market Taxonomy, 2022 to 2032

        9.2.1. By Country

            9.2.1.1. USA

            9.2.1.2. Canada

        9.2.2. By Product Type

        9.2.3. By Application

        9.2.4. By End User

    9.3. Market Attractiveness Analysis

        9.3.1. By Country

        9.3.2. By Product Type

        9.3.3. By Application

        9.3.4. By End User

    9.4. Key Takeaways

10. Latin America Market Analysis 2017 to 2021 and Forecast 2022 to 2032, By Country

    10.1. Historical Market Size Value (US$ Million) & Volume (Units) Trend Analysis By Market Taxonomy, 2017 to 2021

    10.2. Market Size Value (US$ Million) & Volume (Units) Forecast By Market Taxonomy, 2022 to 2032

        10.2.1. By Country

            10.2.1.1. Mexico

            10.2.1.2. Brazil

            10.2.1.3. Rest of Latin America

        10.2.2. By Product Type

        10.2.3. By Application

        10.2.4. By End User

    10.3. Market Attractiveness Analysis

        10.3.1. By Country

        10.3.2. By Product Type

        10.3.3. By Application

        10.3.4. By End User

    10.4. Key Takeaways

11. Europe Market Analysis 2017 to 2021 and Forecast 2022 to 2032, By Country

    11.1. Historical Market Size Value (US$ Million) & Volume (Units) Trend Analysis By Market Taxonomy, 2017 to 2021

    11.2. Market Size Value (US$ Million) & Volume (Units) Forecast By Market Taxonomy, 2022 to 2032

        11.2.1. By Country

            11.2.1.1. Germany

            11.2.1.2. Italy

            11.2.1.3. France

            11.2.1.4. United Kingdom

            11.2.1.5. Spain

            11.2.1.6. BENELUX

            11.2.1.7. Russia

            11.2.1.8. Rest of Europe

        11.2.2. By Product Type

        11.2.3. By Application

        11.2.4. By End User

    11.3. Market Attractiveness Analysis

        11.3.1. By Country

        11.3.2. By Product Type

        11.3.3. By Application

        11.3.4. By End User

    11.4. Key Takeaways

12. East Asia Market Analysis 2017 to 2021 and Forecast 2022 to 2032, By Country

    12.1. Historical Market Size Value (US$ Million) & Volume (Units) Trend Analysis By Market Taxonomy, 2017 to 2021

    12.2. Market Size Value (US$ Million) & Volume (Units) Forecast By Market Taxonomy, 2022 to 2032

        12.2.1. By Country

            12.2.1.1. China

            12.2.1.2. Japan

            12.2.1.3. South Korea

        12.2.2. By Product Type

        12.2.3. By Application

        12.2.4. By End User

    12.3. Market Attractiveness Analysis

        12.3.1. By Country

        12.3.2. By Product Type

        12.3.3. By Application

        12.3.4. By End User

    12.4. Key Takeaways

13. South Asia & Pacific Market Analysis 2017 to 2021 and Forecast 2022 to 2032, By Country

    13.1. Historical Market Size Value (US$ Million) & Volume (Units) Trend Analysis By Market Taxonomy, 2017 to 2021

    13.2. Market Size Value (US$ Million) & Volume (Units) Forecast By Market Taxonomy, 2022 to 2032

        13.2.1. By Country

            13.2.1.1. India

            13.2.1.2. ASEAN

            13.2.1.3. Australia and New Zealand

            13.2.1.4. Rest of South Asia & Pacific

        13.2.2. By Product Type

        13.2.3. By Application

        13.2.4. By End User

    13.3. Market Attractiveness Analysis

        13.3.1. By Country

        13.3.2. By Product Type

        13.3.3. By Application

        13.3.4. By End User

    13.4. Key Takeaways

14. Middle East and Africa Market Analysis 2017 to 2021 and Forecast 2022 to 2032, By Country

    14.1. Historical Market Size Value (US$ Million) & Volume (Units) Trend Analysis By Market Taxonomy, 2017 to 2021

    14.2. Market Size Value (US$ Million) & Volume (Units) Forecast By Market Taxonomy, 2022 to 2032

        14.2.1. By Country

            14.2.1.1. GCC Countries

            14.2.1.2. Turkey

            14.2.1.3. South Africa

            14.2.1.4. Rest of Middle East and Africa

        14.2.2. By Product Type

        14.2.3. By Application

        14.2.4. By End User

    14.3. Market Attractiveness Analysis

        14.3.1. By Country

        14.3.2. By Product Type

        14.3.3. By Application

        14.3.4. By End User

    14.4. Key Takeaways

15. Key Countries Market Analysis

    15.1. USA

        15.1.1. Pricing Analysis

        15.1.2. Market Share Analysis, 2021

            15.1.2.1. By Product Type

            15.1.2.2. By Application

            15.1.2.3. By End User

    15.2. Canada

        15.2.1. Pricing Analysis

        15.2.2. Market Share Analysis, 2021

            15.2.2.1. By Product Type

            15.2.2.2. By Application

            15.2.2.3. By End User

    15.3. Mexico

        15.3.1. Pricing Analysis

        15.3.2. Market Share Analysis, 2021

            15.3.2.1. By Product Type

            15.3.2.2. By Application

            15.3.2.3. By End User

    15.4. Brazil

        15.4.1. Pricing Analysis

        15.4.2. Market Share Analysis, 2021

            15.4.2.1. By Product Type

            15.4.2.2. By Application

            15.4.2.3. By End User

    15.5. Germany

        15.5.1. Pricing Analysis

        15.5.2. Market Share Analysis, 2021

            15.5.2.1. By Product Type

            15.5.2.2. By Application

            15.5.2.3. By End User

    15.6. Italy

        15.6.1. Pricing Analysis

        15.6.2. Market Share Analysis, 2021

            15.6.2.1. By Product Type

            15.6.2.2. By Application

            15.6.2.3. By End User

    15.7. France

        15.7.1. Pricing Analysis

        15.7.2. Market Share Analysis, 2021

            15.7.2.1. By Product Type

            15.7.2.2. By Application

            15.7.2.3. By End User

    15.8. United Kingdom

        15.8.1. Pricing Analysis

        15.8.2. Market Share Analysis, 2021

            15.8.2.1. By Product Type

            15.8.2.2. By Application

            15.8.2.3. By End User

    15.9. Spain

        15.9.1. Pricing Analysis

        15.9.2. Market Share Analysis, 2021

            15.9.2.1. By Product Type

            15.9.2.2. By Application

            15.9.2.3. By End User

    15.10. BENELUX

        15.10.1. Pricing Analysis

        15.10.2. Market Share Analysis, 2021

            15.10.2.1. By Product Type

            15.10.2.2. By Application

            15.10.2.3. By End User

    15.11. Russia

        15.11.1. Pricing Analysis

        15.11.2. Market Share Analysis, 2021

            15.11.2.1. By Product Type

            15.11.2.2. By Application

            15.11.2.3. By End User

    15.12. China

        15.12.1. Pricing Analysis

        15.12.2. Market Share Analysis, 2021

            15.12.2.1. By Product Type

            15.12.2.2. By Application

            15.12.2.3. By End User

    15.13. Japan

        15.13.1. Pricing Analysis

        15.13.2. Market Share Analysis, 2021

            15.13.2.1. By Product Type

            15.13.2.2. By Application

            15.13.2.3. By End User

    15.14. South Korea

        15.14.1. Pricing Analysis

        15.14.2. Market Share Analysis, 2021

            15.14.2.1. By Product Type

            15.14.2.2. By Application

            15.14.2.3. By End User

    15.15. India

        15.15.1. Pricing Analysis

        15.15.2. Market Share Analysis, 2021

            15.15.2.1. By Product Type

            15.15.2.2. By Application

            15.15.2.3. By End User

    15.16. ASIAN

        15.16.1. Pricing Analysis

        15.16.2. Market Share Analysis, 2021

            15.16.2.1. By Product Type

            15.16.2.2. By Application

            15.16.2.3. By End User

    15.17. Australia and New Zealand

        15.17.1. Pricing Analysis

        15.17.2. Market Share Analysis, 2021

            15.17.2.1. By Product Type

            15.17.2.2. By Application

            15.17.2.3. By End User

    15.18. GCC Countries

        15.18.1. Pricing Analysis

        15.18.2. Market Share Analysis, 2021

            15.18.2.1. By Product Type

            15.18.2.2. By Application

            15.18.2.3. By End User

    15.19. Turkey

        15.19.1. Pricing Analysis

        15.19.2. Market Share Analysis, 2021

            15.19.2.1. By Product Type

            15.19.2.2. By Application

            15.19.2.3. By End User

    15.20. South Africa

        15.20.1. Pricing Analysis

        15.20.2. Market Share Analysis, 2021

            15.20.2.1. By Product Type

            15.20.2.2. By Application

            15.20.2.3. By End User

16. Market Structure Analysis

    16.1. Competition Dashboard

    16.2. Competition Benchmarking

    16.3. Market Share Analysis of Top Players

        16.3.1. By Regional

        16.3.2. By Product Type

        16.3.3. By Application

        16.3.4. By End User

17. Competition Analysis

    17.1. Competition Deep Dive

        17.1.1. Nikon Corporation

            17.1.1.1. Overview

            17.1.1.2. Product Portfolio

            17.1.1.3. Profitability by Market Segments

            17.1.1.4. Sales Footprint

            17.1.1.5. Strategy Overview

                17.1.1.5.1. Marketing Strategy

                17.1.1.5.2. Product Strategy

                17.1.1.5.3. Channel Strategy

        17.1.2. Carl Zeiss Meditec AG

            17.1.2.1. Overview

            17.1.2.2. Product Portfolio

            17.1.2.3. Profitability by Market Segments

            17.1.2.4. Sales Footprint

            17.1.2.5. Strategy Overview

                17.1.2.5.1. Marketing Strategy

                17.1.2.5.2. Product Strategy

                17.1.2.5.3. Channel Strategy

        17.1.3. Volcano Corporation

            17.1.3.1. Overview

            17.1.3.2. Product Portfolio

            17.1.3.3. Profitability by Market Segments

            17.1.3.4. Sales Footprint

            17.1.3.5. Strategy Overview

                17.1.3.5.1. Marketing Strategy

                17.1.3.5.2. Product Strategy

                17.1.3.5.3. Channel Strategy

        17.1.4. Thermo Fisher Scientific Inc.

            17.1.4.1. Overview

            17.1.4.2. Product Portfolio

            17.1.4.3. Profitability by Market Segments

            17.1.4.4. Sales Footprint

            17.1.4.5. Strategy Overview

                17.1.4.5.1. Marketing Strategy

                17.1.4.5.2. Product Strategy

                17.1.4.5.3. Channel Strategy

        17.1.5. Leica Microsystems GmbH

            17.1.5.1. Overview

            17.1.5.2. Product Portfolio

            17.1.5.3. Profitability by Market Segments

            17.1.5.4. Sales Footprint

            17.1.5.5. Strategy Overview

                17.1.5.5.1. Marketing Strategy

                17.1.5.5.2. Product Strategy

                17.1.5.5.3. Channel Strategy

        17.1.6. Edmund Optics Inc.

            17.1.6.1. Overview

            17.1.6.2. Product Portfolio

            17.1.6.3. Profitability by Market Segments

            17.1.6.4. Sales Footprint

            17.1.6.5. Strategy Overview

                17.1.6.5.1. Marketing Strategy

                17.1.6.5.2. Product Strategy

                17.1.6.5.3. Channel Strategy

        17.1.7. Bruker Corporation

            17.1.7.1. Overview

            17.1.7.2. Product Portfolio

            17.1.7.3. Profitability by Market Segments

            17.1.7.4. Sales Footprint

            17.1.7.5. Strategy Overview

                17.1.7.5.1. Marketing Strategy

                17.1.7.5.2. Product Strategy

                17.1.7.5.3. Channel Strategy

        17.1.8. Heidelberg Engineering GmbH

            17.1.8.1. Overview

            17.1.8.2. Product Portfolio

            17.1.8.3. Profitability by Market Segments

            17.1.8.4. Sales Footprint

            17.1.8.5. Strategy Overview

                17.1.8.5.1. Marketing Strategy

                17.1.8.5.2. Product Strategy

                17.1.8.5.3. Channel Strategy

        17.1.9. Luneau Technology

            17.1.9.1. Overview

            17.1.9.2. Product Portfolio

            17.1.9.3. Profitability by Market Segments

            17.1.9.4. Sales Footprint

            17.1.9.5. Strategy Overview

                17.1.9.5.1. Marketing Strategy

                17.1.9.5.2. Product Strategy

                17.1.9.5.3. Channel Strategy

        17.1.10. Michelson Diagnostics Limited

            17.1.10.1. Overview

            17.1.10.2. Product Portfolio

            17.1.10.3. Profitability by Market Segments

            17.1.10.4. Sales Footprint

            17.1.10.5. Strategy Overview

                17.1.10.5.1. Marketing Strategy

                17.1.10.5.2. Product Strategy

                17.1.10.5.3. Channel Strategy

        17.1.11. Topcon Corporation

            17.1.11.1. Overview

            17.1.11.2. Product Portfolio

            17.1.11.3. Profitability by Market Segments

            17.1.11.4. Sales Footprint

            17.1.11.5. Strategy Overview

                17.1.11.5.1. Marketing Strategy

                17.1.11.5.2. Product Strategy

                17.1.11.5.3. Channel Strategy

        17.1.12. NIDEK CO., LTD.

            17.1.12.1. Overview

            17.1.12.2. Product Portfolio

            17.1.12.3. Profitability by Market Segments

            17.1.12.4. Sales Footprint

            17.1.12.5. Strategy Overview

                17.1.12.5.1. Marketing Strategy

                17.1.12.5.2. Product Strategy

                17.1.12.5.3. Channel Strategy

        17.1.13. Headwall Photonics, Inc.

            17.1.13.1. Overview

            17.1.13.2. Product Portfolio

            17.1.13.3. Profitability by Market Segments

            17.1.13.4. Sales Footprint

            17.1.13.5. Strategy Overview

                17.1.13.5.1. Marketing Strategy

                17.1.13.5.2. Product Strategy

                17.1.13.5.3. Channel Strategy

18. Assumptions & Acronyms Used

19. Research Methodology

Don't pay for what you don't need

Customize your report by selecting specific countries or regions and save 30%!

List of Tables

Table 01: Global Market Value (US$ Million) Forecast by Region, 2017 to 2032

Table 02: Global Market Volume (Units) Forecast by Region, 2017 to 2032

Table 03: Global Market Value (US$ Million) Forecast by Product Type, 2017 to 2032

Table 04: Global Market Volume (Units) Forecast by Product Type, 2017 to 2032

Table 05: Global Market Value (US$ Million) Forecast by Application, 2017 to 2032

Table 06: Global Market Volume (Units) Forecast by Application, 2017 to 2032

Table 07: Global Market Value (US$ Million) Forecast by End User, 2017 to 2032

Table 08: Global Market Volume (Units) Forecast by End User, 2017 to 2032

Table 09: North America Market Value (US$ Million) Forecast by Country, 2017 to 2032

Table 10: North America Market Volume (Units) Forecast by Country, 2017 to 2032

Table 11: North America Market Value (US$ Million) Forecast by Product Type, 2017 to 2032

Table 12: North America Market Volume (Units) Forecast by Product Type, 2017 to 2032

Table 13: North America Market Value (US$ Million) Forecast by Application, 2017 to 2032

Table 14: North America Market Volume (Units) Forecast by Application, 2017 to 2032

Table 15: North America Market Value (US$ Million) Forecast by End User, 2017 to 2032

Table 16: North America Market Volume (Units) Forecast by End User, 2017 to 2032

Table 17: Latin America Market Value (US$ Million) Forecast by Country, 2017 to 2032

Table 18: Latin America Market Volume (Units) Forecast by Country, 2017 to 2032

Table 19: Latin America Market Value (US$ Million) Forecast by Product Type, 2017 to 2032

Table 20: Latin America Market Volume (Units) Forecast by Product Type, 2017 to 2032

Table 21: Latin America Market Value (US$ Million) Forecast by Application, 2017 to 2032

Table 22: Latin America Market Volume (Units) Forecast by Application, 2017 to 2032

Table 23: Latin America Market Value (US$ Million) Forecast by End User, 2017 to 2032

Table 24: Latin America Market Volume (Units) Forecast by End User, 2017 to 2032

Table 25: Europe Market Value (US$ Million) Forecast by Country, 2017 to 2032

Table 26: Europe Market Volume (Units) Forecast by Country, 2017 to 2032

Table 27: Europe Market Value (US$ Million) Forecast by Product Type, 2017 to 2032

Table 28: Europe Market Volume (Units) Forecast by Product Type, 2017 to 2032

Table 29: Europe Market Value (US$ Million) Forecast by Application, 2017 to 2032

Table 30: Europe Market Volume (Units) Forecast by Application, 2017 to 2032

Table 31: Europe Market Value (US$ Million) Forecast by End User, 2017 to 2032

Table 32: Europe Market Volume (Units) Forecast by End User, 2017 to 2032

Table 33: East Asia Market Value (US$ Million) Forecast by Country, 2017 to 2032

Table 34: East Asia Market Volume (Units) Forecast by Country, 2017 to 2032

Table 35: East Asia Market Value (US$ Million) Forecast by Product Type, 2017 to 2032

Table 36: East Asia Market Volume (Units) Forecast by Product Type, 2017 to 2032

Table 37: East Asia Market Value (US$ Million) Forecast by Application, 2017 to 2032

Table 38: East Asia Market Volume (Units) Forecast by Application, 2017 to 2032

Table 39: East Asia Market Value (US$ Million) Forecast by End User, 2017 to 2032

Table 40: East Asia Market Volume (Units) Forecast by End User, 2017 to 2032

Table 41: South Asia & Pacific Market Value (US$ Million) Forecast by Country, 2017 to 2032

Table 42: South Asia & Pacific Market Volume (Units) Forecast by Country, 2017 to 2032

Table 43: South Asia & Pacific Market Value (US$ Million) Forecast by Product Type, 2017 to 2032

Table 44: South Asia & Pacific Market Volume (Units) Forecast by Product Type, 2017 to 2032

Table 45: South Asia & Pacific Market Value (US$ Million) Forecast by Application, 2017 to 2032

Table 46: South Asia & Pacific Market Volume (Units) Forecast by Application, 2017 to 2032

Table 47: South Asia & Pacific Market Value (US$ Million) Forecast by End User, 2017 to 2032

Table 48: South Asia & Pacific Market Volume (Units) Forecast by End User, 2017 to 2032

Table 49: MEA Market Value (US$ Million) Forecast by Country, 2017 to 2032

Table 50: MEA Market Volume (Units) Forecast by Country, 2017 to 2032

Table 51: MEA Market Value (US$ Million) Forecast by Product Type, 2017 to 2032

Table 52: MEA Market Volume (Units) Forecast by Product Type, 2017 to 2032

Table 53: MEA Market Value (US$ Million) Forecast by Application, 2017 to 2032

Table 54: MEA Market Volume (Units) Forecast by Application, 2017 to 2032

Table 55: MEA Market Value (US$ Million) Forecast by End User, 2017 to 2032

Table 56: MEA Market Volume (Units) Forecast by End User, 2017 to 2032
Sabyasachi Ghosh
Sabyasachi Ghosh
Principal Consultant
LinkedIn
Talk to Analyst

Find your sweet spots for generating winning opportunities in this market.

List of Charts

Figure 01: Global Market Value (US$ Million) by Product Type, 2022 to 2032

Figure 02: Global Market Value (US$ Million) by Application, 2022 to 2032

Figure 03: Global Market Value (US$ Million) by End User, 2022 to 2032

Figure 04: Global Market Value (US$ Million) by Region, 2022 to 2032

Figure 05: Global Market Value (US$ Million) Analysis by Region, 2017 to 2032

Figure 06: Global Market Volume (Units) Analysis by Region, 2017 to 2032

Figure 07: Global Market Value Share (%) and BPS Analysis by Region, 2022 to 2032

Figure 08: Global Market Y-o-Y Growth (%) Projections by Region, 2022 to 2032

Figure 09: Global Market Value (US$ Million) Analysis by Product Type, 2017 to 2032

Figure 10: Global Market Volume (Units) Analysis by Product Type, 2017 to 2032

Figure 11: Global Market Value Share (%) and BPS Analysis by Product Type, 2022 to 2032

Figure 12: Global Market Y-o-Y Growth (%) Projections by Product Type, 2022 to 2032

Figure 13: Global Market Value (US$ Million) Analysis by Application, 2017 to 2032

Figure 14: Global Market Volume (Units) Analysis by Application, 2017 to 2032

Figure 15: Global Market Value Share (%) and BPS Analysis by Application, 2022 to 2032

Figure 16: Global Market Y-o-Y Growth (%) Projections by Application, 2022 to 2032

Figure 17: Global Market Value (US$ Million) Analysis by End User, 2017 to 2032

Figure 18: Global Market Volume (Units) Analysis by End User, 2017 to 2032

Figure 19: Global Market Value Share (%) and BPS Analysis by End User, 2022 to 2032

Figure 20: Global Market Y-o-Y Growth (%) Projections by End User, 2022 to 2032

Figure 21: Global Market Attractiveness by Product Type, 2022 to 2032

Figure 22: Global Market Attractiveness by Application, 2022 to 2032

Figure 23: Global Market Attractiveness by End User, 2022 to 2032

Figure 24: Global Market Attractiveness by Region, 2022 to 2032

Figure 25: North America Market Value (US$ Million) by Product Type, 2022 to 2032

Figure 26: North America Market Value (US$ Million) by Application, 2022 to 2032

Figure 27: North America Market Value (US$ Million) by End User, 2022 to 2032

Figure 28: North America Market Value (US$ Million) by Country, 2022 to 2032

Figure 29: North America Market Value (US$ Million) Analysis by Country, 2017 to 2032

Figure 30: North America Market Volume (Units) Analysis by Country, 2017 to 2032

Figure 31: North America Market Value Share (%) and BPS Analysis by Country, 2022 to 2032

Figure 32: North America Market Y-o-Y Growth (%) Projections by Country, 2022 to 2032

Figure 33: North America Market Value (US$ Million) Analysis by Product Type, 2017 to 2032

Figure 34: North America Market Volume (Units) Analysis by Product Type, 2017 to 2032

Figure 35: North America Market Value Share (%) and BPS Analysis by Product Type, 2022 to 2032

Figure 36: North America Market Y-o-Y Growth (%) Projections by Product Type, 2022 to 2032

Figure 37: North America Market Value (US$ Million) Analysis by Application, 2017 to 2032

Figure 38: North America Market Volume (Units) Analysis by Application, 2017 to 2032

Figure 39: North America Market Value Share (%) and BPS Analysis by Application, 2022 to 2032

Figure 40: North America Market Y-o-Y Growth (%) Projections by Application, 2022 to 2032

Figure 41: North America Market Value (US$ Million) Analysis by End User, 2017 to 2032

Figure 42: North America Market Volume (Units) Analysis by End User, 2017 to 2032

Figure 43: North America Market Value Share (%) and BPS Analysis by End User, 2022 to 2032

Figure 44: North America Market Y-o-Y Growth (%) Projections by End User, 2022 to 2032

Figure 45: North America Market Attractiveness by Product Type, 2022 to 2032

Figure 46: North America Market Attractiveness by Application, 2022 to 2032

Figure 47: North America Market Attractiveness by End User, 2022 to 2032

Figure 48: North America Market Attractiveness by Country, 2022 to 2032

Figure 49: Latin America Market Value (US$ Million) by Product Type, 2022 to 2032

Figure 50: Latin America Market Value (US$ Million) by Application, 2022 to 2032

Figure 51: Latin America Market Value (US$ Million) by End User, 2022 to 2032

Figure 52: Latin America Market Value (US$ Million) by Country, 2022 to 2032

Figure 53: Latin America Market Value (US$ Million) Analysis by Country, 2017 to 2032

Figure 54: Latin America Market Volume (Units) Analysis by Country, 2017 to 2032

Figure 55: Latin America Market Value Share (%) and BPS Analysis by Country, 2022 to 2032

Figure 56: Latin America Market Y-o-Y Growth (%) Projections by Country, 2022 to 2032

Figure 57: Latin America Market Value (US$ Million) Analysis by Product Type, 2017 to 2032

Figure 58: Latin America Market Volume (Units) Analysis by Product Type, 2017 to 2032

Figure 59: Latin America Market Value Share (%) and BPS Analysis by Product Type, 2022 to 2032

Figure 60: Latin America Market Y-o-Y Growth (%) Projections by Product Type, 2022 to 2032

Figure 61: Latin America Market Value (US$ Million) Analysis by Application, 2017 to 2032

Figure 62: Latin America Market Volume (Units) Analysis by Application, 2017 to 2032

Figure 63: Latin America Market Value Share (%) and BPS Analysis by Application, 2022 to 2032

Figure 64: Latin America Market Y-o-Y Growth (%) Projections by Application, 2022 to 2032

Figure 65: Latin America Market Value (US$ Million) Analysis by End User, 2017 to 2032

Figure 66: Latin America Market Volume (Units) Analysis by End User, 2017 to 2032

Figure 67: Latin America Market Value Share (%) and BPS Analysis by End User, 2022 to 2032

Figure 68: Latin America Market Y-o-Y Growth (%) Projections by End User, 2022 to 2032

Figure 69: Latin America Market Attractiveness by Product Type, 2022 to 2032

Figure 70: Latin America Market Attractiveness by Application, 2022 to 2032

Figure 71: Latin America Market Attractiveness by End User, 2022 to 2032

Figure 72: Latin America Market Attractiveness by Country, 2022 to 2032

Figure 73: Europe Market Value (US$ Million) by Product Type, 2022 to 2032

Figure 74: Europe Market Value (US$ Million) by Application, 2022 to 2032

Figure 75: Europe Market Value (US$ Million) by End User, 2022 to 2032

Figure 76: Europe Market Value (US$ Million) by Country, 2022 to 2032

Figure 77: Europe Market Value (US$ Million) Analysis by Country, 2017 to 2032

Figure 78: Europe Market Volume (Units) Analysis by Country, 2017 to 2032

Figure 79: Europe Market Value Share (%) and BPS Analysis by Country, 2022 to 2032

Figure 80: Europe Market Y-o-Y Growth (%) Projections by Country, 2022 to 2032

Figure 81: Europe Market Value (US$ Million) Analysis by Product Type, 2017 to 2032

Figure 82: Europe Market Volume (Units) Analysis by Product Type, 2017 to 2032

Figure 83: Europe Market Value Share (%) and BPS Analysis by Product Type, 2022 to 2032

Figure 84: Europe Market Y-o-Y Growth (%) Projections by Product Type, 2022 to 2032

Figure 85: Europe Market Value (US$ Million) Analysis by Application, 2017 to 2032

Figure 86: Europe Market Volume (Units) Analysis by Application, 2017 to 2032

Figure 87: Europe Market Value Share (%) and BPS Analysis by Application, 2022 to 2032

Figure 88: Europe Market Y-o-Y Growth (%) Projections by Application, 2022 to 2032

Figure 89: Europe Market Value (US$ Million) Analysis by End User, 2017 to 2032

Figure 90: Europe Market Volume (Units) Analysis by End User, 2017 to 2032

Figure 91: Europe Market Value Share (%) and BPS Analysis by End User, 2022 to 2032

Figure 92: Europe Market Y-o-Y Growth (%) Projections by End User, 2022 to 2032

Figure 93: Europe Market Attractiveness by Product Type, 2022 to 2032

Figure 94: Europe Market Attractiveness by Application, 2022 to 2032

Figure 95: Europe Market Attractiveness by End User, 2022 to 2032

Figure 96: Europe Market Attractiveness by Country, 2022 to 2032

Figure 97: East Asia Market Value (US$ Million) by Product Type, 2022 to 2032

Figure 98: East Asia Market Value (US$ Million) by Application, 2022 to 2032

Figure 99: East Asia Market Value (US$ Million) by End User, 2022 to 2032

Figure 100: East Asia Market Value (US$ Million) by Country, 2022 to 2032

Figure 101: East Asia Market Value (US$ Million) Analysis by Country, 2017 to 2032

Figure 102: East Asia Market Volume (Units) Analysis by Country, 2017 to 2032

Figure 103: East Asia Market Value Share (%) and BPS Analysis by Country, 2022 to 2032

Figure 104: East Asia Market Y-o-Y Growth (%) Projections by Country, 2022 to 2032

Figure 105: East Asia Market Value (US$ Million) Analysis by Product Type, 2017 to 2032

Figure 106: East Asia Market Volume (Units) Analysis by Product Type, 2017 to 2032

Figure 107: East Asia Market Value Share (%) and BPS Analysis by Product Type, 2022 to 2032

Figure 108: East Asia Market Y-o-Y Growth (%) Projections by Product Type, 2022 to 2032

Figure 109: East Asia Market Value (US$ Million) Analysis by Application, 2017 to 2032

Figure 110: East Asia Market Volume (Units) Analysis by Application, 2017 to 2032

Figure 111: East Asia Market Value Share (%) and BPS Analysis by Application, 2022 to 2032

Figure 112: East Asia Market Y-o-Y Growth (%) Projections by Application, 2022 to 2032

Figure 113: East Asia Market Value (US$ Million) Analysis by End User, 2017 to 2032

Figure 114: East Asia Market Volume (Units) Analysis by End User, 2017 to 2032

Figure 115: East Asia Market Value Share (%) and BPS Analysis by End User, 2022 to 2032

Figure 116: East Asia Market Y-o-Y Growth (%) Projections by End User, 2022 to 2032

Figure 117: East Asia Market Attractiveness by Product Type, 2022 to 2032

Figure 118: East Asia Market Attractiveness by Application, 2022 to 2032

Figure 119: East Asia Market Attractiveness by End User, 2022 to 2032

Figure 120: East Asia Market Attractiveness by Country, 2022 to 2032

Figure 121: South Asia & Pacific Market Value (US$ Million) by Product Type, 2022 to 2032

Figure 122: South Asia & Pacific Market Value (US$ Million) by Application, 2022 to 2032

Figure 123: South Asia & Pacific Market Value (US$ Million) by End User, 2022 to 2032

Figure 124: South Asia & Pacific Market Value (US$ Million) by Country, 2022 to 2032

Figure 125: South Asia & Pacific Market Value (US$ Million) Analysis by Country, 2017 to 2032

Figure 126: South Asia & Pacific Market Volume (Units) Analysis by Country, 2017 to 2032

Figure 127: South Asia & Pacific Market Value Share (%) and BPS Analysis by Country, 2022 to 2032

Figure 128: South Asia & Pacific Market Y-o-Y Growth (%) Projections by Country, 2022 to 2032

Figure 129: South Asia & Pacific Market Value (US$ Million) Analysis by Product Type, 2017 to 2032

Figure 130: South Asia & Pacific Market Volume (Units) Analysis by Product Type, 2017 to 2032

Figure 131: South Asia & Pacific Market Value Share (%) and BPS Analysis by Product Type, 2022 to 2032

Figure 132: South Asia & Pacific Market Y-o-Y Growth (%) Projections by Product Type, 2022 to 2032

Figure 133: South Asia & Pacific Market Value (US$ Million) Analysis by Application, 2017 to 2032

Figure 134: South Asia & Pacific Market Volume (Units) Analysis by Application, 2017 to 2032

Figure 135: South Asia & Pacific Market Value Share (%) and BPS Analysis by Application, 2022 to 2032

Figure 136: South Asia & Pacific Market Y-o-Y Growth (%) Projections by Application, 2022 to 2032

Figure 137: South Asia & Pacific Market Value (US$ Million) Analysis by End User, 2017 to 2032

Figure 138: South Asia & Pacific Market Volume (Units) Analysis by End User, 2017 to 2032

Figure 139: South Asia & Pacific Market Value Share (%) and BPS Analysis by End User, 2022 to 2032

Figure 140: South Asia & Pacific Market Y-o-Y Growth (%) Projections by End User, 2022 to 2032

Figure 141: South Asia & Pacific Market Attractiveness by Product Type, 2022 to 2032

Figure 142: South Asia & Pacific Market Attractiveness by Application, 2022 to 2032

Figure 143: South Asia & Pacific Market Attractiveness by End User, 2022 to 2032

Figure 144: South Asia & Pacific Market Attractiveness by Country, 2022 to 2032

Figure 145: MEA Market Value (US$ Million) by Product Type, 2022 to 2032

Figure 146: MEA Market Value (US$ Million) by Application, 2022 to 2032

Figure 147: MEA Market Value (US$ Million) by End User, 2022 to 2032

Figure 148: MEA Market Value (US$ Million) by Country, 2022 to 2032

Figure 149: MEA Market Value (US$ Million) Analysis by Country, 2017 to 2032

Figure 150: MEA Market Volume (Units) Analysis by Country, 2017 to 2032

Figure 151: MEA Market Value Share (%) and BPS Analysis by Country, 2022 to 2032

Figure 152: MEA Market Y-o-Y Growth (%) Projections by Country, 2022 to 2032

Figure 153: MEA Market Value (US$ Million) Analysis by Product Type, 2017 to 2032

Figure 154: MEA Market Volume (Units) Analysis by Product Type, 2017 to 2032

Figure 155: MEA Market Value Share (%) and BPS Analysis by Product Type, 2022 to 2032

Figure 156: MEA Market Y-o-Y Growth (%) Projections by Product Type, 2022 to 2032

Figure 157: MEA Market Value (US$ Million) Analysis by Application, 2017 to 2032

Figure 158: MEA Market Volume (Units) Analysis by Application, 2017 to 2032

Figure 159: MEA Market Value Share (%) and BPS Analysis by Application, 2022 to 2032

Figure 160: MEA Market Y-o-Y Growth (%) Projections by Application, 2022 to 2032

Figure 161: MEA Market Value (US$ Million) Analysis by End User, 2017 to 2032

Figure 162: MEA Market Volume (Units) Analysis by End User, 2017 to 2032

Figure 163: MEA Market Value Share (%) and BPS Analysis by End User, 2022 to 2032

Figure 164: MEA Market Y-o-Y Growth (%) Projections by End User, 2022 to 2032

Figure 165: MEA Market Attractiveness by Product Type, 2022 to 2032

Figure 166: MEA Market Attractiveness by Application, 2022 to 2032

Figure 167: MEA Market Attractiveness by End User, 2022 to 2032

Figure 168: MEA Market Attractiveness by Country, 2022 to 2032

Recommendations

Healthcare

Molecular Imaging Market

Published : August 2023

Healthcare

Perfusion Imaging Market

Published : June 2022

Explore Healthcare Insights

View Reports

Optical Imaging Market

We value your privacy

We use cookies to enhance your browsing experience, serve personalized ads or content, and analyze our traffic.

By clicking "Accept All", you consent to our use of cookies. Cookie Policy