The Optical Cross Connect Market is estimated to be valued at USD 4631.5 million in 2025 and is projected to reach USD 12233.1 million by 2035, registering a compound annual growth rate (CAGR) of 10.2% over the forecast period.
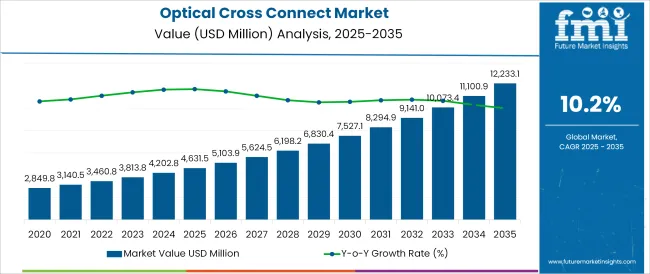
| Attribute | Value |
|---|---|
| Market Size in 2025 | USD 4631.5 million |
| Market Size in 2035 | USD 12233.1 million |
| CAGR (2025 to 2035) | 10.2% |
The optical cross connect market is evolving as a cornerstone of next-generation optical networks, supported by the increasing demand for higher bandwidth, flexible routing, and reduced operational costs in data transmission. As documented in telecom industry journals and network operator disclosures, rising deployment of cloud data centers, 5G backhaul networks, and high-capacity submarine cables is driving investment in optical switching infrastructure.
Optical cross connects are being adopted to improve scalability and agility of fiber networks while reducing power consumption and space requirements compared to traditional electronic switching. The market outlook remains promising, with future growth expected to benefit from continued advancements in photonic integration, support for software-defined networking, and the growing importance of dynamic provisioning in carrier and enterprise networks.
Policy emphasis on energy-efficient, high-throughput communication networks and the transition toward all-optical networks are paving the way for widespread adoption and long-term expansion.
The market is segmented by Type and Application and region. By Type, the market is divided into Fiber Cross-Connect (FXC), Wavelength Selective Cross-Connect (WSXC), and Wavelength Interchanging Cross-Connect (WIXC). In terms of Application, the market is classified into Transparent OXCs (optical switching), Opaque OXCs (electronic switching), and Translucent OXCs (optical and electronic switching).
Regionally, the market is classified into North America, Latin America, Western Europe, Eastern Europe, Balkan & Baltic Countries, Russia & Belarus, Central Asia, East Asia, South Asia & Pacific, and the Middle East & Africa.
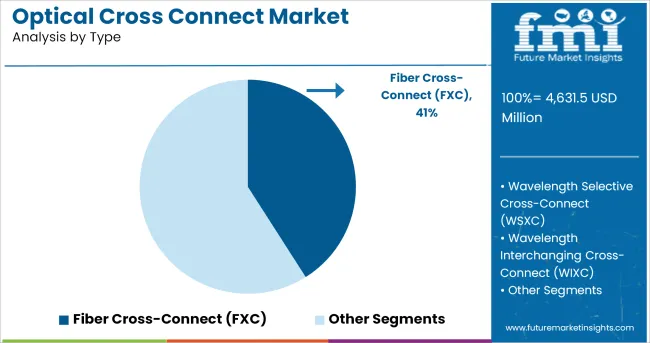
When segmented by type, the fiber cross-connect (FXC) segment is expected to account for 41.0% of the total market revenue in 2025, affirming its leadership position. This dominance has been reinforced by FXC’s ability to deliver a reliable, low-latency, and cost-effective solution for managing complex fiber infrastructures.
Investor presentations and vendor whitepapers have noted that FXCs are being preferred for their simplicity, ease of deployment, and mechanical robustness, which make them suitable for both core and access network environments. The passive nature of FXCs has also been instrumental in reducing power requirements and enhancing network resilience, aligning with operators’ sustainability objectives.
Furthermore, FXCs have been widely adopted as a foundational component for establishing flexible, high density fiber connections in data centers and metro networks, supported by their compatibility with diverse connector types and scalable architectures. These attributes have consolidated FXC’s role as the preferred choice in network scenarios demanding reliability and operational simplicity.
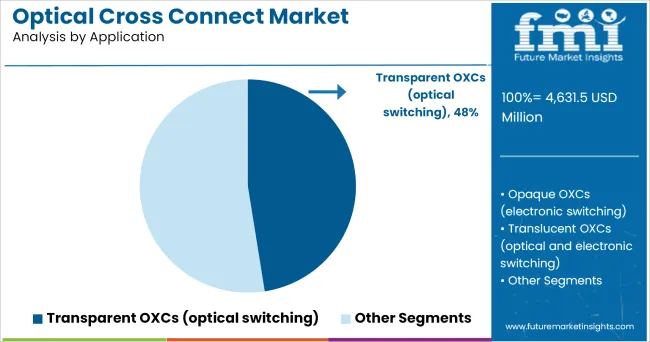
Segmented by application, transparent optical cross connects (OXCs) focused on optical switching are projected to capture 47.5% of the market revenue in 2025, making them the leading application segment. This leadership has been driven by the need for high-capacity, low latency, and dynamically reconfigurable optical networks to support burgeoning data traffic.
According to annual reports and technology roadmaps from major telecom operators, transparent OXCs have gained prominence for their ability to switch wavelengths directly at the optical layer without optical-to-electrical conversion, resulting in significant improvements in speed and energy efficiency. Technological advancements in wavelength-selective switching and integration of reconfigurable optical add-drop multiplexers (ROADMs) have further enhanced their performance and flexibility.
Additionally, transparent OXCs have been widely deployed in core and metro networks as operators seek to implement agile, software-defined optical transport systems that reduce operational expenses and accommodate evolving traffic patterns. These factors have firmly established transparent OXCs as the preferred application for future-proof optical networking.
There is an increase in demand to introduce advance technologies having the potential to transport IP/Ethernet traffic from telecommunication industries is driving the growth of optical cross-connect. The tools are given by operators to move beyond the flexibility limitations as they provide network switching flexibility and increased bandwidth capability and.
This is facilitated by optical cross connect switches. Major benefits like lower network cost and higher fiber efficiency are ensured by optical cross connect switches.
The optical cross connect switches offers features of remote and automated control functions, which further reduces overall operational cost of telecommunication carriers. These major features of optical cross connect (OXC) devices are helping the market to grow in upcoming years.
There has been a dramatic growth in traffic, which is fueled by explosion in Internet access, data communications, the emergence of new-generation multi-media services and mobile telephony. This is further triggering the growth of optical cross-connect (OXC) globally.
Long-haul and metropolitan telecom networks (MAN) are using optical networks. Low power and latency, and increased throughput are the major benefits provided by these optical networks. Initially, fat circuit pipes were formed by replacing copper channels from fiber for point-to-point communication.
This has led to evolving of opto-electro-optical regeneration at every network node. MAN and long- haul networks are now evolving to all optical approaches.
Smaller distances in LAN and DC networks are covered by the use of optics. Currently, electrical links have been replaced by optics. Higher bandwidth, reducing the power consumption and latency are achieved by this process. Such trends are helping the OXC market to grow.
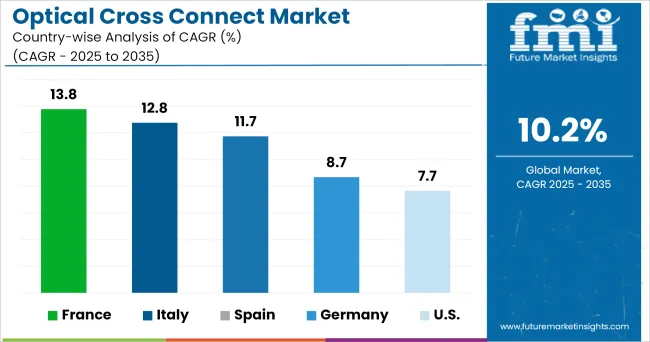
The demand for OXC devices is anticipated to grow at a significant rate in North America owing to increasing penetration of introduction of technologies having the ability to transport IP/Ethernet traffic. In addition, United States has majority of the key vendors of OXC solutions.
This is one of the major driving factor driving the growth of optical cross-connect. All the major companies in the region are moving towards the adoption of OXC solutions. Industries of this region have shown a keen interest in implementing OXC technology. The growing demand for optical networks in North America has opened new growth avenues for OXC technology.
Currently, Europe region is one of the biggest market in international optical cross-connect devices consumption. Many key players in the region are aiming for collaboration, acquisition and new product strategies to escalate their business presence.
The growing demand for exchanging optical signals between different optical paths solution in the country and globally through optical cross-connect technology has opened new growth avenues for OXC market in the region. OXC technology solutions has moved far beyond in Europe and this leads the way for growth of its market globally.
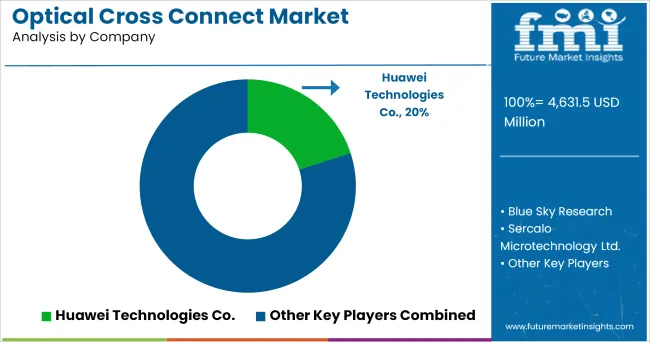
Some of the leading vendors of optical cross connect include
These vendors are adopting various key strategies, to increase their customer base locally and globally. They are also spending millions of dollars into product R&D to fulfill the unmet needs of their customers for optical cross connect.
The report is a compilation of first-hand information, qualitative and quantitative assessment by industry analysts, inputs from industry experts and industry participants across the value chain. The report provides in-depth analysis of parent market trends, macro-economic indicators and governing factors along with market attractiveness as per segments.
The report also maps the qualitative impact of various market factors on market segments and geographies.
The global optical cross connect market is estimated to be valued at USD 4,631.5 million in 2025.
The market size for the optical cross connect market is projected to reach USD 12,233.1 million by 2035.
The optical cross connect market is expected to grow at a 10.2% CAGR between 2025 and 2035.
The key product types in optical cross connect market are fiber cross-connect (fxc), wavelength selective cross-connect (wsxc) and wavelength interchanging cross-connect (wixc).
In terms of application, transparent oxcs (optical switching) segment to command 47.5% share in the optical cross connect market in 2025.


Our Research Products

The "Full Research Suite" delivers actionable market intel, deep dives on markets or technologies, so clients act faster, cut risk, and unlock growth.

The Leaderboard benchmarks and ranks top vendors, classifying them as Established Leaders, Leading Challengers, or Disruptors & Challengers.

Locates where complements amplify value and substitutes erode it, forecasting net impact by horizon

We deliver granular, decision-grade intel: market sizing, 5-year forecasts, pricing, adoption, usage, revenue, and operational KPIs—plus competitor tracking, regulation, and value chains—across 60 countries broadly.

Spot the shifts before they hit your P&L. We track inflection points, adoption curves, pricing moves, and ecosystem plays to show where demand is heading, why it is changing, and what to do next across high-growth markets and disruptive tech

Real-time reads of user behavior. We track shifting priorities, perceptions of today’s and next-gen services, and provider experience, then pace how fast tech moves from trial to adoption, blending buyer, consumer, and channel inputs with social signals (#WhySwitch, #UX).

Partner with our analyst team to build a custom report designed around your business priorities. From analysing market trends to assessing competitors or crafting bespoke datasets, we tailor insights to your needs.
Supplier Intelligence
Discovery & Profiling
Capacity & Footprint
Performance & Risk
Compliance & Governance
Commercial Readiness
Who Supplies Whom
Scorecards & Shortlists
Playbooks & Docs
Category Intelligence
Definition & Scope
Demand & Use Cases
Cost Drivers
Market Structure
Supply Chain Map
Trade & Policy
Operating Norms
Deliverables
Buyer Intelligence
Account Basics
Spend & Scope
Procurement Model
Vendor Requirements
Terms & Policies
Entry Strategy
Pain Points & Triggers
Outputs
Pricing Analysis
Benchmarks
Trends
Should-Cost
Indexation
Landed Cost
Commercial Terms
Deliverables
Brand Analysis
Positioning & Value Prop
Share & Presence
Customer Evidence
Go-to-Market
Digital & Reputation
Compliance & Trust
KPIs & Gaps
Outputs
Full Research Suite comprises of:
Market outlook & trends analysis
Interviews & case studies
Strategic recommendations
Vendor profiles & capabilities analysis
5-year forecasts
8 regions and 60+ country-level data splits
Market segment data splits
12 months of continuous data updates
DELIVERED AS:
PDF EXCEL ONLINE
Optical Connector Polishing Films Market Size and Share Forecast Outlook 2025 to 2035
Cross Interconnection Protection Box Market Size and Share Forecast Outlook 2025 to 2035
Optical Fiber Connectivity Market Size and Share Forecast Outlook 2025 to 2035
Optical Fiber Cold Joint Market Size and Share Forecast Outlook 2025 to 2035
Cross-chain NFT Market Size and Share Forecast Outlook 2025 to 2035
Optical Spectrum Analyzer Market Size and Share Forecast Outlook 2025 to 2035
Optical Extinction Analyzer Market Size and Share Forecast Outlook 2025 to 2035
Optical Character Recognition Market Forecast and Outlook 2025 to 2035
Cross-species Organ Transplantation Market Forecast and Outlook 2025 to 2035
Optical Satellite Market Size and Share Forecast Outlook 2025 to 2035
Optical Imaging Market Size and Share Forecast Outlook 2025 to 2035
Cross Corner Industrial Bags Market Size and Share Forecast Outlook 2025 to 2035
Optical Whitening Agents Market Size and Share Forecast Outlook 2025 to 2035
Optical Fingerprint Collector Market Size and Share Forecast Outlook 2025 to 2035
Optical Lens Materials Market Size and Share Forecast Outlook 2025 to 2035
Connected Sensors Market Size and Share Forecast Outlook 2025 to 2035
Cross-Linked Polyethylene Market Size and Share Forecast Outlook 2025 to 2035
Optical Microscope Market Size and Share Forecast Outlook 2025 to 2035
Optical Component Tester Market Size and Share Forecast Outlook 2025 to 2035
Connected Diagnostics Market Size and Share Forecast Outlook 2025 to 2035

Thank you!
You will receive an email from our Business Development Manager. Please be sure to check your SPAM/JUNK folder too.
Chat With
MaRIA