Optical Satellite Market Size and Share Forecast Outlook From 2025 to 2035

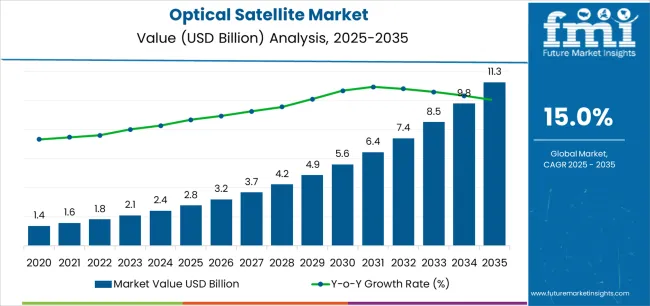
The Optical Satellite Market is estimated to be valued at USD 2.8 billion in 2025 and is projected to reach USD 11.3 billion by 2035, registering a compound annual growth rate (CAGR) of 15.0% over the forecast period.

The optical satellite market is expanding steadily, driven by the growing demand for high-resolution imagery, increased government and commercial investments in Earth observation, and advancements in optical payload technology. The current market environment reflects strong momentum from defense surveillance, environmental monitoring, and infrastructure mapping applications. Rapid miniaturization of satellite components and the emergence of low-cost launch solutions have significantly lowered entry barriers, enabling broader participation by private operators.

The proliferation of data analytics platforms and integration of optical imagery with AI and GIS systems have further enhanced operational efficiency and application diversity. The future outlook remains highly optimistic as governments emphasize climate monitoring, disaster management, and agricultural planning using optical satellite data.

Ongoing improvements in imaging precision, onboard data processing, and inter-satellite communication are expected to strengthen market competitiveness. Collectively, these factors position the optical satellite segment as a critical enabler of next-generation space-based data infrastructure.

Quick Stats for Optical Satellite Market

  • Optical Satellite Market Industry Value (2025): USD 2.8 billion
  • Optical Satellite Market Forecast Value (2035): USD 11.3 billion
  • Optical Satellite Market Forecast CAGR: 15.0%
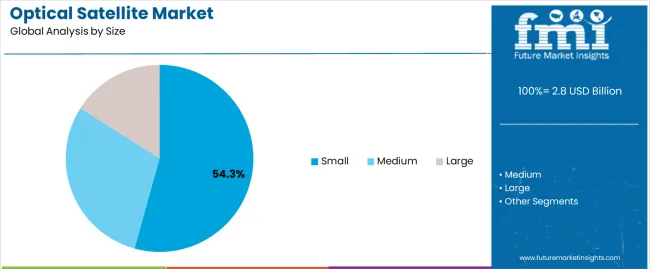
  • Leading Segment in Optical Satellite Market in 2025: Small (54.3%)
  • Key Growth Region in Optical Satellite Market: North America, Asia-Pacific, Europe
  • Top Key Players in Optical Satellite Market: SpaceX, Lockheed Martin Corporation, Ball Corporation, Airbus Defence And Space, L3Harris Technologies Corporation, EchoStar Satellite Services, Hughes Network Systems, Eutelsat, Arqiva, Telesat
Metric Value
Optical Satellite Market Estimated Value in (2025 E) USD 2.8 billion
Optical Satellite Market Forecast Value in (2035 F) USD 11.3 billion
Forecast CAGR (2025 to 2035) 15.0%

Optical Satellite Market Market Value Analysis

Segmental Analysis

The market is segmented by Size, Operational Orbit, Application, Component, and End User and region. By Size, the market is divided into Small, Medium, and Large. In terms of Operational Orbit, the market is classified into LEO and MEO/GEO. Based on Application, the market is segmented into Earth Observation and Communication. By Component, the market is divided into Imaging & Sensing Systems and Optical Communication Systems. By End User, the market is segmented into Commercial, Government, and Defence. Regionally, the market is classified into North America, Latin America, Western Europe, Eastern Europe, Balkan & Baltic Countries, Russia & Belarus, Central Asia, East Asia, South Asia & Pacific, and the Middle East & Africa.
Insights into the Small Segment

Optical Satellite Market Analysis By Size

The small satellite segment leads the size category with approximately 54.3% share, reflecting its cost-effectiveness, shorter development cycles, and operational flexibility. The segment’s growth is fueled by the increasing adoption of small satellites for high-frequency imaging and rapid data collection missions.

Their ability to be deployed in constellations enhances temporal resolution and coverage, meeting the growing demand for near-real-time Earth observation data. Reduced launch costs and advancements in microelectronics have further democratized access to space, enabling startups and research organizations to participate actively in satellite imaging missions.

Additionally, small satellites provide scalability advantages, allowing incremental constellation expansion as demand increases. With ongoing miniaturization of sensors and communication systems, the small segment is expected to maintain its leadership as the preferred configuration for commercial and governmental optical satellite programs.
Insights into the LEO Segment

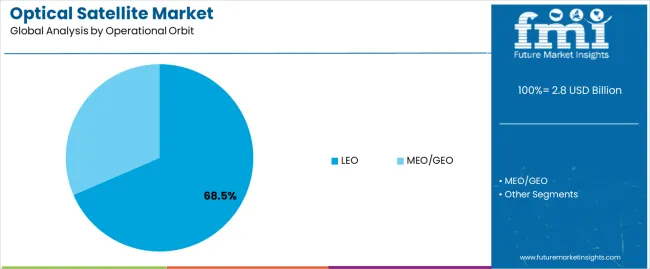
Optical Satellite Market Analysis By Operational Orbit

The low Earth orbit (LEO) segment dominates the operational orbit category, holding approximately 68.5% share. This dominance stems from the orbit’s proximity to Earth, which allows for high-resolution imaging, lower latency, and reduced signal degradation. Satellites in LEO can capture detailed imagery suitable for environmental monitoring, defense surveillance, and urban infrastructure analysis.

The cost advantages associated with shorter orbital distances have encouraged a proliferation of small satellite constellations, facilitating continuous global coverage. LEO’s suitability for optical payloads that require frequent revisit times enhances its importance in both governmental and commercial missions.

The segment benefits from advancements in attitude control and imaging stabilization technologies, which improve data quality and operational efficiency. With an increasing number of launches targeting LEO for Earth observation and communication integration, the segment is poised to sustain its leading position throughout the forecast horizon.
Insights into the Earth Observation Segment

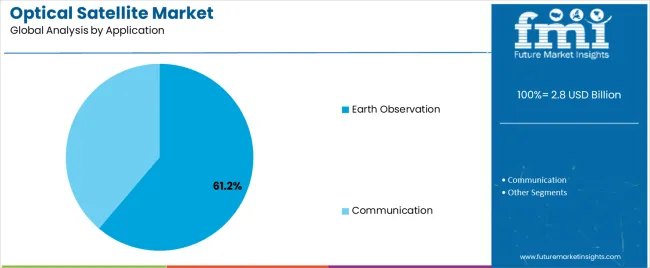
Optical Satellite Market Analysis By Application

The Earth observation segment represents approximately 61.2% share of the optical satellite market, underscoring its critical role as the primary application area. This segment’s leadership is driven by rising global demand for geospatial intelligence in agriculture, defense, environmental management, and disaster response.

Optical imaging capabilities enable precise monitoring of surface changes, resource mapping, and infrastructure development, providing actionable insights for both government and commercial users. The proliferation of data analytics platforms and AI-driven interpretation tools has enhanced the utility and accessibility of Earth observation data.

Increased funding from national space agencies and private enterprises for mapping and monitoring programs further supports segment growth. With the continuing expansion of downstream analytics services and the integration of optical data with radar and hyperspectral inputs, the Earth observation segment is expected to remain the dominant driver of market demand in the coming years.

Sales Trend Analysis from 2020 to 2024 Compared to Market Outlook for 2025 to 2035

The scope for global optical satellite market insights expanded at a 20.3% CAGR between 2020 and 2025. The market is anticipated to develop at a CAGR of 15.8% over the forecast period from 2025 to 2035.

Historical CAGR from 2020 to 2025 20.3%
Forecast CAGR from 2025 to 2035 15.8%

Between 2020 and 2025, the global market experienced remarkable growth, expanding at an impressive CAGR of 20.3%. This robust expansion was driven by increasing demand for high-resolution satellite imagery across various industries, advancements in satellite technology, and growing investments in space exploration and Earth observation missions.

From 2025 to 2035, the market is projected to continue growing, albeit slightly slower, with a forecasted CAGR of 15.8%. Despite the deceleration in growth rate, the market is expected to maintain a strong upward trajectory, fueled by ongoing demand for satellite-based solutions, expanding applications of optical satellites in commercial and governmental sectors, and further advancements in satellite technology.

Factors such as increasing focus on sustainability, environmental monitoring, disaster management, and emerging trends like satellite constellation deployments and the integration of optical satellites with artificial intelligence are expected to contribute to market growth during the forecast period.

Emerging Opportunities in the Optical Satellite Marke

Attributes Details
Opportunities
  • Increasing demand for real-time and actionable geospatial data for disaster management, emergency response, and climate change monitoring presents opportunities for satellite operators to provide critical services.
  • Expansion of satellite constellation deployments and the commercialization of space exploration activities offer opportunities for market players to diversify their product portfolios and expand their market reach.
  • Regulatory developments and policies related to space exploration, satellite deployment, and data privacy present opportunities for market players to address emerging regulatory requirements and ensure compliance.

Analysis of Top Countries Launching, Operating, and Commercializing Optical Satellite Systems

The table emphasizes the CAGRs in five pivotal countries, namely the United States, Japan, China, the United Kingdom, and South Korea.

South Korea is emerging as a dynamic and rapidly advancing market, expected to achieve significant growth with an impressive 18% CAGR by 2035. Renowned for its commitment to innovation, the country plays a pivotal role across various industries, showcasing a thriving economic landscape marked by continuous progress.

The substantial CAGR underscores a proactive approach to embracing and propelling advancements in the market, solidifying its position as a key contributor to the global industry. This highlights the dedication to sustainable practices, positioning South Korea as a notable player driving positive developments within the optical satellite sector globally.

Countries CAGRs from 2025 to 2035
The United States 16.1%
Japan 17.5%
China 16.7%
The United Kingdom 17.1%
South Korea 18%

Military and Defense Purposes Raise the Market in the United States

The United States employs optical satellite technology extensively for military and defense purposes, including reconnaissance, surveillance, and intelligence gathering. Additionally, it is utilized for agriculture, environmental monitoring, disaster management, urban planning, and infrastructure development.

Demand for Optical Satellites in Japan Rises Due to Disaster Management and Mitigation Facilities

Japan employs optical satellites for disaster management and mitigation due to its susceptibility to earthquakes, tsunamis, and other natural disasters. They are also used for agriculture, environmental monitoring, urban planning, and coastal surveillance.

Rapid Growth in Economy Surges the Market Growth in China

China utilizes optical satellite technology for similar applications as other countries, including defense, disaster management, agriculture, and environmental monitoring.

The rapidly growing economy in China and urbanization drive the need for satellite imagery in infrastructure development and city planning.

Extensive Usage of Maritime Surveillance Boosts the Market in the United Kingdom

The United Kingdom relies on optical satellite technology for defense and security, environmental monitoring, agriculture, and urban planning. It is also used in maritime surveillance due to the extensive coastline in the United Kingdom.

An Increase in Innovation and Technology Drives Market Growth in South Korea

South Korea utilizes optical satellites for various applications, including defense and security, environmental monitoring, agriculture, urban planning, and infrastructure development. The commitment to innovation and technology in South Korea drives its extensive use of optical satellite imagery.

Optical Satellite Industry Analysis by Top Investment Segments

The table below provides an overview of the optical satellite landscape on the basis of size and operational orbit. Small is projected to lead the market size at a 15.6% CAGR by 2035, while LEO in the operational orbit category is likely to expand at a CAGR of 15.4% by 2035.

Small satellites are projected to lead the market size due to their cost-effectiveness and versatility.

Low Earth Orbit (LEO) in the operational orbit category is expected to expand primarily due to its advantages in providing high-resolution imagery and faster data transmission.

Category CAGRs from 2025 to 2035
Small 15.6%
LEO 15.4%

Small Size Holds a Dominant Position in the Market

The dominance of small satellites in market size signifies a shift towards miniaturization and cost-effectiveness in satellite technology. Small satellites offer advantages such as lower manufacturing and launch costs and increased agility and flexibility in mission deployment. These factors drive their adoption across various applications, including Earth observation, communication, and remote sensing.

LEO Emerges as a Significant Segment in the Market

LEO satellites, on the other hand, are positioned closer to Earth, enabling higher-resolution imaging and faster data transmission compared to satellites in higher orbits.

The projected growth of LEO satellites reflects increasing demand for real-time data and imagery across agriculture, defense, and environmental monitoring industries. Advancements in launch vehicle technology and the emergence of satellite mega-constellations contribute to the proliferation of LEO satellites.
Leading Producers and Suppliers of Optical Satellites

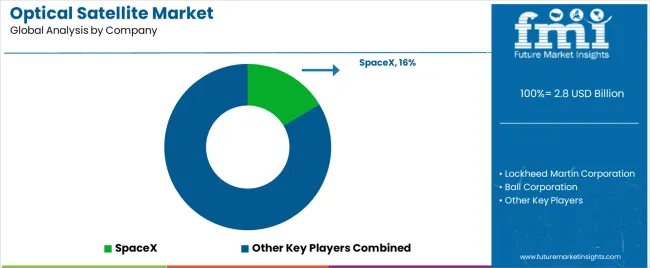
Optical Satellite Market Analysis By Company

The competitive landscape of the optical satellite market is characterized by several key players competing for market share and dominance. Established companies and emerging entrants engage in strategic initiatives to gain a competitive edge in this rapidly evolving industry.

Leading players in the market focus on technological innovation to enhance satellite capabilities, such as improving image resolution, increasing data processing speed, and expanding satellite coverage. Additionally, these companies invest in research and development to develop advanced satellite systems and solutions that cater to the diverse needs of customers across industries.

Partnerships and collaborations with government agencies, research institutions, and commercial organizations are common strategies market players use to expand their market reach and gain access to new technologies and resources. Moreover, mergers and acquisitions are prevalent as companies seek to strengthen their market position and enhance their product portfolios.

Key Market Developments

  • In January 2024, NASA initiated the Laser Communications Relay Demonstration (LCRD), showcasing advanced optical communication capabilities. LCRD is pivotal in NASA's pioneering two-way laser relay communications system. This technology promises enhanced data transmission rates and efficiency for space missions.
  • In June 2025, BlueHalo secured a contract to supply optical laser communications terminals to the Air Force Research Laboratory at Kirtland Air Force Base. These terminals are intended for demonstrating on-orbit processing of satellite positioning and timing data.

Scope and Coverage of the Optical Satellite Market Report

Attributes Details
Estimated Market Size in 2025 USD 2.4 billion
Projected Market Valuation in 2035 USD 10.4 billion
CAGR Share from 2025 to 2035 15.8%
Forecast Period 2025 to 2035
Historical Data Available for 2020 to 2025
Market Analysis Value in USD billion
Key Regions Covered North America; Latin America; Western Europe; Eastern Europe; South Asia and Pacific; East Asia; The Middle East and Africa
Key Market Segments Covered Size, Operational Orbit, Application, Component, End User, Region
Key Countries Profiled The United States, Canada, Brazil, Mexico, Germany, The United Kingdom, France, Spain, Italy, Poland, Russia, Czech Republic, Romania, India, Bangladesh, Australia, New Zealand, China, Japan, South Korea, GCC Countries, South Africa, Israel
Key Companies Profiled SpaceX; Lockheed Martin Corporation; Ball Corporation; Airbus Defence and Space; L3Harris Technologies Corporation; EchoStar Satellite Services; Hughes Network Systems; Eutelsat; Arqiva; Telesat

Top Segments Studied in the Optical Satellite Market

By Size:

  • Small
  • Medium
  • Large

By Operational Orbit:

  • LEO
  • MEO/GEO

By Application:

  • Earth Observation
  • Communication

By Component:

  • Imaging & Sensing Systems
    • Visible spectrum & panchromatic
    • Ultraviolet and infrared
    • LASER based
  • Optical Communication Systems
    • Satellite-to-satellite communication
    • Satellite-to-ground communication

By End User:

  • Commercial
  • Government
  • Defence

By Region:

  • North America
  • Latin America
  • Western Europe
  • Eastern Europe
  • South Asia and Pacific
  • East Asia
  • Middle East and Africa

Frequently Asked Questions

How big is the optical satellite market in 2025?

The global optical satellite market is estimated to be valued at USD 2.8 billion in 2025.

What will be the size of optical satellite market in 2035?

The market size for the optical satellite market is projected to reach USD 11.3 billion by 2035.

How much will be the optical satellite market growth between 2025 and 2035?

The optical satellite market is expected to grow at a 15.0% CAGR between 2025 and 2035.

What are the key product types in the optical satellite market?

The key product types in optical satellite market are small, medium and large.

Which operational orbit segment to contribute significant share in the optical satellite market in 2025?

In terms of operational orbit, leo segment to command 68.5% share in the optical satellite market in 2025.

Table of Content

  1. Executive Summary
    • Global Market Outlook
    • Demand-side Trends
    • Supply-side Trends
    • Technology Roadmap Analysis
    • Analysis and Recommendations
  2. Market Overview
    • Market Coverage / Taxonomy
    • Market Definition / Scope / Limitations
  3. Market Background
    • Market Dynamics
      • Drivers
      • Restraints
      • Opportunity
      • Trends
    • Scenario Forecast
      • Demand in Optimistic Scenario
      • Demand in Likely Scenario
      • Demand in Conservative Scenario
    • Opportunity Map Analysis
    • Product Life Cycle Analysis
    • Supply Chain Analysis
    • Investment Feasibility Matrix
    • Value Chain Analysis
    • PESTLE and Porter’s Analysis
    • Regulatory Landscape
    • Regional Parent Market Outlook
    • Production and Consumption Statistics
    • Import and Export Statistics
  4. Global Market Analysis 2020-2024 and Forecast, 2025-2035
    • Historical Market Size Value (USD Million) Analysis, 2020-2024
    • Current and Future Market Size Value (USD Million) Projections, 2025-2035
      • Y-o-Y Growth Trend Analysis
      • Absolute $ Opportunity Analysis
  5. Global Market Pricing Analysis 2020-2024 and Forecast 2025-2035
  6. Global Market Analysis 2020-2024 and Forecast 2025-2035, By Size
    • Introduction / Key Findings
    • Historical Market Size Value (USD Million) Analysis By Size , 2020-2024
    • Current and Future Market Size Value (USD Million) Analysis and Forecast By Size , 2025-2035
      • Small
      • Medium
      • Large
    • Y-o-Y Growth Trend Analysis By Size , 2020-2024
    • Absolute $ Opportunity Analysis By Size , 2025-2035
  7. Global Market Analysis 2020-2024 and Forecast 2025-2035, By Operational Orbit
    • Introduction / Key Findings
    • Historical Market Size Value (USD Million) Analysis By Operational Orbit, 2020-2024
    • Current and Future Market Size Value (USD Million) Analysis and Forecast By Operational Orbit, 2025-2035
      • LEO
      • MEO/GEO
    • Y-o-Y Growth Trend Analysis By Operational Orbit, 2020-2024
    • Absolute $ Opportunity Analysis By Operational Orbit, 2025-2035
  8. Global Market Analysis 2020-2024 and Forecast 2025-2035, By Application
    • Introduction / Key Findings
    • Historical Market Size Value (USD Million) Analysis By Application, 2020-2024
    • Current and Future Market Size Value (USD Million) Analysis and Forecast By Application, 2025-2035
      • Earth Observation
      • Communication
    • Y-o-Y Growth Trend Analysis By Application, 2020-2024
    • Absolute $ Opportunity Analysis By Application, 2025-2035
  9. Global Market Analysis 2020-2024 and Forecast 2025-2035, By Component
    • Introduction / Key Findings
    • Historical Market Size Value (USD Million) Analysis By Component, 2020-2024
    • Current and Future Market Size Value (USD Million) Analysis and Forecast By Component, 2025-2035
      • Imaging & Sensing Systems
        • Visible Spectrum & Panchromatic
        • Ultraviolet And Infrared
        • LASER Based
      • Optical Communication Systems
        • Satellite-To-Satellite Communication
        • Satellite-To-Ground Communication
    • Y-o-Y Growth Trend Analysis By Component, 2020-2024
    • Absolute $ Opportunity Analysis By Component, 2025-2035
  10. Global Market Analysis 2020-2024 and Forecast 2025-2035, By End User
    • Introduction / Key Findings
    • Historical Market Size Value (USD Million) Analysis By End User, 2020-2024
    • Current and Future Market Size Value (USD Million) Analysis and Forecast By End User, 2025-2035
      • Commercial
      • Government
      • Defence
    • Y-o-Y Growth Trend Analysis By End User, 2020-2024
    • Absolute $ Opportunity Analysis By End User, 2025-2035
  11. Global Market Analysis 2020-2024 and Forecast 2025-2035, By Region
    • Introduction
    • Historical Market Size Value (USD Million) Analysis By Region, 2020-2024
    • Current Market Size Value (USD Million) Analysis and Forecast By Region, 2025-2035
      • North America
      • Latin America
      • Western Europe
      • Eastern Europe
      • East Asia
      • South Asia and Pacific
      • Middle East & Africa
    • Market Attractiveness Analysis By Region
  12. North America Market Analysis 2020-2024 and Forecast 2025-2035, By Country
    • Historical Market Size Value (USD Million) Trend Analysis By Market Taxonomy, 2020-2024
    • Market Size Value (USD Million) Forecast By Market Taxonomy, 2025-2035
      • By Country
        • USA
        • Canada
        • Mexico
      • By Size
      • By Operational Orbit
      • By Application
      • By Component
      • By End User
    • Market Attractiveness Analysis
      • By Country
      • By Size
      • By Operational Orbit
      • By Application
      • By Component
      • By End User
    • Key Takeaways
  13. Latin America Market Analysis 2020-2024 and Forecast 2025-2035, By Country
    • Historical Market Size Value (USD Million) Trend Analysis By Market Taxonomy, 2020-2024
    • Market Size Value (USD Million) Forecast By Market Taxonomy, 2025-2035
      • By Country
        • Brazil
        • Chile
        • Rest of Latin America
      • By Size
      • By Operational Orbit
      • By Application
      • By Component
      • By End User
    • Market Attractiveness Analysis
      • By Country
      • By Size
      • By Operational Orbit
      • By Application
      • By Component
      • By End User
    • Key Takeaways
  14. Western Europe Market Analysis 2020-2024 and Forecast 2025-2035, By Country
    • Historical Market Size Value (USD Million) Trend Analysis By Market Taxonomy, 2020-2024
    • Market Size Value (USD Million) Forecast By Market Taxonomy, 2025-2035
      • By Country
        • Germany
        • UK
        • Italy
        • Spain
        • France
        • Nordic
        • BENELUX
        • Rest of Western Europe
      • By Size
      • By Operational Orbit
      • By Application
      • By Component
      • By End User
    • Market Attractiveness Analysis
      • By Country
      • By Size
      • By Operational Orbit
      • By Application
      • By Component
      • By End User
    • Key Takeaways
  15. Eastern Europe Market Analysis 2020-2024 and Forecast 2025-2035, By Country
    • Historical Market Size Value (USD Million) Trend Analysis By Market Taxonomy, 2020-2024
    • Market Size Value (USD Million) Forecast By Market Taxonomy, 2025-2035
      • By Country
        • Russia
        • Poland
        • Hungary
        • Balkan & Baltic
        • Rest of Eastern Europe
      • By Size
      • By Operational Orbit
      • By Application
      • By Component
      • By End User
    • Market Attractiveness Analysis
      • By Country
      • By Size
      • By Operational Orbit
      • By Application
      • By Component
      • By End User
    • Key Takeaways
  16. East Asia Market Analysis 2020-2024 and Forecast 2025-2035, By Country
    • Historical Market Size Value (USD Million) Trend Analysis By Market Taxonomy, 2020-2024
    • Market Size Value (USD Million) Forecast By Market Taxonomy, 2025-2035
      • By Country
        • China
        • Japan
        • South Korea
      • By Size
      • By Operational Orbit
      • By Application
      • By Component
      • By End User
    • Market Attractiveness Analysis
      • By Country
      • By Size
      • By Operational Orbit
      • By Application
      • By Component
      • By End User
    • Key Takeaways
  17. South Asia and Pacific Market Analysis 2020-2024 and Forecast 2025-2035, By Country
    • Historical Market Size Value (USD Million) Trend Analysis By Market Taxonomy, 2020-2024
    • Market Size Value (USD Million) Forecast By Market Taxonomy, 2025-2035
      • By Country
        • India
        • ASEAN
        • Australia & New Zealand
        • Rest of South Asia and Pacific
      • By Size
      • By Operational Orbit
      • By Application
      • By Component
      • By End User
    • Market Attractiveness Analysis
      • By Country
      • By Size
      • By Operational Orbit
      • By Application
      • By Component
      • By End User
    • Key Takeaways
  18. Middle East & Africa Market Analysis 2020-2024 and Forecast 2025-2035, By Country
    • Historical Market Size Value (USD Million) Trend Analysis By Market Taxonomy, 2020-2024
    • Market Size Value (USD Million) Forecast By Market Taxonomy, 2025-2035
      • By Country
        • Kingdom of Saudi Arabia
        • Other GCC Countries
        • Turkiye
        • South Africa
        • Other African Union
        • Rest of Middle East & Africa
      • By Size
      • By Operational Orbit
      • By Application
      • By Component
      • By End User
    • Market Attractiveness Analysis
      • By Country
      • By Size
      • By Operational Orbit
      • By Application
      • By Component
      • By End User
    • Key Takeaways
  19. Key Countries Market Analysis
    • USA
      • Pricing Analysis
      • Market Share Analysis, 2024
        • By Size
        • By Operational Orbit
        • By Application
        • By Component
        • By End User
    • Canada
      • Pricing Analysis
      • Market Share Analysis, 2024
        • By Size
        • By Operational Orbit
        • By Application
        • By Component
        • By End User
    • Mexico
      • Pricing Analysis
      • Market Share Analysis, 2024
        • By Size
        • By Operational Orbit
        • By Application
        • By Component
        • By End User
    • Brazil
      • Pricing Analysis
      • Market Share Analysis, 2024
        • By Size
        • By Operational Orbit
        • By Application
        • By Component
        • By End User
    • Chile
      • Pricing Analysis
      • Market Share Analysis, 2024
        • By Size
        • By Operational Orbit
        • By Application
        • By Component
        • By End User
    • Germany
      • Pricing Analysis
      • Market Share Analysis, 2024
        • By Size
        • By Operational Orbit
        • By Application
        • By Component
        • By End User
    • UK
      • Pricing Analysis
      • Market Share Analysis, 2024
        • By Size
        • By Operational Orbit
        • By Application
        • By Component
        • By End User
    • Italy
      • Pricing Analysis
      • Market Share Analysis, 2024
        • By Size
        • By Operational Orbit
        • By Application
        • By Component
        • By End User
    • Spain
      • Pricing Analysis
      • Market Share Analysis, 2024
        • By Size
        • By Operational Orbit
        • By Application
        • By Component
        • By End User
    • France
      • Pricing Analysis
      • Market Share Analysis, 2024
        • By Size
        • By Operational Orbit
        • By Application
        • By Component
        • By End User
    • India
      • Pricing Analysis
      • Market Share Analysis, 2024
        • By Size
        • By Operational Orbit
        • By Application
        • By Component
        • By End User
    • ASEAN
      • Pricing Analysis
      • Market Share Analysis, 2024
        • By Size
        • By Operational Orbit
        • By Application
        • By Component
        • By End User
    • Australia & New Zealand
      • Pricing Analysis
      • Market Share Analysis, 2024
        • By Size
        • By Operational Orbit
        • By Application
        • By Component
        • By End User
    • China
      • Pricing Analysis
      • Market Share Analysis, 2024
        • By Size
        • By Operational Orbit
        • By Application
        • By Component
        • By End User
    • Japan
      • Pricing Analysis
      • Market Share Analysis, 2024
        • By Size
        • By Operational Orbit
        • By Application
        • By Component
        • By End User
    • South Korea
      • Pricing Analysis
      • Market Share Analysis, 2024
        • By Size
        • By Operational Orbit
        • By Application
        • By Component
        • By End User
    • Russia
      • Pricing Analysis
      • Market Share Analysis, 2024
        • By Size
        • By Operational Orbit
        • By Application
        • By Component
        • By End User
    • Poland
      • Pricing Analysis
      • Market Share Analysis, 2024
        • By Size
        • By Operational Orbit
        • By Application
        • By Component
        • By End User
    • Hungary
      • Pricing Analysis
      • Market Share Analysis, 2024
        • By Size
        • By Operational Orbit
        • By Application
        • By Component
        • By End User
    • Kingdom of Saudi Arabia
      • Pricing Analysis
      • Market Share Analysis, 2024
        • By Size
        • By Operational Orbit
        • By Application
        • By Component
        • By End User
    • Turkiye
      • Pricing Analysis
      • Market Share Analysis, 2024
        • By Size
        • By Operational Orbit
        • By Application
        • By Component
        • By End User
    • South Africa
      • Pricing Analysis
      • Market Share Analysis, 2024
        • By Size
        • By Operational Orbit
        • By Application
        • By Component
        • By End User
  20. Market Structure Analysis
    • Competition Dashboard
    • Competition Benchmarking
    • Market Share Analysis of Top Players
      • By Regional
      • By Size
      • By Operational Orbit
      • By Application
      • By Component
      • By End User
  21. Competition Analysis
    • Competition Deep Dive
      • SpaceX
        • Overview
        • Product Portfolio
        • Profitability by Market Segments (Product/Age /Sales Channel/Region)
        • Sales Footprint
        • Strategy Overview
          • Marketing Strategy
          • Product Strategy
          • Channel Strategy
      • Lockheed Martin Corporation
      • Ball Corporation
      • Airbus Defence And Space
      • L3Harris Technologies Corporation
      • EchoStar Satellite Services
      • Hughes Network Systems
      • Eutelsat
      • Arqiva
      • Telesat
  22. Assumptions & Acronyms Used
  23. Research Methodology

List of Tables

  • Table 1: Global Market Value (USD Million) Forecast by Region, 2020-2035
  • Table 2: Global Market Value (USD Million) Forecast by Size , 2020-2035
  • Table 3: Global Market Value (USD Million) Forecast by Operational Orbit, 2020-2035
  • Table 4: Global Market Value (USD Million) Forecast by Application, 2020-2035
  • Table 5: Global Market Value (USD Million) Forecast by Component, 2020-2035
  • Table 6: Global Market Value (USD Million) Forecast by End User, 2020-2035
  • Table 7: North America Market Value (USD Million) Forecast by Country, 2020-2035
  • Table 8: North America Market Value (USD Million) Forecast by Size , 2020-2035
  • Table 9: North America Market Value (USD Million) Forecast by Operational Orbit, 2020-2035
  • Table 10: North America Market Value (USD Million) Forecast by Application, 2020-2035
  • Table 11: North America Market Value (USD Million) Forecast by Component, 2020-2035
  • Table 12: North America Market Value (USD Million) Forecast by End User, 2020-2035
  • Table 13: Latin America Market Value (USD Million) Forecast by Country, 2020-2035
  • Table 14: Latin America Market Value (USD Million) Forecast by Size , 2020-2035
  • Table 15: Latin America Market Value (USD Million) Forecast by Operational Orbit, 2020-2035
  • Table 16: Latin America Market Value (USD Million) Forecast by Application, 2020-2035
  • Table 17: Latin America Market Value (USD Million) Forecast by Component, 2020-2035
  • Table 18: Latin America Market Value (USD Million) Forecast by End User, 2020-2035
  • Table 19: Western Europe Market Value (USD Million) Forecast by Country, 2020-2035
  • Table 20: Western Europe Market Value (USD Million) Forecast by Size , 2020-2035
  • Table 21: Western Europe Market Value (USD Million) Forecast by Operational Orbit, 2020-2035
  • Table 22: Western Europe Market Value (USD Million) Forecast by Application, 2020-2035
  • Table 23: Western Europe Market Value (USD Million) Forecast by Component, 2020-2035
  • Table 24: Western Europe Market Value (USD Million) Forecast by End User, 2020-2035
  • Table 25: Eastern Europe Market Value (USD Million) Forecast by Country, 2020-2035
  • Table 26: Eastern Europe Market Value (USD Million) Forecast by Size , 2020-2035
  • Table 27: Eastern Europe Market Value (USD Million) Forecast by Operational Orbit, 2020-2035
  • Table 28: Eastern Europe Market Value (USD Million) Forecast by Application, 2020-2035
  • Table 29: Eastern Europe Market Value (USD Million) Forecast by Component, 2020-2035
  • Table 30: Eastern Europe Market Value (USD Million) Forecast by End User, 2020-2035
  • Table 31: East Asia Market Value (USD Million) Forecast by Country, 2020-2035
  • Table 32: East Asia Market Value (USD Million) Forecast by Size , 2020-2035
  • Table 33: East Asia Market Value (USD Million) Forecast by Operational Orbit, 2020-2035
  • Table 34: East Asia Market Value (USD Million) Forecast by Application, 2020-2035
  • Table 35: East Asia Market Value (USD Million) Forecast by Component, 2020-2035
  • Table 36: East Asia Market Value (USD Million) Forecast by End User, 2020-2035
  • Table 37: South Asia and Pacific Market Value (USD Million) Forecast by Country, 2020-2035
  • Table 38: South Asia and Pacific Market Value (USD Million) Forecast by Size , 2020-2035
  • Table 39: South Asia and Pacific Market Value (USD Million) Forecast by Operational Orbit, 2020-2035
  • Table 40: South Asia and Pacific Market Value (USD Million) Forecast by Application, 2020-2035
  • Table 41: South Asia and Pacific Market Value (USD Million) Forecast by Component, 2020-2035
  • Table 42: South Asia and Pacific Market Value (USD Million) Forecast by End User, 2020-2035
  • Table 43: Middle East & Africa Market Value (USD Million) Forecast by Country, 2020-2035
  • Table 44: Middle East & Africa Market Value (USD Million) Forecast by Size , 2020-2035
  • Table 45: Middle East & Africa Market Value (USD Million) Forecast by Operational Orbit, 2020-2035
  • Table 46: Middle East & Africa Market Value (USD Million) Forecast by Application, 2020-2035
  • Table 47: Middle East & Africa Market Value (USD Million) Forecast by Component, 2020-2035
  • Table 48: Middle East & Africa Market Value (USD Million) Forecast by End User, 2020-2035

List of Figures

  • Figure 1: Global Market Pricing Analysis
  • Figure 2: Global Market Value (USD Million) Forecast 2020-2035
  • Figure 3: Global Market Value Share and BPS Analysis by Size , 2025 and 2035
  • Figure 4: Global Market Y-o-Y Growth Comparison by Size , 2025-2035
  • Figure 5: Global Market Attractiveness Analysis by Size
  • Figure 6: Global Market Value Share and BPS Analysis by Operational Orbit, 2025 and 2035
  • Figure 7: Global Market Y-o-Y Growth Comparison by Operational Orbit, 2025-2035
  • Figure 8: Global Market Attractiveness Analysis by Operational Orbit
  • Figure 9: Global Market Value Share and BPS Analysis by Application, 2025 and 2035
  • Figure 10: Global Market Y-o-Y Growth Comparison by Application, 2025-2035
  • Figure 11: Global Market Attractiveness Analysis by Application
  • Figure 12: Global Market Value Share and BPS Analysis by Component, 2025 and 2035
  • Figure 13: Global Market Y-o-Y Growth Comparison by Component, 2025-2035
  • Figure 14: Global Market Attractiveness Analysis by Component
  • Figure 15: Global Market Value Share and BPS Analysis by End User, 2025 and 2035
  • Figure 16: Global Market Y-o-Y Growth Comparison by End User, 2025-2035
  • Figure 17: Global Market Attractiveness Analysis by End User
  • Figure 18: Global Market Value (USD Million) Share and BPS Analysis by Region, 2025 and 2035
  • Figure 19: Global Market Y-o-Y Growth Comparison by Region, 2025-2035
  • Figure 20: Global Market Attractiveness Analysis by Region
  • Figure 21: North America Market Incremental Dollar Opportunity, 2025-2035
  • Figure 22: Latin America Market Incremental Dollar Opportunity, 2025-2035
  • Figure 23: Western Europe Market Incremental Dollar Opportunity, 2025-2035
  • Figure 24: Eastern Europe Market Incremental Dollar Opportunity, 2025-2035
  • Figure 25: East Asia Market Incremental Dollar Opportunity, 2025-2035
  • Figure 26: South Asia and Pacific Market Incremental Dollar Opportunity, 2025-2035
  • Figure 27: Middle East & Africa Market Incremental Dollar Opportunity, 2025-2035
  • Figure 28: North America Market Value Share and BPS Analysis by Country, 2025 and 2035
  • Figure 29: North America Market Value Share and BPS Analysis by Size , 2025 and 2035
  • Figure 30: North America Market Y-o-Y Growth Comparison by Size , 2025-2035
  • Figure 31: North America Market Attractiveness Analysis by Size
  • Figure 32: North America Market Value Share and BPS Analysis by Operational Orbit, 2025 and 2035
  • Figure 33: North America Market Y-o-Y Growth Comparison by Operational Orbit, 2025-2035
  • Figure 34: North America Market Attractiveness Analysis by Operational Orbit
  • Figure 35: North America Market Value Share and BPS Analysis by Application, 2025 and 2035
  • Figure 36: North America Market Y-o-Y Growth Comparison by Application, 2025-2035
  • Figure 37: North America Market Attractiveness Analysis by Application
  • Figure 38: North America Market Value Share and BPS Analysis by Component, 2025 and 2035
  • Figure 39: North America Market Y-o-Y Growth Comparison by Component, 2025-2035
  • Figure 40: North America Market Attractiveness Analysis by Component
  • Figure 41: North America Market Value Share and BPS Analysis by End User, 2025 and 2035
  • Figure 42: North America Market Y-o-Y Growth Comparison by End User, 2025-2035
  • Figure 43: North America Market Attractiveness Analysis by End User
  • Figure 44: Latin America Market Value Share and BPS Analysis by Country, 2025 and 2035
  • Figure 45: Latin America Market Value Share and BPS Analysis by Size , 2025 and 2035
  • Figure 46: Latin America Market Y-o-Y Growth Comparison by Size , 2025-2035
  • Figure 47: Latin America Market Attractiveness Analysis by Size
  • Figure 48: Latin America Market Value Share and BPS Analysis by Operational Orbit, 2025 and 2035
  • Figure 49: Latin America Market Y-o-Y Growth Comparison by Operational Orbit, 2025-2035
  • Figure 50: Latin America Market Attractiveness Analysis by Operational Orbit
  • Figure 51: Latin America Market Value Share and BPS Analysis by Application, 2025 and 2035
  • Figure 52: Latin America Market Y-o-Y Growth Comparison by Application, 2025-2035
  • Figure 53: Latin America Market Attractiveness Analysis by Application
  • Figure 54: Latin America Market Value Share and BPS Analysis by Component, 2025 and 2035
  • Figure 55: Latin America Market Y-o-Y Growth Comparison by Component, 2025-2035
  • Figure 56: Latin America Market Attractiveness Analysis by Component
  • Figure 57: Latin America Market Value Share and BPS Analysis by End User, 2025 and 2035
  • Figure 58: Latin America Market Y-o-Y Growth Comparison by End User, 2025-2035
  • Figure 59: Latin America Market Attractiveness Analysis by End User
  • Figure 60: Western Europe Market Value Share and BPS Analysis by Country, 2025 and 2035
  • Figure 61: Western Europe Market Value Share and BPS Analysis by Size , 2025 and 2035
  • Figure 62: Western Europe Market Y-o-Y Growth Comparison by Size , 2025-2035
  • Figure 63: Western Europe Market Attractiveness Analysis by Size
  • Figure 64: Western Europe Market Value Share and BPS Analysis by Operational Orbit, 2025 and 2035
  • Figure 65: Western Europe Market Y-o-Y Growth Comparison by Operational Orbit, 2025-2035
  • Figure 66: Western Europe Market Attractiveness Analysis by Operational Orbit
  • Figure 67: Western Europe Market Value Share and BPS Analysis by Application, 2025 and 2035
  • Figure 68: Western Europe Market Y-o-Y Growth Comparison by Application, 2025-2035
  • Figure 69: Western Europe Market Attractiveness Analysis by Application
  • Figure 70: Western Europe Market Value Share and BPS Analysis by Component, 2025 and 2035
  • Figure 71: Western Europe Market Y-o-Y Growth Comparison by Component, 2025-2035
  • Figure 72: Western Europe Market Attractiveness Analysis by Component
  • Figure 73: Western Europe Market Value Share and BPS Analysis by End User, 2025 and 2035
  • Figure 74: Western Europe Market Y-o-Y Growth Comparison by End User, 2025-2035
  • Figure 75: Western Europe Market Attractiveness Analysis by End User
  • Figure 76: Eastern Europe Market Value Share and BPS Analysis by Country, 2025 and 2035
  • Figure 77: Eastern Europe Market Value Share and BPS Analysis by Size , 2025 and 2035
  • Figure 78: Eastern Europe Market Y-o-Y Growth Comparison by Size , 2025-2035
  • Figure 79: Eastern Europe Market Attractiveness Analysis by Size
  • Figure 80: Eastern Europe Market Value Share and BPS Analysis by Operational Orbit, 2025 and 2035
  • Figure 81: Eastern Europe Market Y-o-Y Growth Comparison by Operational Orbit, 2025-2035
  • Figure 82: Eastern Europe Market Attractiveness Analysis by Operational Orbit
  • Figure 83: Eastern Europe Market Value Share and BPS Analysis by Application, 2025 and 2035
  • Figure 84: Eastern Europe Market Y-o-Y Growth Comparison by Application, 2025-2035
  • Figure 85: Eastern Europe Market Attractiveness Analysis by Application
  • Figure 86: Eastern Europe Market Value Share and BPS Analysis by Component, 2025 and 2035
  • Figure 87: Eastern Europe Market Y-o-Y Growth Comparison by Component, 2025-2035
  • Figure 88: Eastern Europe Market Attractiveness Analysis by Component
  • Figure 89: Eastern Europe Market Value Share and BPS Analysis by End User, 2025 and 2035
  • Figure 90: Eastern Europe Market Y-o-Y Growth Comparison by End User, 2025-2035
  • Figure 91: Eastern Europe Market Attractiveness Analysis by End User
  • Figure 92: East Asia Market Value Share and BPS Analysis by Country, 2025 and 2035
  • Figure 93: East Asia Market Value Share and BPS Analysis by Size , 2025 and 2035
  • Figure 94: East Asia Market Y-o-Y Growth Comparison by Size , 2025-2035
  • Figure 95: East Asia Market Attractiveness Analysis by Size
  • Figure 96: East Asia Market Value Share and BPS Analysis by Operational Orbit, 2025 and 2035
  • Figure 97: East Asia Market Y-o-Y Growth Comparison by Operational Orbit, 2025-2035
  • Figure 98: East Asia Market Attractiveness Analysis by Operational Orbit
  • Figure 99: East Asia Market Value Share and BPS Analysis by Application, 2025 and 2035
  • Figure 100: East Asia Market Y-o-Y Growth Comparison by Application, 2025-2035
  • Figure 101: East Asia Market Attractiveness Analysis by Application
  • Figure 102: East Asia Market Value Share and BPS Analysis by Component, 2025 and 2035
  • Figure 103: East Asia Market Y-o-Y Growth Comparison by Component, 2025-2035
  • Figure 104: East Asia Market Attractiveness Analysis by Component
  • Figure 105: East Asia Market Value Share and BPS Analysis by End User, 2025 and 2035
  • Figure 106: East Asia Market Y-o-Y Growth Comparison by End User, 2025-2035
  • Figure 107: East Asia Market Attractiveness Analysis by End User
  • Figure 108: South Asia and Pacific Market Value Share and BPS Analysis by Country, 2025 and 2035
  • Figure 109: South Asia and Pacific Market Value Share and BPS Analysis by Size , 2025 and 2035
  • Figure 110: South Asia and Pacific Market Y-o-Y Growth Comparison by Size , 2025-2035
  • Figure 111: South Asia and Pacific Market Attractiveness Analysis by Size
  • Figure 112: South Asia and Pacific Market Value Share and BPS Analysis by Operational Orbit, 2025 and 2035
  • Figure 113: South Asia and Pacific Market Y-o-Y Growth Comparison by Operational Orbit, 2025-2035
  • Figure 114: South Asia and Pacific Market Attractiveness Analysis by Operational Orbit
  • Figure 115: South Asia and Pacific Market Value Share and BPS Analysis by Application, 2025 and 2035
  • Figure 116: South Asia and Pacific Market Y-o-Y Growth Comparison by Application, 2025-2035
  • Figure 117: South Asia and Pacific Market Attractiveness Analysis by Application
  • Figure 118: South Asia and Pacific Market Value Share and BPS Analysis by Component, 2025 and 2035
  • Figure 119: South Asia and Pacific Market Y-o-Y Growth Comparison by Component, 2025-2035
  • Figure 120: South Asia and Pacific Market Attractiveness Analysis by Component
  • Figure 121: South Asia and Pacific Market Value Share and BPS Analysis by End User, 2025 and 2035
  • Figure 122: South Asia and Pacific Market Y-o-Y Growth Comparison by End User, 2025-2035
  • Figure 123: South Asia and Pacific Market Attractiveness Analysis by End User
  • Figure 124: Middle East & Africa Market Value Share and BPS Analysis by Country, 2025 and 2035
  • Figure 125: Middle East & Africa Market Value Share and BPS Analysis by Size , 2025 and 2035
  • Figure 126: Middle East & Africa Market Y-o-Y Growth Comparison by Size , 2025-2035
  • Figure 127: Middle East & Africa Market Attractiveness Analysis by Size
  • Figure 128: Middle East & Africa Market Value Share and BPS Analysis by Operational Orbit, 2025 and 2035
  • Figure 129: Middle East & Africa Market Y-o-Y Growth Comparison by Operational Orbit, 2025-2035
  • Figure 130: Middle East & Africa Market Attractiveness Analysis by Operational Orbit
  • Figure 131: Middle East & Africa Market Value Share and BPS Analysis by Application, 2025 and 2035
  • Figure 132: Middle East & Africa Market Y-o-Y Growth Comparison by Application, 2025-2035
  • Figure 133: Middle East & Africa Market Attractiveness Analysis by Application
  • Figure 134: Middle East & Africa Market Value Share and BPS Analysis by Component, 2025 and 2035
  • Figure 135: Middle East & Africa Market Y-o-Y Growth Comparison by Component, 2025-2035
  • Figure 136: Middle East & Africa Market Attractiveness Analysis by Component
  • Figure 137: Middle East & Africa Market Value Share and BPS Analysis by End User, 2025 and 2035
  • Figure 138: Middle East & Africa Market Y-o-Y Growth Comparison by End User, 2025-2035
  • Figure 139: Middle East & Africa Market Attractiveness Analysis by End User
  • Figure 140: Global Market - Tier Structure Analysis
  • Figure 141: Global Market - Company Share Analysis
Dashboard
Dashboard
Dashboard
Dashboard
Dashboard
Dashboard

Full Research Suite comprises of:

Market outlook & trends analysis

Market outlook & trends analysis

Interviews & case studies

Interviews & case studies

Strategic recommendations

Strategic recommendations

Vendor profiles & capabilities analysis

Vendor profiles & capabilities analysis

5-year forecasts

5-year forecasts

8 regions and 60+ country-level data splits

8 regions and 60+ country-level data splits

Market segment data splits

Market segment data splits

12 months of continuous data updates

12 months of continuous data updates

DELIVERED AS:

PDF EXCEL ONLINE

Full Research Suite


$5000

$7500

$10000

Buy Report Now
Similar Industry Reports

Similar Industry Reports

Optical Extinction Analyzer Market

Optical Extinction Analyzer Market Size and Share Forecast Outlook 2025 to 2035

Optical Character Recognition Market

Optical Character Recognition Market Forecast and Outlook 2025 to 2035

Optical Imaging Market

Optical Imaging Market Size and Share Forecast Outlook 2025 to 2035

Optical Whitening Agents Market

Optical Whitening Agents Market Size and Share Forecast Outlook 2025 to 2035

Optical Fingerprint Collector Market

Optical Fingerprint Collector Market Size and Share Forecast Outlook 2025 to 2035

Optical Lens Materials Market

Optical Lens Materials Market Size and Share Forecast Outlook 2025 to 2035

Optical Microscope Market

Optical Microscope Market Size and Share Forecast Outlook 2025 to 2035

Optical Component Tester Market

Optical Component Tester Market Size and Share Forecast Outlook 2025 to 2035

Optical EMI Shielding Adapters Market

Optical EMI Shielding Adapters Market Size and Share Forecast Outlook 2025 to 2035

Optical Connector Polishing Films Market

Optical Connector Polishing Films Market Size and Share Forecast Outlook 2025 to 2035

Optical Transmitter Market

Optical Transmitter Market Size and Share Forecast Outlook 2025 to 2035

Optical Telephoto Lens Market

Optical Telephoto Lens Market Size and Share Forecast Outlook 2025 to 2035

Optical Lattice Clock Market

Optical Lattice Clock Market Size and Share Forecast Outlook 2025 to 2035

Optical Grade Lithium Tantalate Wafers Market

Optical Grade Lithium Tantalate Wafers Market Size and Share Forecast Outlook 2025 to 2035

Optical Grade LiTaO3 Crystal Substrate Market

Optical Grade LiTaO3 Crystal Substrate Market Size and Share Forecast Outlook 2025 to 2035

Optical Brighteners Market

Optical Brighteners Market Size and Share Forecast Outlook 2025 to 2035

Optical Liquid Level Sensor Market

Optical Liquid Level Sensor Market Size and Share Forecast Outlook 2025 to 2035

Optical Fiber Market

Optical Fiber Market Size and Share Forecast Outlook 2025 to 2035

Optical Communication and Networking Market

Optical Communication and Networking Market Size and Share Forecast Outlook 2025 to 2035

Optical Fiber Connectivity Market

Optical Fiber Connectivity Market Size and Share Forecast Outlook 2025 to 2035

Future Market Insights

Optical Satellite Market

Chat With MaRIA

Chat With

MaRIA

Hi There, I am MaRIA, Your Market Research Intelligence Assistant. How may I help you?