The optical transport network equipment market is estimated to be valued at USD 22.8 million in 2025 and is projected to reach USD 54.9 million by 2035, registering a compound annual growth rate (CAGR) of 9.2% over the forecast period.
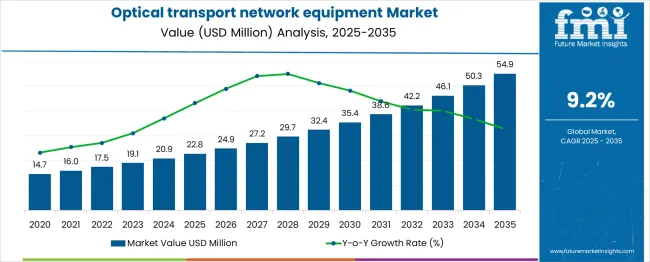
The optical transport network (OTN) equipment market is experiencing significant momentum due to the rapid escalation of data traffic, cloud migration, and 5G infrastructure rollout. With telecom operators and enterprises demanding high-capacity, low-latency solutions to support bandwidth-heavy applications, the market has seen increased capital expenditure toward wavelength division multiplexing and coherent transmission systems.
Governments and private network operators are expanding backbone and metro networks to manage surging demand from video streaming, remote work, and connected devices. Technological convergence between optical transport and packet-based solutions is enhancing network efficiency and scalability.
Future growth is expected to be reinforced by hyperscale data center expansion, AI workload transmission requirements, and cross-border fiber connectivity initiatives that prioritize long-haul and ultra-low latency routes. The adoption of software-defined networking (SDN) in optical layers is also contributing to network automation and dynamic provisioning, driving long-term transformation in network design and deployment.
The market is segmented by Technology, Component, and End-user Application and region. By Technology, the market is divided into DWDM and WDM. In terms of Component, the market is classified into Optical Transport, Optical Packet Platform, and Optical Switch.
Based on End-user Application, the market is segmented into Communication Service Providers, Communication Network Operators, Enterprises and Organization, and Government and Institution. Regionally, the market is classified into North America, Latin America, Western Europe, Eastern Europe, Balkan & Baltic Countries, Russia & Belarus, Central Asia, East Asia, South Asia & Pacific, and the Middle East & Africa.
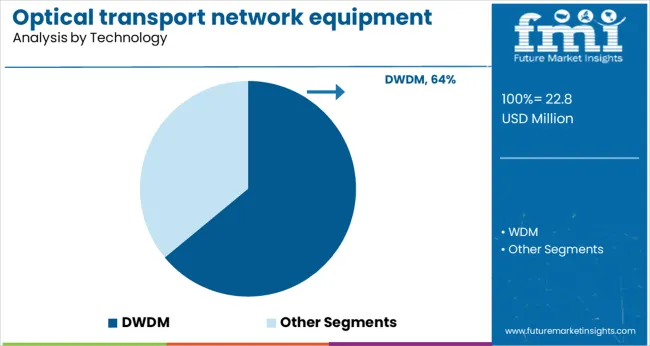
Dense Wavelength Division Multiplexing (DWDM) technology is projected to dominate the market with 64.0% revenue share in 2025. This leadership is being driven by its capability to transmit massive volumes of data across extended distances with high spectral efficiency.
DWDM enables operators to optimize fiber usage by supporting multiple wavelengths on a single strand, significantly reducing infrastructure costs. It has become essential for long-haul and metro networks that demand scalable bandwidth and minimal signal degradation.
Its compatibility with coherent optics and reconfigurable optical add-drop multiplexers (ROADMs) allows for enhanced flexibility and rapid provisioning of new services. The increasing reliance on video content, real-time data analytics, and hyperscale cloud services continues to place DWDM at the core of transport network upgrades worldwide.
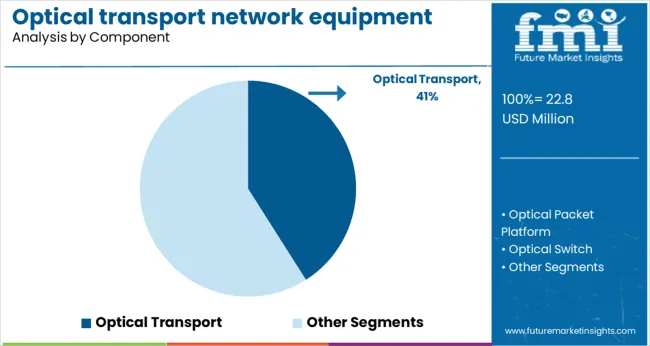
The optical transport component segment is expected to contribute 41.0% of the total revenue in 2025, making it the largest component category in the market. This dominance is attributed to rising investments in core and metro infrastructure where high-capacity optical transport platforms enable robust backbone connectivity.
The segment includes transponders, muxponders, amplifiers, and ROADMs-critical building blocks that ensure signal quality and route optimization over long distances. Demand has been further supported by the migration to high-speed coherent transmission and OTN switching, which require modular, scalable transport gear.
As data consumption continues to rise, the need for power-efficient, high-density optical systems is accelerating deployments, especially in regions prioritizing digital transformation and 5G readiness.
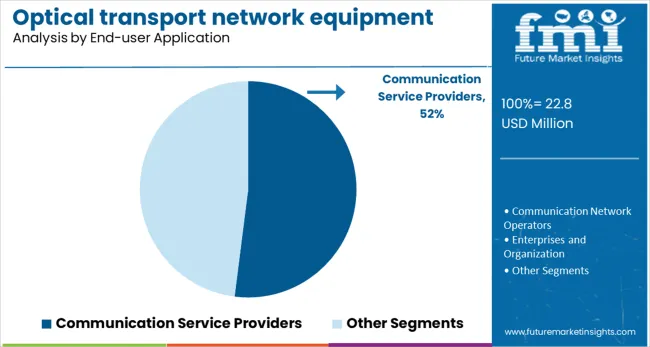
Communication service providers (CSPs) are projected to hold 52.0% of the total market revenue in 2025, placing them as the primary end-user group. This leadership is driven by continued expansion of fixed and mobile broadband services, the rollout of next-generation wireless networks, and increasing customer expectations for seamless connectivity.
CSPs are modernizing legacy infrastructure with high-capacity optical transport solutions to support growing traffic from streaming, cloud, and enterprise applications. The need to manage network congestion, ensure low latency, and scale rapidly has led to the adoption of programmable and open transport architectures.
Strategic partnerships between telecom operators and cloud service platforms have further incentivized CSPs to invest in optical networks capable of dynamic provisioning and multi-tenant slicing. As competitive pressures intensify, optical transport investments are being prioritized to ensure long-term service differentiation and operational agility.
It is expected that the high initial investment will pose a major challenge to the optical transport network equipment market during the forecast period. Customers such as telecommunications providers and data center providers are experiencing a significant increase in data consumption.
This will result in an increased demand for OTN equipment in the future. The fast-growing traffic, however, requires a comprehensive set of technologies and services, such as LTE/long-term evolution-advanced (LTE-A), big data, Internet of Things, and cloud computing, to keep up with the rapid growth of traffic.
OTN solutions indeed offer increased bandwidth and low latency using WDM technologies, but these solutions can be quite expensive for some customers. As a result of the high capital investment, customers must spend a great deal of money replacing the entire network transport hardware.
The high capital investment results in a long payback period for the investment. As well the fact that the deployment of these projects takes years, particularly in the telecom industry, customers often give them to vendors at a very competitive price.
Consequently, it is expected that the substantial initial investment required to deploy OTNs may inhibit the growth of the global market for OTN equipment.
As part of this cluster of regional markets led by countries such as Australia, India, and South Korea, China will continue to be one of the fastest growing. The Asia-Pacific market is predicted to reach USD 54.9 Billion by 2035, while Latin America will grow at 15.1% over the same period.
Partnerships, Collaborations, and Agreements:
Mergers and Acquisitions:
With ever-rising traffic over the internet, telecommunication providers are struggling to develop new ways to deal with it which is anticipated to increase the demand for optical transport network equipment during the forecast period.
The optical transport network equipment helps the telecommunication providers to achieve their objective of providing better services in addition to reducing their cost of ownership which is likely to rise in the optical transport network equipment market share.
As a result, the optical transport network equipment market size is anticipated to witness healthy growth rates in the near future as it is a technique to wrap all the digital traffic from multiple services onto optical light paths and at the same time preserve customer, timing and management information.
This enhances the capability of transport networks to carry various data traffic types such as Ethernet, digital video, storage and many more over a single optical frame which is likely to boost the adoption of optical transport network equipment in the market.
The optical transport network equipment are widely used for supervision, transport movements, switching and multiplexing led to an increase in the sales of optical transport network equipment in recent year.
It helps to frame all the data and share them with a single network system in which it is attached or communicated. These factors are useful to detect the data for future work, which is likely to rise in the adoption of optical transport network equipment in the forthcoming year.
The optical transport network equipment market growth is likely to enlarge high as the equipment collects all the relevant information without affecting the transport network as it is transparent and monitors the information from a distance.
With the advancements in technologies, telecom industries are experiencing heavy demand for optical transport network equipment due to rising internet and increasing smartphone penetration all around the globe during the forecast period from 2025 to 2035.
The networks are becoming more complex to fulfil the daily requirements of voice, data and video requirements of the customers, and the innovation of the equipment is likely to increase the optical transport network equipment market future trends in the coming year.
As a result, optical transport networking provides a much more efficient way of transporting information for telecom providers with clear data, which is anticipated to increase the sales of optical transport network equipment in the forthcoming year.
In addition, the adoption of optical transport network equipment offers various advantages, such as flexibility, cost-effectiveness, better monitoring and management, and highly secured services with improved reliability.
As a result, the demand for optical transport network equipment by telecommunication providers is expected to rise exponentially, which will pave the way for healthy growth rates shortly.
However, the possibility of failures, high costs involved, and lack of awareness about optical transport network equipment are the primary reasons that can restrain the optical transport network equipment market growth as per the optical transport network equipment market survey.
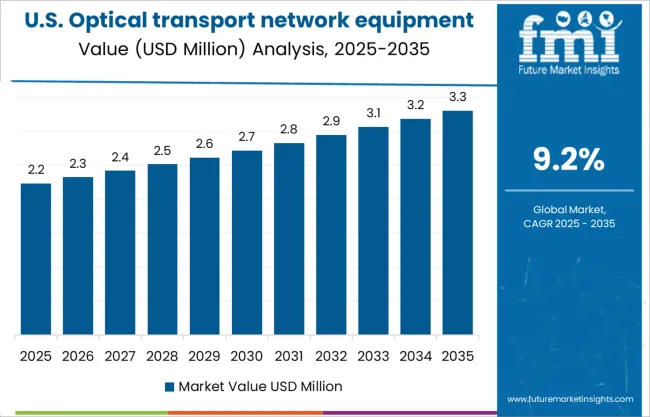
North America leading the optical transport network equipment market size by acquiring 34.4% of the share in the optical transport network equipment share during the forecast period from 2025 to 2035.
Due to rising IoT with a digital presence all around the globe, North America hold the highest revenue and lion’s share in the optical transport network equipment market key trends & opportunities
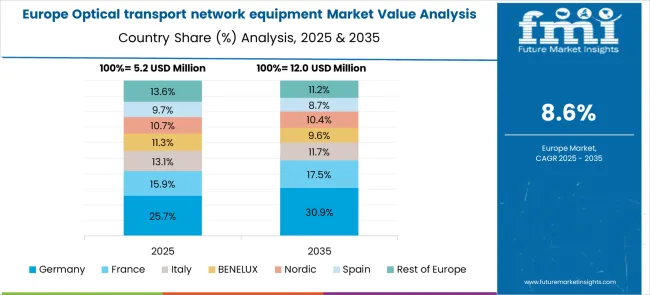
The Europe region stood in the second position in the optical transport network equipment market growth acquiring 18.7% of the share in the optical transport network equipment market statistics during the forecast period from 2025 to 2035.
With rising the adoption of the online platform, the region also connects with the IoT with the smart automated systems which are supposed to enlarge the Europe optical transport network equipment market trends in the coming year.
The key industry that is driving the key trends of the optical transport network equipment market during the forecast period. The increasing high speed of broadband is the primary factor in the growth of optical transport network equipment market key trends.
Recently, the china mobile company and Huawei dealt as a partner to enlarge the optical cable network. They want it to be built as the largest green optical network in Macao and Hong Kong areas. Bharti Airtel also dealt with Huawei for INR 22.8 Billion in February 2025 to upgrade the National Long Distance.
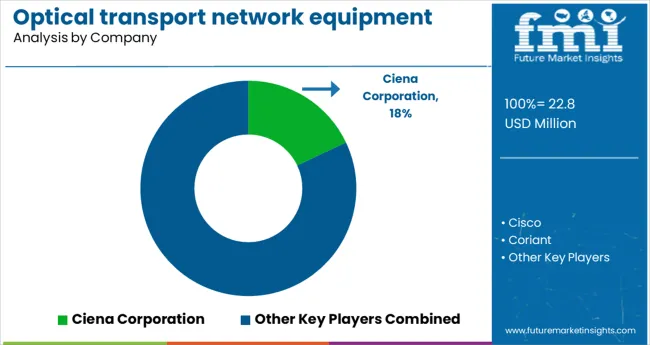
The key vendors in the global Optical transport network equipment market are Ciena Corporation, Cisco, Coriant, FUJITSU, Huawei Technologies Co., Ltd., Infinera Corporation, Nokia, and ZTE Corporation.
All key players are prominent leaders in the optical transport network equipment market future trends as they are likely to boost the strategies and innovate ideas to expand the optical transport network equipment market size.
| Report Attribute | Details |
|---|---|
| Growth Rate | CAGR of 9.2% from 2025 to 2035 |
| Base Year for Estimation | 2024 |
| Historical Data | 2020 to 2024 |
| Forecast Period | 2025 to 2035 |
| Quantitative Units | Revenue in million and CAGR from 2025 to 2035 |
| Report Coverage | Revenue Forecast, Volume Forecast, Company Ranking, Competitive Landscape, Growth Factors, Trends and Pricing Analysis |
| Segments Covered | Technology, End User, Region |
| Regions Covered | North America; Latin America; Europe; East Asia; South Asia; Oceania; Middle East and Africa |
| Key Countries Profiled | USA, Canada, Brazil, Argentina, Germany, UK, France, Spain, Italy, Nordics, BENELUX, Australia & New Zealand, China, India, ASEAN, GCC, South Africa |
| Key Companies Profiled | Ciena Corporation; Cisco; Coriant; FUJITSU; Huawei Technologies Co. Ltd; Infinera Corporation; Nokia; ZTE Corporation |
| Customization | Available Upon Request |
The global optical transport network equipment market is estimated to be valued at USD 22.8 million in 2025.
It is projected to reach USD 54.9 million by 2035.
The market is expected to grow at a 9.2% CAGR between 2025 and 2035.
The key product types are dwdm and wdm.
optical transport segment is expected to dominate with a 41.0% industry share in 2025.


Our Research Products

The "Full Research Suite" delivers actionable market intel, deep dives on markets or technologies, so clients act faster, cut risk, and unlock growth.

The Leaderboard benchmarks and ranks top vendors, classifying them as Established Leaders, Leading Challengers, or Disruptors & Challengers.

Locates where complements amplify value and substitutes erode it, forecasting net impact by horizon

We deliver granular, decision-grade intel: market sizing, 5-year forecasts, pricing, adoption, usage, revenue, and operational KPIs—plus competitor tracking, regulation, and value chains—across 60 countries broadly.

Spot the shifts before they hit your P&L. We track inflection points, adoption curves, pricing moves, and ecosystem plays to show where demand is heading, why it is changing, and what to do next across high-growth markets and disruptive tech

Real-time reads of user behavior. We track shifting priorities, perceptions of today’s and next-gen services, and provider experience, then pace how fast tech moves from trial to adoption, blending buyer, consumer, and channel inputs with social signals (#WhySwitch, #UX).

Partner with our analyst team to build a custom report designed around your business priorities. From analysing market trends to assessing competitors or crafting bespoke datasets, we tailor insights to your needs.
Supplier Intelligence
Discovery & Profiling
Capacity & Footprint
Performance & Risk
Compliance & Governance
Commercial Readiness
Who Supplies Whom
Scorecards & Shortlists
Playbooks & Docs
Category Intelligence
Definition & Scope
Demand & Use Cases
Cost Drivers
Market Structure
Supply Chain Map
Trade & Policy
Operating Norms
Deliverables
Buyer Intelligence
Account Basics
Spend & Scope
Procurement Model
Vendor Requirements
Terms & Policies
Entry Strategy
Pain Points & Triggers
Outputs
Pricing Analysis
Benchmarks
Trends
Should-Cost
Indexation
Landed Cost
Commercial Terms
Deliverables
Brand Analysis
Positioning & Value Prop
Share & Presence
Customer Evidence
Go-to-Market
Digital & Reputation
Compliance & Trust
KPIs & Gaps
Outputs
Full Research Suite comprises of:
Market outlook & trends analysis
Interviews & case studies
Strategic recommendations
Vendor profiles & capabilities analysis
5-year forecasts
8 regions and 60+ country-level data splits
Market segment data splits
12 months of continuous data updates
DELIVERED AS:
PDF EXCEL ONLINE
Optical Transport Network Market Size and Share Forecast Outlook 2025 to 2035
Gigabit Passive Optical Network Equipment Market Size and Share Forecast Outlook 2025 to 2035
Network Equipment Market Insights – Growth & Industry Forecast through 2035
High-Speed Connectivity – AI-Optimized Optical Networking
Packet Optical Networking Market
Passive Optical Network Market Size and Share Forecast Outlook 2025 to 2035
Optical Communication and Networking Market Size and Share Forecast Outlook 2025 to 2035
Enterprise Network Equipment Market Size and Share Forecast Outlook 2025 to 2035
Wireless Network Test Equipment Market Report – Growth & Forecast 2025 to 2035
Gigabit Passive Optical Network (GPON) Market Size and Share Forecast Outlook 2025 to 2035
Next Generation Network (NGN) Equipment Market Size and Share Forecast Outlook 2025 to 2035
Mobility Aids and Transportation Equipment Market is segmented by Product and Distribution Channel from 2025 to 2035
Optical Fiber Cold Joint Market Size and Share Forecast Outlook 2025 to 2035
Network Simulator Software Market Size and Share Forecast Outlook 2025 to 2035
Optical Spectrum Analyzer Market Size and Share Forecast Outlook 2025 to 2035
Optical Extinction Analyzer Market Size and Share Forecast Outlook 2025 to 2035
Optical Character Recognition Market Forecast and Outlook 2025 to 2035
Optical Satellite Market Size and Share Forecast Outlook 2025 to 2035
Optical Imaging Market Size and Share Forecast Outlook 2025 to 2035
Optical Whitening Agents Market Size and Share Forecast Outlook 2025 to 2035

Thank you!
You will receive an email from our Business Development Manager. Please be sure to check your SPAM/JUNK folder too.
Chat With
MaRIA