Optical Current Transformer Market Snapshot (2023 to 2033)

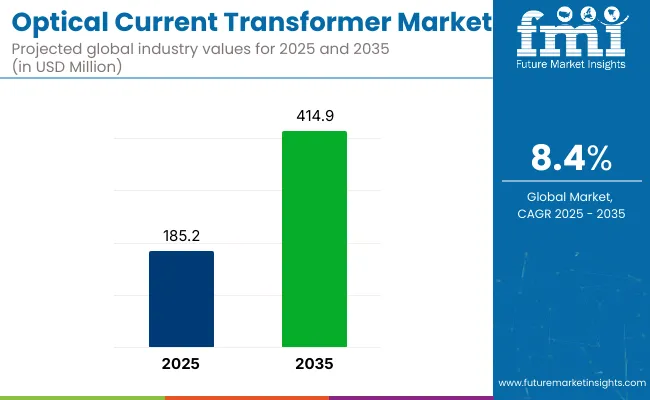
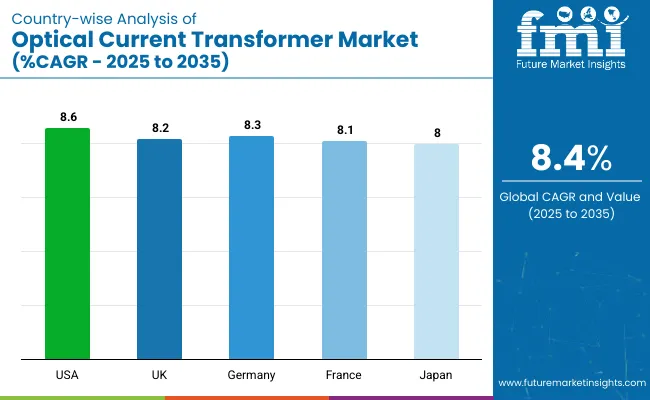
The global optical current transformer market is anticipated at US$ 145.4 million in 2022. Demand is likely to remain high for optical current transformers during the assessment period. This is due to the increased technological advances and urbanization and garnering US$ 353.0 million in 2033, recording a CAGR of 8.4 % from 2023 to 2033. The market is likely to secure US$ 157.6 million in 2023.

Data Points Key Statistics
Optical Current Transformer Market Size Value in 2023 US$ 157.6 million
Optical Current Transformer Market Forecast Value in 2033 US$ 353.0 million
Global Growth Rate 8.4%
Forecast Period 2023 to 2033

Key Factors Shaping the Demand Outlook of the Optical Current Transformer Industry:

  • The dispensable requirement of oil and gas insulation promotes the growth of the optical current transformer market share.
  • Demand for optical current transformers sustains due to their lighter weight and smaller size.
  • No mechanism of failure with improved safety induces the adoption of the optical current transformer.
  • High accuracy for metering over an extensive range of primary currents increases sales of optical current transformers.
  • A magneto-optical current transformer is preferred over a fiber optical current transformer owing to its innovative features and benefits regarding regulations expanding the overall optical current transformer market growth.
  • The eco-friendliness of the insulation system and reduced magnetic losses secure the growth of optical current transformer market trends.
  • The use of single fiber cables as opposed to several copper cables increases the demand for optical current transformers.

Don't pay for what you don't need

Customize your report by selecting specific countries or regions and save 30%!

Optical Current Transformer Market Revenue Analysis from 2018 to 2022 Vs Market Outlook for 2023 to 2033

Historical CAGR (2018 to 2022) 7.6%
Forecasted CAGR (2023 to 2033) 8.4%

The capability to withstand high mechanical loads promises growth for the optical current transformer market size. Demand for optical current transformers increases owing to low power consumption and electrical isolation.

Increasing process automation in the power and energy sector, like management and switching, promotes the sales of optical current transformers. Industrial control systems and various computing devices require the adoption of optical current transformers.

The need for measuring currents across power stations, along with the emergence of substations for current monitoring, further propels the optical current transformer market share. The market growth outcome is due to the need for accuracy in the domain of electric transduction rising the sales of optical current transformers.

The wide-scale induction of transformers in the field of renewable energy production expands the optical current transformer market size. According to Future Market Insights (FMI). In 2023, the demand for optical current transformers is estimated to reach a valuation of US$ 157.6 million.

What are the Key Factors that Drive the Optical Current Transformer Market?

Increasing Investment in Smart Grid Infrastructure to Drive the Market Growth

Increasing usage of high voltage devices across the transmission, distribution station, and power generation drives the sales of the optical current transformers. Industries encouraging the increasing use of computerized control techniques and digital devices surges the adoption of optical current transformers.

The fallibility of conventional transformers in terms of breakage and device damage increases demand for optical current transformers. Providing resistance in high voltage operations bolsters the global optical current transformer market size.

The inefficiency of inductive-type current transformers or porcelain insulators compels the adoption of optical current transformers by power stations and substations. Providing device protection and resistance against electromagnetic interference introduced by the ground loop broadens the optical current transformer market share.

The optical current transformer market share expands owing to its small and lightweight units. High voltage current causing damage to switchyards propels the sales of the optical current transformers.

Electric damage to relays, along with power service disruptions, grows the demand for optical current transformers. The economic aspect and liberty from using heavy machinery, both contribute to the global optical current transformer market size.

Complicated cooling structure and saturation of magnetic field under high currents of conventional transformers escalate the adoption of the optical current transformers.

The potential to accurately measure current at high voltage surges raises the sales of optical current transformers. Demand for optical current transformers increases owing to the possibility of measuring AC & DC.

Simpler insulation structure and wide frequency response further propel the optical current transformer market size. The sales of optical current transformers grow due to reduced risks of fire and explosions.

Compatibility with computer systems and capability to provide output in digital format owing to technological advancements promotes the global optical current transformer market share.

Nikhil Kaitwade
Nikhil Kaitwade

Principal Consultant

Talk to Analyst

Find your sweet spots for generating winning opportunities in this market.

What are the Restraints of the Optical Current Transformer Market?

The Lack of Skilled Labour May Hamper the Market Growth

The bending of optical fiber causes the refractive index to alter; therefore, reducing the response to sensitivity hinders the sales of the optical current transformers.

Hoops in the fiber increase in the influence of temperature obstructs the demand for optical current transformers. The demand for optical current transformers additionally hampers due to the lack of skilled labor.

Adoption of optical current transformer hampers due to long-run stability and accuracy problems.The bad transient performance further impedes the global optical current transformer market size.

The complex process involved in maintaining these specialty reformers further curbs the sales of the optical current transformers. Error and instability caused due to temperature, and stress-induced linear birefringence in the sending material also thwart the adoption of the optical current transformer.

Region-wise Analysis

How is the Performance of the Europe Optical Current Transformer Market?

Increasing Technological Advances to Drive Market Growth in The Region

Europe is currently dominating the global optical current transformer market with a share of 35.4%. Due to increasing investments and rapid technological development and urbanization, the European market witnesses a continuous growth of their optical current transformer market.

Europe is a significant market for OCTs, driven by the region's focus on renewable energy integration, energy efficiency, and the transition to a low-carbon economy. European countries have been at the forefront of grid modernization efforts and have implemented policies and regulations to promote sustainable energy practices. This creates a favorable market environment for OCTs

What is the Growth Outlook for the North America Optical Current Transformer Market?

Increasing Grid Modernization Activity in The Region to Boost the Market Growth

North America is following the lead of the optical current transformer with a share of 23.5%. Increasing demand for current transformers in industries and society collectively expands the optical current transformer market growth of this region.

The massive growth in both regions is a result of the applications of electric equipment in developed economies. Increasing investment in grid modernization to enhance the efficiency, reliability, and resilience of power infrastructure.

Optical current transformers are being increasingly deployed to replace traditional current transformers due to their advanced measurement capabilities and compatibility with digital monitoring systems.

How will the South Asia and Pacific Optical Current Transformer Market Perform?

Increasing Industrialization to Drive the Market Growth

South Asia and the Pacific are anticipated to account for a significant share of the global optical current transformer market over the forecast period 2023 to 2033. The region is expected to account for a CAGR of 8.1% during the forecast period.

South Asia and the Pacific are closely following and are anticipated to witness significant growth owing to the rising number of power stations and the increase in demand for commercial power.

Rapid advancement in electrical components along with rising industrial utility are expected to drive the market in the forecast period. Global electrical distribution or consumption growth over the years is spurring market growth.

Factors such as increasing power demand, expanding power infrastructure, and the adoption of renewable energy contribute to the market's growth. Government initiatives, particularly in China, to upgrade power grids and support the integration of renewable energy sources have driven the demand for optical current transformers in the region.

Get the data you need at a Fraction of the cost

Personalize your report by choosing insights you need
and save 40%!

Category-wise Insights

Based on type, Which Segment Accounts for the Highest Revenue in the Optical Current Transformer Market?

Magnetic Segment to Remain Highly Sought After

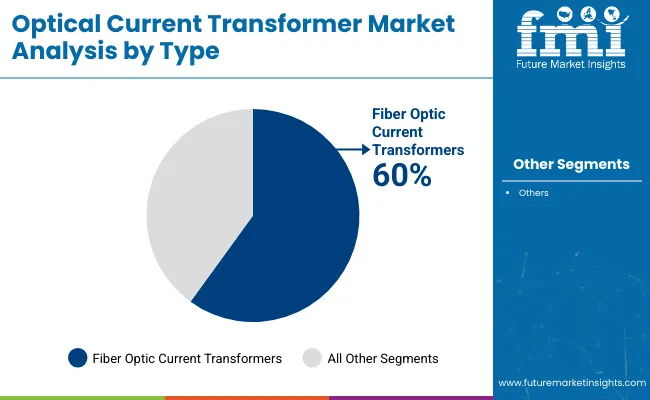
In terms of type, the global market has been segmented into magnetic optical current transformers and fiber optical current transformers. The magnetic optical current transformer type segment is likely to lead the global market during the forecast period.

Magnetic optical current transformers provide accurate current measurements with a high degree of precision. These transformers are ideal for applications that require reliable and precise current measurements. The segment is projected to account for a CAGR of 8.3% during the forecast period.

Based on the Application, Which Segment Accounts for the Highest Revenue in the Optical Current Transformer Market?

Power System Instrumentation segment to generate high Revenue

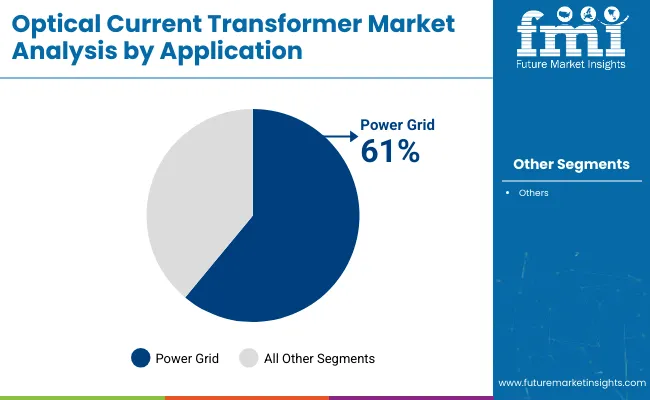
As per FMI’s analysis, the power system instrumentation segment accounts for 27.3% of the total optical current transformer market share. The segment is projected to account for a CAGR of 8.2% during the forecast period.

Optical current transformers offer several advantages over magnetic CTs, including higher bandwidth, greater accuracy, and immunity to electromagnetic interference. These features make OCTs ideal for power system protection applications, where fast and accurate measurement of current is essential for detecting faults and triggering protective devices.

Start-up Ecosystem

How is the Start-up Ecosystem in the Optical Current Transformer Market?

Growth opportunities in the optical current transformer market share are increasing due to the advancement in current transformer solutions. The ongoing research and development activities by manufacturers, including rapid investments are increasing the demand.

The wide dynamic range and needless electric components, and the availability of dual types of current transformers propel the sales of the optical current transformers.

Some startup companies that are greatly contributing to the advancement and distribution are EnglishCo LLC, Netico GmBH, Qoitech AB, DeepStream Technologies Ltd., Hangzhou Anmaisheng Intelligent Technology Co. Ltd., etc.

With the help of their leading innovations and growing global factory network, they provide the highest level of quality and reliability to consumers.

What are the Key Developments of Optical Current Transformer Market?

Some of the key market participants in the optical current transformer market are ARTECH, TRENCH Group, Asea Brown Boveri (ABB) Group Ltd., GE Grid Solution, SIEMENS AG, JSC PROFOTECH, Beijing Daelim Green EP Tech Co., NR Electric Co., T&D, Pfiffner, RITZ INSTRUMENT TRANSFORMERS GMBH, Emek Elektrik Industries, Indian Transformers, Koncar Power Transformers Ltd., DYH (Activ1 Technology Co. Ltd.), Dalian Beifang, Daelim Belefic, KA Factor Group, EnglishCo LLC, Netico GmBH, Qoitech AB, DeepStream Technologies Ltd., Hangzhou Anmaisheng Intelligent Technology Co. Ltd., etc.

They assist in increasing revenues and expanding product offerings in standardized form by introducing Research and Development activities and strategies that encourage expansion, collaboration, and development with other firms.

Some of the recent developments in the optical current transformer market are:

  • In 2018, Profotech became a resident of the special economic zone ‘Technopolis Moscow’ and set up serial production.
  • In 2022, ARTECHE participated in the hackathon ‘2022-Weetbe’, innovating in the asset management of the High Voltage Power Grid.
  • In May 2022, the Hunan 500kV Shuicheng substation was successfully put into operation to realize the remote one key sequence control function.
  • In December 2020, NR Electric Co. independently developed the complete set of voltage sag control equipment based on the high-speed switch and successfully passed the full set type test of Xi’an High Voltage Apparatus Research Institute, and its performance was fully certified by the authority.
  • ABB introduced OPTICALCAL, an optical calibration system for optical current transformers. It enables accurate calibration of OCTs, ensuring reliable and precise current measurements. ABB collaborated with Rievtech Electronic Co. to develop a new range of high-voltage optical current transformers for the Chinese market. The collaboration aims to leverage ABB's expertise in OCT tech

Report Scope

Report Attribute Details
Growth Rate CAGR of 8.4% from 2023 to2033
Market Value in 2023 US$ 157.6 million
Market Value in 2033 US$ 353 million
Base Year for Estimation 2022
Historical Data 2018 to 2022
Forecast Period 2023 to 2033
Quantitative Units Revenue in US$ Billion and CAGR from 2023 to 2033
Report Coverage Revenue Forecast, Company Ranking, Competitive Landscape, Growth Factors, Trends, and Pricing Analysis
Segments Covered
  • Payload Capacity
  • Mineral Type
  • Region
Regions Covered
  • North America
  • Latin America
  • Western Europe
  • Eastern Europe
  • South Asia and Pacific
  • East Asia
  • Middle East & Africa
Key Countries Profiled
  • United States
  • Canada
  • Brazil
  • Mexico
  • Germany
  • United Kingdom
  • France
  • Spain
  • Italy
  • Poland
  • Russia
  • Czech Republic
  • Romania
  • India
  • Bangladesh
  • Australia
  • New Zealand
  • China
  • Japan
  • South Korea
  • GCC Countries
  • South Africa
  • Israel
  • Rest of MEA
Key Companies Profiled
  • Siemens Energy
  • Arteche
  • General Electric
  • Profotech JSC
  • CONDIS Group
  • Zhejiang Great Electrical Co., Ltd
  • Sieyuan Electric Co., Ltd.
  • Yangtze Optical Electronic Co., Ltd.
  • ABB
  • Comcore Technologies
  • Hitachi Energy Ltd.

Key Segments Profiled in the Optical Current Transformer Market Survey

By Type:

  • Magnetic
  • Fiber

By Application:

  • Electrical High Voltage Substation
  • Network Applications
  • Power System & Instrumentation
  • Modern Electronic Meter Transformer
  • Transmission Line

By Region:

  • North America
  • Latin America
  • Western Europe
  • Eastern Europe
  • South Asia and Pacific
  • East Asia
  • Middle East & Africa

Frequently Asked Questions

How is the Performance of Europe’s Market?

Increasing technological advances is estimated to drive market growth in the region.

Who are the Prominent Optical Current Transformer Market Players?

Arteche, General Electric, Profotech JSC are the prominent market players.

What is the Growth Forecast for the Optical Current Transformer Market?

The industry is forecast to register a CAGR of 8.4% through 2033.

What is the Projected Industry Valuation in 2033?

The industry is estimated to be worth US$ 353.0 million by 2033.

Based on type, which Segment Accounts for the Highest Revenue in the Market?

The magnetic segment is likely to lead the global market during the forecast period.

Table of Content
1. Executive Summary
    1.1. Global Market Outlook
    1.2. Demand-side Trends
    1.3. Supply-side Trends
    1.4. Technology Roadmap Analysis
    1.5. Analysis and Recommendations
2. Market Overview
    2.1. Market Coverage / Taxonomy
    2.2. Market Definition / Scope / Limitations
3. Market Background
    3.1. Market Dynamics
        3.1.1. Drivers
        3.1.2. Restraints
        3.1.3. Opportunity
        3.1.4. Trends
    3.2. Scenario Forecast
        3.2.1. Demand in Optimistic Scenario
        3.2.2. Demand in Likely Scenario
        3.2.3. Demand in Conservative Scenario
    3.3. Opportunity Map Analysis
    3.4. Product Life Cycle Analysis
    3.5. Supply Chain Analysis
        3.5.1. Supply Side Participants and their Roles
            3.5.1.1. Producers
            3.5.1.2. Mid-Level Participants (Traders/ Agents/ Brokers)
            3.5.1.3. Wholesalers and Distributors
        3.5.2. Value Added and Value Created at Node in the Supply Chain
        3.5.3. List of Raw Material Suppliers
        3.5.4. List of Existing and Potential Buyer’s
    3.6. Investment Feasibility Matrix
    3.7. Value Chain Analysis
        3.7.1. Profit Margin Analysis
        3.7.2. Wholesalers and Distributors
        3.7.3. Retailers
    3.8. PESTLE and Porter’s Analysis
    3.9. Regulatory Landscape
        3.9.1. By Key Regions
        3.9.2. By Key Countries
    3.10. Regional Parent Market Outlook
    3.11. Production and Consumption Statistics
    3.12. Import and Export Statistics
4. Global Market Analysis 2018 to 2022 and Forecast, 2023 to 2033
    4.1. Historical Market Size Value (US$ Million) & Volume (Units) Analysis, 2018 to 2022
    4.2. Current and Future Market Size Value (US$ Million) & Volume (Units) Projections, 2023 to 2033
        4.2.1. Y-o-Y Growth Trend Analysis
        4.2.2. Absolute $ Opportunity Analysis
5. Global Market Analysis 2018 to 2022 and Forecast 2023 to 2033, By Type
    5.1. Introduction / Key Findings
    5.2. Historical Market Size Value (US$ Million) & Volume (Units) Analysis By Type, 2018 to 2022
    5.3. Current and Future Market Size Value (US$ Million) & Volume (Units) Analysis and Forecast By Type, 2023 to 2033
        5.3.1. Magnetic
        5.3.2. Fiber
    5.4. Y-o-Y Growth Trend Analysis By Type, 2018 to 2022
    5.5. Absolute $ Opportunity Analysis By Type, 2023 to 2033
6. Global Market Analysis 2018 to 2022 and Forecast 2023 to 2033, By Application
    6.1. Introduction / Key Findings
    6.2. Historical Market Size Value (US$ Million) & Volume (Units) Analysis By Application, 2018 to 2022
    6.3. Current and Future Market Size Value (US$ Million) & Volume (Units) Analysis and Forecast By Application, 2023 to 2033
        6.3.1. Electrical High Voltage Substation
        6.3.2. Network Applications
        6.3.3. Power System & Instrumentation
        6.3.4. Modern Electronic Meter Transformer
        6.3.5. Transmission Line
    6.4. Y-o-Y Growth Trend Analysis By Application, 2018 to 2022
    6.5. Absolute $ Opportunity Analysis By Application, 2023 to 2033
7. Global Market Analysis 2018 to 2022 and Forecast 2023 to 2033, By Region
    7.1. Introduction
    7.2. Historical Market Size Value (US$ Million) & Volume (Units) Analysis By Region, 2018 to 2022
    7.3. Current Market Size Value (US$ Million) & Volume (Units) Analysis and Forecast By Region, 2023 to 2033
        7.3.1. North America
        7.3.2. Latin America
        7.3.3. Western Europe
        7.3.4. Eastern Europe
        7.3.5. South Asia and Pacific
        7.3.6. East Asia
        7.3.7. Middle East and Africa
    7.4. Market Attractiveness Analysis By Region
8. North America Market Analysis 2018 to 2022 and Forecast 2023 to 2033, By Country
    8.1. Historical Market Size Value (US$ Million) & Volume (Units) Trend Analysis By Market Taxonomy, 2018 to 2022
    8.2. Market Size Value (US$ Million) & Volume (Units) Forecast By Market Taxonomy, 2023 to 2033
        8.2.1. By Country
            8.2.1.1. USA
            8.2.1.2. Canada
        8.2.2. By Type
        8.2.3. By Application
    8.3. Market Attractiveness Analysis
        8.3.1. By Country
        8.3.2. By Type
        8.3.3. By Application
    8.4. Key Takeaways
9. Latin America Market Analysis 2018 to 2022 and Forecast 2023 to 2033, By Country
    9.1. Historical Market Size Value (US$ Million) & Volume (Units) Trend Analysis By Market Taxonomy, 2018 to 2022
    9.2. Market Size Value (US$ Million) & Volume (Units) Forecast By Market Taxonomy, 2023 to 2033
        9.2.1. By Country
            9.2.1.1. Brazil
            9.2.1.2. Mexico
            9.2.1.3. Rest of Latin America
        9.2.2. By Type
        9.2.3. By Application
    9.3. Market Attractiveness Analysis
        9.3.1. By Country
        9.3.2. By Type
        9.3.3. By Application
    9.4. Key Takeaways
10. Western Europe Market Analysis 2018 to 2022 and Forecast 2023 to 2033, By Country
    10.1. Historical Market Size Value (US$ Million) & Volume (Units) Trend Analysis By Market Taxonomy, 2018 to 2022
    10.2. Market Size Value (US$ Million) & Volume (Units) Forecast By Market Taxonomy, 2023 to 2033
        10.2.1. By Country
            10.2.1.1. Germany
            10.2.1.2. UK
            10.2.1.3. France
            10.2.1.4. Spain
            10.2.1.5. Italy
            10.2.1.6. Rest of Western Europe
        10.2.2. By Type
        10.2.3. By Application
    10.3. Market Attractiveness Analysis
        10.3.1. By Country
        10.3.2. By Type
        10.3.3. By Application
    10.4. Key Takeaways
11. Eastern Europe Market Analysis 2018 to 2022 and Forecast 2023 to 2033, By Country
    11.1. Historical Market Size Value (US$ Million) & Volume (Units) Trend Analysis By Market Taxonomy, 2018 to 2022
    11.2. Market Size Value (US$ Million) & Volume (Units) Forecast By Market Taxonomy, 2023 to 2033
        11.2.1. By Country
            11.2.1.1. Poland
            11.2.1.2. Russia
            11.2.1.3. Czech Republic
            11.2.1.4. Romania
            11.2.1.5. Rest of Eastern Europe
        11.2.2. By Type
        11.2.3. By Application
    11.3. Market Attractiveness Analysis
        11.3.1. By Country
        11.3.2. By Type
        11.3.3. By Application
    11.4. Key Takeaways
12. South Asia and Pacific Market Analysis 2018 to 2022 and Forecast 2023 to 2033, By Country
    12.1. Historical Market Size Value (US$ Million) & Volume (Units) Trend Analysis By Market Taxonomy, 2018 to 2022
    12.2. Market Size Value (US$ Million) & Volume (Units) Forecast By Market Taxonomy, 2023 to 2033
        12.2.1. By Country
            12.2.1.1. India
            12.2.1.2. Bangladesh
            12.2.1.3. Australia
            12.2.1.4. New Zealand
            12.2.1.5. Rest of South Asia and Pacific
        12.2.2. By Type
        12.2.3. By Application
    12.3. Market Attractiveness Analysis
        12.3.1. By Country
        12.3.2. By Type
        12.3.3. By Application
    12.4. Key Takeaways
13. East Asia Market Analysis 2018 to 2022 and Forecast 2023 to 2033, By Country
    13.1. Historical Market Size Value (US$ Million) & Volume (Units) Trend Analysis By Market Taxonomy, 2018 to 2022
    13.2. Market Size Value (US$ Million) & Volume (Units) Forecast By Market Taxonomy, 2023 to 2033
        13.2.1. By Country
            13.2.1.1. China
            13.2.1.2. Japan
            13.2.1.3. South Korea
        13.2.2. By Type
        13.2.3. By Application
    13.3. Market Attractiveness Analysis
        13.3.1. By Country
        13.3.2. By Type
        13.3.3. By Application
    13.4. Key Takeaways
14. Middle East and Africa Market Analysis 2018 to 2022 and Forecast 2023 to 2033, By Country
    14.1. Historical Market Size Value (US$ Million) & Volume (Units) Trend Analysis By Market Taxonomy, 2018 to 2022
    14.2. Market Size Value (US$ Million) & Volume (Units) Forecast By Market Taxonomy, 2023 to 2033
        14.2.1. By Country
            14.2.1.1. GCC Countries
            14.2.1.2. South Africa
            14.2.1.3. Israel
            14.2.1.4. Rest of MEA
        14.2.2. By Type
        14.2.3. By Application
    14.3. Market Attractiveness Analysis
        14.3.1. By Country
        14.3.2. By Type
        14.3.3. By Application
    14.4. Key Takeaways
15. Key Countries Market Analysis
    15.1. USA
        15.1.1. Pricing Analysis
        15.1.2. Market Share Analysis, 2022
            15.1.2.1. By Type
            15.1.2.2. By Application
    15.2. Canada
        15.2.1. Pricing Analysis
        15.2.2. Market Share Analysis, 2022
            15.2.2.1. By Type
            15.2.2.2. By Application
    15.3. Brazil
        15.3.1. Pricing Analysis
        15.3.2. Market Share Analysis, 2022
            15.3.2.1. By Type
            15.3.2.2. By Application
    15.4. Mexico
        15.4.1. Pricing Analysis
        15.4.2. Market Share Analysis, 2022
            15.4.2.1. By Type
            15.4.2.2. By Application
    15.5. Germany
        15.5.1. Pricing Analysis
        15.5.2. Market Share Analysis, 2022
            15.5.2.1. By Type
            15.5.2.2. By Application
    15.6. UK
        15.6.1. Pricing Analysis
        15.6.2. Market Share Analysis, 2022
            15.6.2.1. By Type
            15.6.2.2. By Application
    15.7. France
        15.7.1. Pricing Analysis
        15.7.2. Market Share Analysis, 2022
            15.7.2.1. By Type
            15.7.2.2. By Application
    15.8. Spain
        15.8.1. Pricing Analysis
        15.8.2. Market Share Analysis, 2022
            15.8.2.1. By Type
            15.8.2.2. By Application
    15.9. Italy
        15.9.1. Pricing Analysis
        15.9.2. Market Share Analysis, 2022
            15.9.2.1. By Type
            15.9.2.2. By Application
    15.10. Poland
        15.10.1. Pricing Analysis
        15.10.2. Market Share Analysis, 2022
            15.10.2.1. By Type
            15.10.2.2. By Application
    15.11. Russia
        15.11.1. Pricing Analysis
        15.11.2. Market Share Analysis, 2022
            15.11.2.1. By Type
            15.11.2.2. By Application
    15.12. Czech Republic
        15.12.1. Pricing Analysis
        15.12.2. Market Share Analysis, 2022
            15.12.2.1. By Type
            15.12.2.2. By Application
    15.13. Romania
        15.13.1. Pricing Analysis
        15.13.2. Market Share Analysis, 2022
            15.13.2.1. By Type
            15.13.2.2. By Application
    15.14. India
        15.14.1. Pricing Analysis
        15.14.2. Market Share Analysis, 2022
            15.14.2.1. By Type
            15.14.2.2. By Application
    15.15. Bangladesh
        15.15.1. Pricing Analysis
        15.15.2. Market Share Analysis, 2022
            15.15.2.1. By Type
            15.15.2.2. By Application
    15.16. Australia
        15.16.1. Pricing Analysis
        15.16.2. Market Share Analysis, 2022
            15.16.2.1. By Type
            15.16.2.2. By Application
    15.17. New Zealand
        15.17.1. Pricing Analysis
        15.17.2. Market Share Analysis, 2022
            15.17.2.1. By Type
            15.17.2.2. By Application
    15.18. China
        15.18.1. Pricing Analysis
        15.18.2. Market Share Analysis, 2022
            15.18.2.1. By Type
            15.18.2.2. By Application
    15.19. Japan
        15.19.1. Pricing Analysis
        15.19.2. Market Share Analysis, 2022
            15.19.2.1. By Type
            15.19.2.2. By Application
    15.20. South Korea
        15.20.1. Pricing Analysis
        15.20.2. Market Share Analysis, 2022
            15.20.2.1. By Type
            15.20.2.2. By Application
    15.21. GCC Countries
        15.21.1. Pricing Analysis
        15.21.2. Market Share Analysis, 2022
            15.21.2.1. By Type
            15.21.2.2. By Application
    15.22. South Africa
        15.22.1. Pricing Analysis
        15.22.2. Market Share Analysis, 2022
            15.22.2.1. By Type
            15.22.2.2. By Application
    15.23. Israel
        15.23.1. Pricing Analysis
        15.23.2. Market Share Analysis, 2022
            15.23.2.1. By Type
            15.23.2.2. By Application
16. Market Structure Analysis
    16.1. Competition Dashboard
    16.2. Competition Benchmarking
    16.3. Market Share Analysis of Top Players
        16.3.1. By Regional
        16.3.2. By Type
        16.3.3. By Application
17. Competition Analysis
    17.1. Competition Deep Dive
        17.1.1. Siemens Energy
            17.1.1.1. Overview
            17.1.1.2. Product Portfolio
            17.1.1.3. Profitability by Market Segments
            17.1.1.4. Sales Footprint
            17.1.1.5. Strategy Overview
                17.1.1.5.1. Marketing Strategy
                17.1.1.5.2. Product Strategy
                17.1.1.5.3. Channel Strategy
        17.1.2. Arteche
            17.1.2.1. Overview
            17.1.2.2. Product Portfolio
            17.1.2.3. Profitability by Market Segments
            17.1.2.4. Sales Footprint
            17.1.2.5. Strategy Overview
                17.1.2.5.1. Marketing Strategy
                17.1.2.5.2. Product Strategy
                17.1.2.5.3. Channel Strategy
        17.1.3. General Electric
            17.1.3.1. Overview
            17.1.3.2. Product Portfolio
            17.1.3.3. Profitability by Market Segments
            17.1.3.4. Sales Footprint
            17.1.3.5. Strategy Overview
                17.1.3.5.1. Marketing Strategy
                17.1.3.5.2. Product Strategy
                17.1.3.5.3. Channel Strategy
        17.1.4. Profotech JSC
            17.1.4.1. Overview
            17.1.4.2. Product Portfolio
            17.1.4.3. Profitability by Market Segments
            17.1.4.4. Sales Footprint
            17.1.4.5. Strategy Overview
                17.1.4.5.1. Marketing Strategy
                17.1.4.5.2. Product Strategy
                17.1.4.5.3. Channel Strategy
        17.1.5. CONDIS Group
            17.1.5.1. Overview
            17.1.5.2. Product Portfolio
            17.1.5.3. Profitability by Market Segments
            17.1.5.4. Sales Footprint
            17.1.5.5. Strategy Overview
                17.1.5.5.1. Marketing Strategy
                17.1.5.5.2. Product Strategy
                17.1.5.5.3. Channel Strategy
        17.1.6. Zhejiang Great Electrical Co., Ltd
            17.1.6.1. Overview
            17.1.6.2. Product Portfolio
            17.1.6.3. Profitability by Market Segments
            17.1.6.4. Sales Footprint
            17.1.6.5. Strategy Overview
                17.1.6.5.1. Marketing Strategy
                17.1.6.5.2. Product Strategy
                17.1.6.5.3. Channel Strategy
        17.1.7. Sieyuan Electric Co., Ltd.
            17.1.7.1. Overview
            17.1.7.2. Product Portfolio
            17.1.7.3. Profitability by Market Segments
            17.1.7.4. Sales Footprint
            17.1.7.5. Strategy Overview
                17.1.7.5.1. Marketing Strategy
                17.1.7.5.2. Product Strategy
                17.1.7.5.3. Channel Strategy
        17.1.8. Yangtze Optical Electronic Co., Ltd.
            17.1.8.1. Overview
            17.1.8.2. Product Portfolio
            17.1.8.3. Profitability by Market Segments
            17.1.8.4. Sales Footprint
            17.1.8.5. Strategy Overview
                17.1.8.5.1. Marketing Strategy
                17.1.8.5.2. Product Strategy
                17.1.8.5.3. Channel Strategy
        17.1.9. ABB
            17.1.9.1. Overview
            17.1.9.2. Product Portfolio
            17.1.9.3. Profitability by Market Segments
            17.1.9.4. Sales Footprint
            17.1.9.5. Strategy Overview
                17.1.9.5.1. Marketing Strategy
                17.1.9.5.2. Product Strategy
                17.1.9.5.3. Channel Strategy
        17.1.10. Comcore Technologies
            17.1.10.1. Overview
            17.1.10.2. Product Portfolio
            17.1.10.3. Profitability by Market Segments
            17.1.10.4. Sales Footprint
            17.1.10.5. Strategy Overview
                17.1.10.5.1. Marketing Strategy
                17.1.10.5.2. Product Strategy
                17.1.10.5.3. Channel Strategy
        17.1.11. Hitachi Energy Ltd.
            17.1.11.1. Overview
            17.1.11.2. Product Portfolio
            17.1.11.3. Profitability by Market Segments
            17.1.11.4. Sales Footprint
            17.1.11.5. Strategy Overview
                17.1.11.5.1. Marketing Strategy
                17.1.11.5.2. Product Strategy
                17.1.11.5.3. Channel Strategy
18. Assumptions & Acronyms Used
19. Research Methodology
Recommendations

Industrial Automation

Medium Voltage Transformer Market

October 2023

REP-GB-772

273 pages

Industrial Automation

Optical Measuring Systems Market

June 2023

REP-GB-4666

323 pages

Explore Industrial Automation Insights

View Reports
Future Market Insights

Optical Current Transformer Market

Schedule a Call