Optical Character Recognition Market Size and Share Forecast Outlook 2025 to 2035

The Optical Character Recognition Market is estimated to be valued at USD 16.3 billion in 2025 and is projected to reach USD 60.7 billion by 2035, registering a compound annual growth rate (CAGR) of 14.1% over the forecast period.

The Optical Character Recognition (OCR) market is experiencing strong growth, driven by the increasing need for automation in document processing, data extraction, and business workflow optimization across various industries. Organizations are adopting OCR technologies to digitize paper-based documents, invoices, forms, and contracts, thereby improving operational efficiency and reducing manual labor. Advanced OCR solutions integrating artificial intelligence, machine learning, and natural language processing are enhancing accuracy, enabling real-time data capture, and supporting complex multilingual text recognition.

The growing emphasis on digital transformation, regulatory compliance, and secure record-keeping is further accelerating adoption. Businesses are leveraging OCR technologies to reduce processing errors, optimize customer experience, and gain actionable insights from structured and unstructured data sources.

The market is also benefiting from increased deployment in cloud-based and mobile environments, allowing scalable, accessible, and cost-effective implementations As organizations continue to pursue efficiency, automation, and data-driven decision-making, the OCR market is positioned for sustained expansion, with innovations in AI-powered recognition and intelligent document processing shaping future growth opportunities.

Quick Stats for Optical Character Recognition Market

  • Optical Character Recognition Market Industry Value (2025): USD 16.3 billion
  • Optical Character Recognition Market Forecast Value (2035): USD 60.7 billion
  • Optical Character Recognition Market Forecast CAGR: 14.1%
  • Leading Segment in Optical Character Recognition Market in 2025: Software (28.6%)
  • Key Growth Region in Optical Character Recognition Market: North America, Asia-Pacific, Europe
  • Top Key Players in Optical Character Recognition Market: Adobe Inc., Microsoft Corporation, Google LLC, IBM Corporation, Nuance Communications, Inc., ABBYY, Open Text Corporation, CVISION Technologies Inc., Anyline GmbH, Captricity, ATAPY Software

Optical Character Recognition Market Market Value Analysis

Metric Value
Optical Character Recognition Market Estimated Value in (2025 E) USD 16.3 billion
Optical Character Recognition Market Forecast Value in (2035 F) USD 60.7 billion
Forecast CAGR (2025 to 2035) 14.1%

Segmental Analysis

The market is segmented by Component, End-Use, and Industry Vertical and region. By Component, the market is divided into Software and Services. In terms of End-Use, the market is classified into B2B and B2C. Based on Industry Vertical, the market is segmented into Banking, Financial Services, And Insurance (BFSI), Healthcare, IT & Telecom, Retail, Government And Public Sector, Education, Transportation & Logistics, Media & Entertainment, Hospitality, and Others (Manufacturing, Construction). Regionally, the market is classified into North America, Latin America, Western Europe, Eastern Europe, Balkan & Baltic Countries, Russia & Belarus, Central Asia, East Asia, South Asia & Pacific, and the Middle East & Africa.
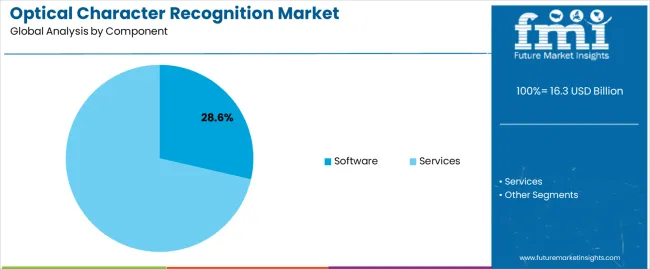
Insights into the Software Component Segment

Optical Character Recognition Market Analysis By Component

The software component segment is projected to hold 28.6% of the market revenue in 2025, establishing it as the leading component type. Growth in this segment is being driven by the increasing reliance on OCR software for document digitization, data extraction, and workflow automation. Software solutions provide flexibility for integration with enterprise systems, including content management, customer relationship management, and business intelligence platforms.

AI-powered capabilities, including intelligent text recognition, handwriting analysis, and real-time data validation, enhance accuracy and operational efficiency. The adoption of cloud-based OCR software enables scalable deployments, remote accessibility, and cost-effective maintenance. Organizations are leveraging software solutions to improve compliance, reduce manual intervention, and accelerate processing times.

Continuous improvements in software algorithms, user interfaces, and interoperability with legacy systems are reinforcing its market leadership As enterprises increasingly pursue digital transformation strategies, the OCR software segment is expected to maintain its leading position, supported by advancements in automation, artificial intelligence, and enterprise integration.
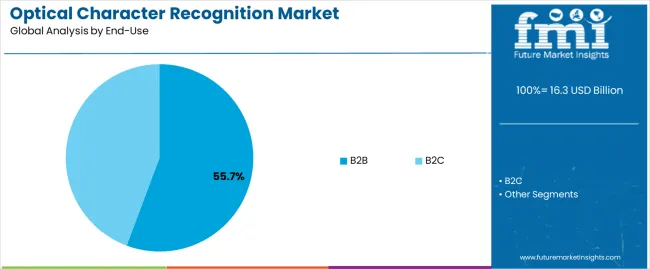
Insights into the B2B End-Use Segment

Optical Character Recognition Market Analysis By End Use

The B2B end-use segment is anticipated to account for 55.7% of the market revenue in 2025, making it the largest end-use category. Growth is being driven by the adoption of OCR technologies to automate document-heavy processes in industries such as banking, finance, insurance, logistics, and legal services. These organizations require high-volume, accurate, and secure data capture to maintain compliance, optimize operational efficiency, and enhance customer service.

OCR enables automated extraction of information from invoices, contracts, forms, and correspondence, reducing manual errors and processing time. Integration with enterprise resource planning, customer relationship management, and business intelligence platforms supports analytics-driven decision-making.

The need for secure, auditable, and fast document processing in B2B operations continues to reinforce the adoption of OCR As businesses focus on automation, digital transformation, and cost efficiency, the B2B segment is expected to remain the primary driver of market growth, supported by scalable software solutions and AI-powered intelligent document processing.
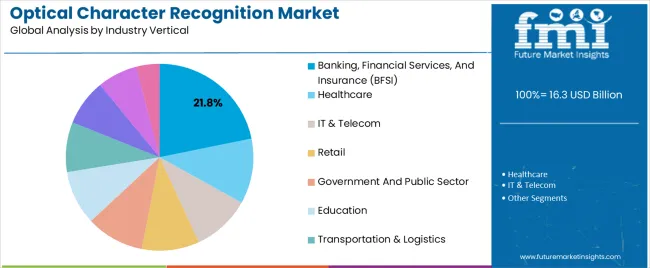
Insights into the Banking, Financial Services, and Insurance Industry Vertical Segment

Optical Character Recognition Market Analysis By Industry Vertical

The BFSI industry vertical segment is projected to hold 21.8% of the market revenue in 2025, establishing it as a key contributor to overall OCR adoption. Growth in this segment is being driven by the high volume of documents, forms, and records processed daily, which require efficient digitization and data extraction.

OCR enables automated processing of loan applications, account opening forms, invoices, and compliance documents, reducing manual labor, improving accuracy, and accelerating turnaround times. Advanced solutions integrating AI and machine learning facilitate secure, real-time data capture and validation, which enhances operational efficiency and regulatory compliance.

Organizations in BFSI are increasingly leveraging OCR to streamline back-office operations, enhance customer service, and reduce costs associated with document handling and storage As financial institutions focus on digital transformation, automation, and enhanced customer experience, the BFSI segment is expected to remain a leading vertical, driving OCR market growth through continued technology adoption and innovation.

Overview of the Document Scanning and OCR Software Landscape

Key companies are integrating OCR with artificial intelligence (AI) and machine learning (ML) technologies to provide better service to customers. They are also striving to broaden the use of OCR in education to digitize learning materials.

Increasing demand for data extraction in the financial and banking industries is set to propel growth. At the same time, rapid digitization and automation of industries worldwide are estimated to aid demand.

Rising penetration of legal services for effective contract review and document analysis is anticipated to push growth of optical character recognition (OCR) systems. They are integrating chatbots to improve customer service and extract data.

A few other companies are collaborating with renowned mobile app developers to create OCR-enabled mobile applications. They are also broadening their production lines for rapid production documentation and maintenance.

Growing demand for cloud-based OCR solutions and use of OCR in healthcare & legal services are creating new opportunities for companies. Integration of OCR with robotic process automation (RPA) to allow for more efficient operations.

OCR integration with robotic process automation (RPA) to allow for more efficient operations is gaining impetus. It is also being integrated with augmented reality and virtual reality technologies. In addition, high demand for IoT devices for real-time data processing and analysis is pushing the global market.

However, the high development costs of OCR systems are set to act as a hindrance to market growth. Complexity in handling layouts, fonts, and languages can also create challenges for leading firms.

Increasing data accuracy and privacy concerns amid growing cases of cyberattacks are compelling companies to reconfigure the features of their solutions. They are focusing on mitigating security risks associated with sensitive data processing. Also, a lack of technical knowledge to operate document scanning software solutions would act as another challenge.

Comparison of Demand Trends 2020 to 2025 vs Forecast Outlook 2025 to 2035

From 2020 to 2025, the optical character recognition market experienced a CAGR of 9.5%, reaching a size of USD 9,391.34 million in 2025. It is projected to attain a value of USD 39,733.4 million by 2035.

Historical CAGR (2020 to 2025) 9.5%
Historical Valuation (2025) USD 9,391.34 million

From 2020 to 2025, digitization initiatives increased in sectors such as healthcare, finance, and government. These further LED to a high need to extract and process data more efficiently. Also, increasing automation of document management pushed sales in the text recognition market.

Factors such as the adoption of cloud-based OCR solutions for scalability and accessibility and integration of OCR with AI and ML technologies augmented the market. These helped to improve accuracy and spur demand for simplified data management & compliance.

Future Forecast for Optical Character Recognition Market

Looking ahead, the optical character recognition industry is expected to rise at a CAGR of 14.8% from 2025 to 2035. The forecast period is anticipated to show accelerated growth pushed by the integration of OCR with other technologies, such as natural language processing (NLP) and robotic process automation (RPA).

The market is anticipated to witness innovation in areas such as real-time OCR, improved accuracy, and multilingual support. These are set to cater to a wide range of industries, including healthcare, finance, law, and government.

Semi-annual Market Update

Particular Value CAGR
H1 13.7% (2025 to 2035)
H2 13.2% (2025 to 2035)
H1 14.2% (2025 to 2035)
H2 14.6% (2025 to 2035)

Analysis of Top Countries Adopting Optical Character Recognition Solutions

The section below showcases the CAGRs and values of the significant countries present in the optical character recognition market. By scrutinizing themes from qualitative data of the market, the United States and China emerge as hot topics.

Countries Value-based CAGR (2025 to 2035)
United States 15.1%
China 14.8%

Healthcare Firms in the United States Fuel Demand

The United States optical character recognition market is set to hold a share of 79.2%, equating to about USD 29,013 million by 2035. It is anticipated to rise at a CAGR of 15.1% through 2035.

The United States has a mature optical character recognition (OCR) industry. It is attributed to the high demand from sectors such as banking, healthcare, law, and government.

In the banking industry, OCR technology supports processes by automating data processing, improving data accuracy, and enhancing efficiency. Healthcare organizations are using OCR technology to digitize patient information, streamline workflows, and ensure compliance. It is set to be a leading OCR system market trend.

Law firms rely on OCR to efficiently digitize legal documents and process contracts. and capture cases. Additionally, government agencies use OCR to organize public records digitally, improve data management, and refine public services. Strong demand across multiple industries reinforces the country’s position as a key consumer of OCR solutions.

Investments in AI across China Push Sales

China’s optical character recognition market is projected to rise at a CAGR of 14.8% during the forecast period. The country is anticipated to be valued at USD 3,270.25 million by 2035.

Growth is mainly attributed to significantly increasing investments in AI and related technologies. Booming technology industry in emerging areas of China is particularly promoting the adoption of solutions with OCR capabilities.

China’s optical character recognition (OCR) market is growing rapidly pushed by high adoption in key sectors such as e-commerce, banking, and logistics. Similarly, logistics companies benefit from OCR’s ability to streamline fleet tracking systems, reduce errors, and increase supply chain visibility.

Optical Character Recognition Industry Analysis by Top Investment Segments

The section below showcases the top segments in the global optical character recognition market, including component, end-use, and industry vertical. The software segment in terms of components is set to rise at 16.3% CAGR through 2035. Based on end-use, the B2B segment is projected to witness a CAGR of 15.9% through 2035. Analysis of OCR technology industry is set to enable potential clients to invest in the ideal segment.

Market Growth Outlook by Component

Component Value CAGR (2025 to 2035)
Software 16.3%
Services 10.6%

Software Solutions to Gain Traction

Growing need to digitize and reduce the dependence on physical documents to save cost, energy, and time has aided development of the software segment. Integrating OCR software with robotic process automation (RPA) and enterprise content management (ECM) systems increases its value proposition.

Integration makes it a top choice for organizations looking to optimize workflows and boost productivity. Due to these factors, the software segment held a dominant market share of 55.4% in 2025.

B2B Companies to Seek Advanced Solutions

Market Growth Outlook by End-use

End-use Value CAGR (2025 to 2035)
B2B 15.9%
B2C 6.0%

Companies are increasingly digitizing their operations. It is propelling demand for OCR solutions to efficiently manage and process large amounts of documents & data.

B2B companies tend to consume multiple complex data processes, such as payments, contracts, and documentation, to improve efficiencies. B2B organizations often have high budgets. Hence, they focus on process efficiencies and manual errors that can be significantly reduced with advanced OCR solutions.

Such solutions feature machine learning and natural language processing. These allow the B2B segment to rise at a CAGR of 15.9% over the forecast period.

BFSI Industry

Market Growth Outlook by Industry Vertical

Industry Vertical Value CAGR (2025 to 2035)
Banking, Financial Services, and Insurance (BFSI) 16.4%
Healthcare 6.3%
IT & Telecom 5.1%
Retail 6.6%
Government and Public Sector 5.2%
Education 5.2%
Transportation & Logistics 7.1%
Media & Entertainment 6.9%
Hospitality 4.1%
Others (Manufacturing, Construction) 6.6%

Growth in the BFSI industry is attributed to increasing use of OCR for automating time-consuming tasks and optimizing performance. It would also be utilized for data entry and credit card & document scanning to transform the data into a computerized format.

As the BFSI industry is heavily regulated, complying with stringent document management and data security requirements becomes mandatory. OCR solutions provide advanced capabilities such as data encryption, editing, and audit trails. These are essential to ensure compliance and data security. The segment is projected to rise at a CAGR of 16.4% over the forecast period.

Competitive Landscape of the OCR Software Market

Optical Character Recognition Market Analysis By Company

Key players are focusing on providing customized optical character recognition solutions to meet the specific needs of their clients. They establish extensive agreements and connections with stakeholders to offer high-speed, low-latency connectivity to their customers.

Companies are investing in research & development to discover sophisticated solutions that deliver improved performance, security, and scalability. Strategic partnerships and collaborations are essential in the OCR market.

Key Developments in the Field of Optical Character Recognition

  • In February 2025, GlobalVision introduced a new feature in Verify, its unique proofreading software solution. The company launched an OCR feature based on AI. It would help users change the proofreading and compliance landscape.
  • In October 2025, a software-as-a-service (SaaS) platform called DGTAL launched GRABBER, its latest intelligent document processing tool. It validates, extracts, and understands data from order forms, invoices, quotes, utility bills, and bank statements.
  • In May 2025, Xiao-I Corporation introduced its new Intelligent Document Processing solution. It is underpinned by OCR, ML, and computer vision. It helps organize and capture information from documents.

Leading Players in the Optical Character Recognition Software Industry

  • Adobe Inc.
  • ABBYY
  • IBM Corporation
  • Microsoft Corporation
  • Google LLC
  • Anyline GmbH
  • CVISION Technologies Inc.
  • Nuance Communications, Inc.
  • Open Text Corporation
  • Captricity
  • ATAPY Software

Coverage of the Optical Character Recognition Market Report

  • OCR Systems Market Trends, Forecast, and Analysis
  • Text Capture and Optical Character Recognition Market Share
  • Optical Character Recognition (OCR) Systems Market Growth Outlook
  • Asia-Pacific Optical Character Recognition Market Analysis
  • OCR Scanning Software Market
  • Market Dynamics of Text Recognition
  • Emerging Trends in Intelligent Character Recognition
  • Top OCR Products Available in the Market
  • Global AI-Based OCR Vision System Market
  • Analysis of Factors Pushing Sales of Optical Character Recognition Solutions
  • How OCR Adds Value to Organizations
  • Impact of Machine Vision OCR
  • Optical Character Recognition Technology for Business Owners

Top Segments Studied in the Optical Character Recognition Market Report

By Component:

  • Software
    • Desktop-based OCR
    • Mobile-based OCR
    • Cloud-based OCR
  • Services
    • Consulting Services
    • Implementation and Integration
    • Outsourcing

By End-use:

  • B2B
  • B2C

By Industry Vertical:

  • Banking, Financial Services, and Insurance (BFSI)
  • Healthcare
  • IT & Telecom
  • Retail
  • Government and Public Sector
  • Education
  • Transportation & Logistics
  • Media & Entertainment
  • Hospitality
  • Others (Manufacturing, Construction)

By Region:

  • North America
  • Latin America
  • South Asia & Pacific
  • East Asia
  • Western Europe
  • Eastern Europe
  • Middle East and Africa

Frequently Asked Questions

How big is the optical character recognition market in 2025?

The global optical character recognition market is estimated to be valued at USD 16.3 billion in 2025.

What will be the size of optical character recognition market in 2035?

The market size for the optical character recognition market is projected to reach USD 60.7 billion by 2035.

How much will be the optical character recognition market growth between 2025 and 2035?

The optical character recognition market is expected to grow at a 14.1% CAGR between 2025 and 2035.

What are the key product types in the optical character recognition market?

The key product types in optical character recognition market are software, _desktop-based ocr, _mobile-based ocr, _cloud-based ocr, services, _consulting services, _implementation and integration and _outsourcing.

Which end-use segment to contribute significant share in the optical character recognition market in 2025?

In terms of end-use, b2b segment to command 55.7% share in the optical character recognition market in 2025.

Table of Content

  1. Executive Summary
    • Global Market Outlook
    • Demand-side Trends
    • Supply-side Trends
    • Technology Roadmap Analysis
    • Analysis and Recommendations
  2. Market Overview
    • Market Coverage / Taxonomy
    • Market Definition / Scope / Limitations
  3. Market Background
    • Market Dynamics
      • Drivers
      • Restraints
      • Opportunity
      • Trends
    • Scenario Forecast
      • Demand in Optimistic Scenario
      • Demand in Likely Scenario
      • Demand in Conservative Scenario
    • Opportunity Map Analysis
    • Product Life Cycle Analysis
    • Supply Chain Analysis
    • Investment Feasibility Matrix
    • Value Chain Analysis
    • PESTLE and Porter’s Analysis
    • Regulatory Landscape
    • Regional Parent Market Outlook
    • Production and Consumption Statistics
    • Import and Export Statistics
  4. Global Market Analysis 2020 to 2024 and Forecast, 2025 to 2035
    • Historical Market Size Value (USD Million) Analysis, 2020 to 2024
    • Current and Future Market Size Value (USD Million) Projections, 2025 to 2035
      • Y-o-Y Growth Trend Analysis
      • Absolute $ Opportunity Analysis
  5. Global Market Pricing Analysis 2020 to 2024 and Forecast 2025 to 2035
  6. Global Market Analysis 2020 to 2024 and Forecast 2025 to 2035, By Component
    • Introduction / Key Findings
    • Historical Market Size Value (USD Million) Analysis By Component , 2020 to 2024
    • Current and Future Market Size Value (USD Million) Analysis and Forecast By Component , 2025 to 2035
      • Software
        • Desktop-Based OCR
        • Mobile-Based OCR
        • Cloud-Based OCR
      • Services
        • Consulting Services
        • Implementation And Integration
        • Outsourcing
    • Y-o-Y Growth Trend Analysis By Component , 2020 to 2024
    • Absolute $ Opportunity Analysis By Component , 2025 to 2035
  7. Global Market Analysis 2020 to 2024 and Forecast 2025 to 2035, By End-Use
    • Introduction / Key Findings
    • Historical Market Size Value (USD Million) Analysis By End-Use, 2020 to 2024
    • Current and Future Market Size Value (USD Million) Analysis and Forecast By End-Use, 2025 to 2035
      • B2B
      • B2C
    • Y-o-Y Growth Trend Analysis By End-Use, 2020 to 2024
    • Absolute $ Opportunity Analysis By End-Use, 2025 to 2035
  8. Global Market Analysis 2020 to 2024 and Forecast 2025 to 2035, By Industry Vertical
    • Introduction / Key Findings
    • Historical Market Size Value (USD Million) Analysis By Industry Vertical, 2020 to 2024
    • Current and Future Market Size Value (USD Million) Analysis and Forecast By Industry Vertical, 2025 to 2035
      • Banking, Financial Services, And Insurance (BFSI)
      • Healthcare
      • IT & Telecom
      • Retail
      • Government And Public Sector
      • Education
      • Transportation & Logistics
      • Media & Entertainment
      • Hospitality
      • Others (Manufacturing, Construction)
    • Y-o-Y Growth Trend Analysis By Industry Vertical, 2020 to 2024
    • Absolute $ Opportunity Analysis By Industry Vertical, 2025 to 2035
  9. Global Market Analysis 2020 to 2024 and Forecast 2025 to 2035, By Region
    • Introduction
    • Historical Market Size Value (USD Million) Analysis By Region, 2020 to 2024
    • Current Market Size Value (USD Million) Analysis and Forecast By Region, 2025 to 2035
      • North America
      • Latin America
      • Western Europe
      • Eastern Europe
      • East Asia
      • South Asia and Pacific
      • Middle East & Africa
    • Market Attractiveness Analysis By Region
  10. North America Market Analysis 2020 to 2024 and Forecast 2025 to 2035, By Country
    • Historical Market Size Value (USD Million) Trend Analysis By Market Taxonomy, 2020 to 2024
    • Market Size Value (USD Million) Forecast By Market Taxonomy, 2025 to 2035
      • By Country
        • USA
        • Canada
        • Mexico
      • By Component
      • By End-Use
      • By Industry Vertical
    • Market Attractiveness Analysis
      • By Country
      • By Component
      • By End-Use
      • By Industry Vertical
    • Key Takeaways
  11. Latin America Market Analysis 2020 to 2024 and Forecast 2025 to 2035, By Country
    • Historical Market Size Value (USD Million) Trend Analysis By Market Taxonomy, 2020 to 2024
    • Market Size Value (USD Million) Forecast By Market Taxonomy, 2025 to 2035
      • By Country
        • Brazil
        • Chile
        • Rest of Latin America
      • By Component
      • By End-Use
      • By Industry Vertical
    • Market Attractiveness Analysis
      • By Country
      • By Component
      • By End-Use
      • By Industry Vertical
    • Key Takeaways
  12. Western Europe Market Analysis 2020 to 2024 and Forecast 2025 to 2035, By Country
    • Historical Market Size Value (USD Million) Trend Analysis By Market Taxonomy, 2020 to 2024
    • Market Size Value (USD Million) Forecast By Market Taxonomy, 2025 to 2035
      • By Country
        • Germany
        • UK
        • Italy
        • Spain
        • France
        • Nordic
        • BENELUX
        • Rest of Western Europe
      • By Component
      • By End-Use
      • By Industry Vertical
    • Market Attractiveness Analysis
      • By Country
      • By Component
      • By End-Use
      • By Industry Vertical
    • Key Takeaways
  13. Eastern Europe Market Analysis 2020 to 2024 and Forecast 2025 to 2035, By Country
    • Historical Market Size Value (USD Million) Trend Analysis By Market Taxonomy, 2020 to 2024
    • Market Size Value (USD Million) Forecast By Market Taxonomy, 2025 to 2035
      • By Country
        • Russia
        • Poland
        • Hungary
        • Balkan & Baltic
        • Rest of Eastern Europe
      • By Component
      • By End-Use
      • By Industry Vertical
    • Market Attractiveness Analysis
      • By Country
      • By Component
      • By End-Use
      • By Industry Vertical
    • Key Takeaways
  14. East Asia Market Analysis 2020 to 2024 and Forecast 2025 to 2035, By Country
    • Historical Market Size Value (USD Million) Trend Analysis By Market Taxonomy, 2020 to 2024
    • Market Size Value (USD Million) Forecast By Market Taxonomy, 2025 to 2035
      • By Country
        • China
        • Japan
        • South Korea
      • By Component
      • By End-Use
      • By Industry Vertical
    • Market Attractiveness Analysis
      • By Country
      • By Component
      • By End-Use
      • By Industry Vertical
    • Key Takeaways
  15. South Asia and Pacific Market Analysis 2020 to 2024 and Forecast 2025 to 2035, By Country
    • Historical Market Size Value (USD Million) Trend Analysis By Market Taxonomy, 2020 to 2024
    • Market Size Value (USD Million) Forecast By Market Taxonomy, 2025 to 2035
      • By Country
        • India
        • ASEAN
        • Australia & New Zealand
        • Rest of South Asia and Pacific
      • By Component
      • By End-Use
      • By Industry Vertical
    • Market Attractiveness Analysis
      • By Country
      • By Component
      • By End-Use
      • By Industry Vertical
    • Key Takeaways
  16. Middle East & Africa Market Analysis 2020 to 2024 and Forecast 2025 to 2035, By Country
    • Historical Market Size Value (USD Million) Trend Analysis By Market Taxonomy, 2020 to 2024
    • Market Size Value (USD Million) Forecast By Market Taxonomy, 2025 to 2035
      • By Country
        • Kingdom of Saudi Arabia
        • Other GCC Countries
        • Turkiye
        • South Africa
        • Other African Union
        • Rest of Middle East & Africa
      • By Component
      • By End-Use
      • By Industry Vertical
    • Market Attractiveness Analysis
      • By Country
      • By Component
      • By End-Use
      • By Industry Vertical
    • Key Takeaways
  17. Key Countries Market Analysis
    • USA
      • Pricing Analysis
      • Market Share Analysis, 2024
        • By Component
        • By End-Use
        • By Industry Vertical
    • Canada
      • Pricing Analysis
      • Market Share Analysis, 2024
        • By Component
        • By End-Use
        • By Industry Vertical
    • Mexico
      • Pricing Analysis
      • Market Share Analysis, 2024
        • By Component
        • By End-Use
        • By Industry Vertical
    • Brazil
      • Pricing Analysis
      • Market Share Analysis, 2024
        • By Component
        • By End-Use
        • By Industry Vertical
    • Chile
      • Pricing Analysis
      • Market Share Analysis, 2024
        • By Component
        • By End-Use
        • By Industry Vertical
    • Germany
      • Pricing Analysis
      • Market Share Analysis, 2024
        • By Component
        • By End-Use
        • By Industry Vertical
    • UK
      • Pricing Analysis
      • Market Share Analysis, 2024
        • By Component
        • By End-Use
        • By Industry Vertical
    • Italy
      • Pricing Analysis
      • Market Share Analysis, 2024
        • By Component
        • By End-Use
        • By Industry Vertical
    • Spain
      • Pricing Analysis
      • Market Share Analysis, 2024
        • By Component
        • By End-Use
        • By Industry Vertical
    • France
      • Pricing Analysis
      • Market Share Analysis, 2024
        • By Component
        • By End-Use
        • By Industry Vertical
    • India
      • Pricing Analysis
      • Market Share Analysis, 2024
        • By Component
        • By End-Use
        • By Industry Vertical
    • ASEAN
      • Pricing Analysis
      • Market Share Analysis, 2024
        • By Component
        • By End-Use
        • By Industry Vertical
    • Australia & New Zealand
      • Pricing Analysis
      • Market Share Analysis, 2024
        • By Component
        • By End-Use
        • By Industry Vertical
    • China
      • Pricing Analysis
      • Market Share Analysis, 2024
        • By Component
        • By End-Use
        • By Industry Vertical
    • Japan
      • Pricing Analysis
      • Market Share Analysis, 2024
        • By Component
        • By End-Use
        • By Industry Vertical
    • South Korea
      • Pricing Analysis
      • Market Share Analysis, 2024
        • By Component
        • By End-Use
        • By Industry Vertical
    • Russia
      • Pricing Analysis
      • Market Share Analysis, 2024
        • By Component
        • By End-Use
        • By Industry Vertical
    • Poland
      • Pricing Analysis
      • Market Share Analysis, 2024
        • By Component
        • By End-Use
        • By Industry Vertical
    • Hungary
      • Pricing Analysis
      • Market Share Analysis, 2024
        • By Component
        • By End-Use
        • By Industry Vertical
    • Kingdom of Saudi Arabia
      • Pricing Analysis
      • Market Share Analysis, 2024
        • By Component
        • By End-Use
        • By Industry Vertical
    • Turkiye
      • Pricing Analysis
      • Market Share Analysis, 2024
        • By Component
        • By End-Use
        • By Industry Vertical
    • South Africa
      • Pricing Analysis
      • Market Share Analysis, 2024
        • By Component
        • By End-Use
        • By Industry Vertical
  18. Market Structure Analysis
    • Competition Dashboard
    • Competition Benchmarking
    • Market Share Analysis of Top Players
      • By Regional
      • By Component
      • By End-Use
      • By Industry Vertical
  19. Competition Analysis
    • Competition Deep Dive
      • Adobe Inc.
        • Overview
        • Product Portfolio
        • Profitability by Market Segments (Product/Age /Sales Channel/Region)
        • Sales Footprint
        • Strategy Overview
          • Marketing Strategy
          • Product Strategy
          • Channel Strategy
      • Microsoft Corporation
      • Google LLC
      • IBM Corporation
      • Nuance Communications, Inc.
      • ABBYY
      • Open Text Corporation
      • CVISION Technologies Inc.
      • Anyline GmbH
      • Captricity
      • ATAPY Software
  20. Assumptions & Acronyms Used
  21. Research Methodology

List of Tables

  • Table 1: Global Market Value (USD Million) Forecast by Region, 2020-2035
  • Table 2: Global Market Value (USD Million) Forecast by Component , 2020-2035
  • Table 3: Global Market Value (USD Million) Forecast by End-Use, 2020-2035
  • Table 4: Global Market Value (USD Million) Forecast by Industry Vertical, 2020-2035
  • Table 5: North America Market Value (USD Million) Forecast by Country, 2020-2035
  • Table 6: North America Market Value (USD Million) Forecast by Component , 2020-2035
  • Table 7: North America Market Value (USD Million) Forecast by End-Use, 2020-2035
  • Table 8: North America Market Value (USD Million) Forecast by Industry Vertical, 2020-2035
  • Table 9: Latin America Market Value (USD Million) Forecast by Country, 2020-2035
  • Table 10: Latin America Market Value (USD Million) Forecast by Component , 2020-2035
  • Table 11: Latin America Market Value (USD Million) Forecast by End-Use, 2020-2035
  • Table 12: Latin America Market Value (USD Million) Forecast by Industry Vertical, 2020-2035
  • Table 13: Western Europe Market Value (USD Million) Forecast by Country, 2020-2035
  • Table 14: Western Europe Market Value (USD Million) Forecast by Component , 2020-2035
  • Table 15: Western Europe Market Value (USD Million) Forecast by End-Use, 2020-2035
  • Table 16: Western Europe Market Value (USD Million) Forecast by Industry Vertical, 2020-2035
  • Table 17: Eastern Europe Market Value (USD Million) Forecast by Country, 2020-2035
  • Table 18: Eastern Europe Market Value (USD Million) Forecast by Component , 2020-2035
  • Table 19: Eastern Europe Market Value (USD Million) Forecast by End-Use, 2020-2035
  • Table 20: Eastern Europe Market Value (USD Million) Forecast by Industry Vertical, 2020-2035
  • Table 21: East Asia Market Value (USD Million) Forecast by Country, 2020-2035
  • Table 22: East Asia Market Value (USD Million) Forecast by Component , 2020-2035
  • Table 23: East Asia Market Value (USD Million) Forecast by End-Use, 2020-2035
  • Table 24: East Asia Market Value (USD Million) Forecast by Industry Vertical, 2020-2035
  • Table 25: South Asia and Pacific Market Value (USD Million) Forecast by Country, 2020-2035
  • Table 26: South Asia and Pacific Market Value (USD Million) Forecast by Component , 2020-2035
  • Table 27: South Asia and Pacific Market Value (USD Million) Forecast by End-Use, 2020-2035
  • Table 28: South Asia and Pacific Market Value (USD Million) Forecast by Industry Vertical, 2020-2035
  • Table 29: Middle East & Africa Market Value (USD Million) Forecast by Country, 2020-2035
  • Table 30: Middle East & Africa Market Value (USD Million) Forecast by Component , 2020-2035
  • Table 31: Middle East & Africa Market Value (USD Million) Forecast by End-Use, 2020-2035
  • Table 32: Middle East & Africa Market Value (USD Million) Forecast by Industry Vertical, 2020-2035

List of Figures

  • Figure 1: Global Market Pricing Analysis
  • Figure 2: Global Market Value (USD Million) Forecast 2020-2035
  • Figure 3: Global Market Value Share and BPS Analysis by Component , 2025 and 2035
  • Figure 4: Global Market Y-o-Y Growth Comparison by Component , 2025-2035
  • Figure 5: Global Market Attractiveness Analysis by Component
  • Figure 6: Global Market Value Share and BPS Analysis by End-Use, 2025 and 2035
  • Figure 7: Global Market Y-o-Y Growth Comparison by End-Use, 2025-2035
  • Figure 8: Global Market Attractiveness Analysis by End-Use
  • Figure 9: Global Market Value Share and BPS Analysis by Industry Vertical, 2025 and 2035
  • Figure 10: Global Market Y-o-Y Growth Comparison by Industry Vertical, 2025-2035
  • Figure 11: Global Market Attractiveness Analysis by Industry Vertical
  • Figure 12: Global Market Value (USD Million) Share and BPS Analysis by Region, 2025 and 2035
  • Figure 13: Global Market Y-o-Y Growth Comparison by Region, 2025-2035
  • Figure 14: Global Market Attractiveness Analysis by Region
  • Figure 15: North America Market Incremental Dollar Opportunity, 2025-2035
  • Figure 16: Latin America Market Incremental Dollar Opportunity, 2025-2035
  • Figure 17: Western Europe Market Incremental Dollar Opportunity, 2025-2035
  • Figure 18: Eastern Europe Market Incremental Dollar Opportunity, 2025-2035
  • Figure 19: East Asia Market Incremental Dollar Opportunity, 2025-2035
  • Figure 20: South Asia and Pacific Market Incremental Dollar Opportunity, 2025-2035
  • Figure 21: Middle East & Africa Market Incremental Dollar Opportunity, 2025-2035
  • Figure 22: North America Market Value Share and BPS Analysis by Country, 2025 and 2035
  • Figure 23: North America Market Value Share and BPS Analysis by Component , 2025 and 2035
  • Figure 24: North America Market Y-o-Y Growth Comparison by Component , 2025-2035
  • Figure 25: North America Market Attractiveness Analysis by Component
  • Figure 26: North America Market Value Share and BPS Analysis by End-Use, 2025 and 2035
  • Figure 27: North America Market Y-o-Y Growth Comparison by End-Use, 2025-2035
  • Figure 28: North America Market Attractiveness Analysis by End-Use
  • Figure 29: North America Market Value Share and BPS Analysis by Industry Vertical, 2025 and 2035
  • Figure 30: North America Market Y-o-Y Growth Comparison by Industry Vertical, 2025-2035
  • Figure 31: North America Market Attractiveness Analysis by Industry Vertical
  • Figure 32: Latin America Market Value Share and BPS Analysis by Country, 2025 and 2035
  • Figure 33: Latin America Market Value Share and BPS Analysis by Component , 2025 and 2035
  • Figure 34: Latin America Market Y-o-Y Growth Comparison by Component , 2025-2035
  • Figure 35: Latin America Market Attractiveness Analysis by Component
  • Figure 36: Latin America Market Value Share and BPS Analysis by End-Use, 2025 and 2035
  • Figure 37: Latin America Market Y-o-Y Growth Comparison by End-Use, 2025-2035
  • Figure 38: Latin America Market Attractiveness Analysis by End-Use
  • Figure 39: Latin America Market Value Share and BPS Analysis by Industry Vertical, 2025 and 2035
  • Figure 40: Latin America Market Y-o-Y Growth Comparison by Industry Vertical, 2025-2035
  • Figure 41: Latin America Market Attractiveness Analysis by Industry Vertical
  • Figure 42: Western Europe Market Value Share and BPS Analysis by Country, 2025 and 2035
  • Figure 43: Western Europe Market Value Share and BPS Analysis by Component , 2025 and 2035
  • Figure 44: Western Europe Market Y-o-Y Growth Comparison by Component , 2025-2035
  • Figure 45: Western Europe Market Attractiveness Analysis by Component
  • Figure 46: Western Europe Market Value Share and BPS Analysis by End-Use, 2025 and 2035
  • Figure 47: Western Europe Market Y-o-Y Growth Comparison by End-Use, 2025-2035
  • Figure 48: Western Europe Market Attractiveness Analysis by End-Use
  • Figure 49: Western Europe Market Value Share and BPS Analysis by Industry Vertical, 2025 and 2035
  • Figure 50: Western Europe Market Y-o-Y Growth Comparison by Industry Vertical, 2025-2035
  • Figure 51: Western Europe Market Attractiveness Analysis by Industry Vertical
  • Figure 52: Eastern Europe Market Value Share and BPS Analysis by Country, 2025 and 2035
  • Figure 53: Eastern Europe Market Value Share and BPS Analysis by Component , 2025 and 2035
  • Figure 54: Eastern Europe Market Y-o-Y Growth Comparison by Component , 2025-2035
  • Figure 55: Eastern Europe Market Attractiveness Analysis by Component
  • Figure 56: Eastern Europe Market Value Share and BPS Analysis by End-Use, 2025 and 2035
  • Figure 57: Eastern Europe Market Y-o-Y Growth Comparison by End-Use, 2025-2035
  • Figure 58: Eastern Europe Market Attractiveness Analysis by End-Use
  • Figure 59: Eastern Europe Market Value Share and BPS Analysis by Industry Vertical, 2025 and 2035
  • Figure 60: Eastern Europe Market Y-o-Y Growth Comparison by Industry Vertical, 2025-2035
  • Figure 61: Eastern Europe Market Attractiveness Analysis by Industry Vertical
  • Figure 62: East Asia Market Value Share and BPS Analysis by Country, 2025 and 2035
  • Figure 63: East Asia Market Value Share and BPS Analysis by Component , 2025 and 2035
  • Figure 64: East Asia Market Y-o-Y Growth Comparison by Component , 2025-2035
  • Figure 65: East Asia Market Attractiveness Analysis by Component
  • Figure 66: East Asia Market Value Share and BPS Analysis by End-Use, 2025 and 2035
  • Figure 67: East Asia Market Y-o-Y Growth Comparison by End-Use, 2025-2035
  • Figure 68: East Asia Market Attractiveness Analysis by End-Use
  • Figure 69: East Asia Market Value Share and BPS Analysis by Industry Vertical, 2025 and 2035
  • Figure 70: East Asia Market Y-o-Y Growth Comparison by Industry Vertical, 2025-2035
  • Figure 71: East Asia Market Attractiveness Analysis by Industry Vertical
  • Figure 72: South Asia and Pacific Market Value Share and BPS Analysis by Country, 2025 and 2035
  • Figure 73: South Asia and Pacific Market Value Share and BPS Analysis by Component , 2025 and 2035
  • Figure 74: South Asia and Pacific Market Y-o-Y Growth Comparison by Component , 2025-2035
  • Figure 75: South Asia and Pacific Market Attractiveness Analysis by Component
  • Figure 76: South Asia and Pacific Market Value Share and BPS Analysis by End-Use, 2025 and 2035
  • Figure 77: South Asia and Pacific Market Y-o-Y Growth Comparison by End-Use, 2025-2035
  • Figure 78: South Asia and Pacific Market Attractiveness Analysis by End-Use
  • Figure 79: South Asia and Pacific Market Value Share and BPS Analysis by Industry Vertical, 2025 and 2035
  • Figure 80: South Asia and Pacific Market Y-o-Y Growth Comparison by Industry Vertical, 2025-2035
  • Figure 81: South Asia and Pacific Market Attractiveness Analysis by Industry Vertical
  • Figure 82: Middle East & Africa Market Value Share and BPS Analysis by Country, 2025 and 2035
  • Figure 83: Middle East & Africa Market Value Share and BPS Analysis by Component , 2025 and 2035
  • Figure 84: Middle East & Africa Market Y-o-Y Growth Comparison by Component , 2025-2035
  • Figure 85: Middle East & Africa Market Attractiveness Analysis by Component
  • Figure 86: Middle East & Africa Market Value Share and BPS Analysis by End-Use, 2025 and 2035
  • Figure 87: Middle East & Africa Market Y-o-Y Growth Comparison by End-Use, 2025-2035
  • Figure 88: Middle East & Africa Market Attractiveness Analysis by End-Use
  • Figure 89: Middle East & Africa Market Value Share and BPS Analysis by Industry Vertical, 2025 and 2035
  • Figure 90: Middle East & Africa Market Y-o-Y Growth Comparison by Industry Vertical, 2025-2035
  • Figure 91: Middle East & Africa Market Attractiveness Analysis by Industry Vertical
  • Figure 92: Global Market - Tier Structure Analysis
  • Figure 93: Global Market - Company Share Analysis
Dashboard
Dashboard
Dashboard
Dashboard
Dashboard
Dashboard

Full Research Suite comprises of:

Market outlook & trends analysis

Market outlook & trends analysis

Interviews & case studies

Interviews & case studies

Strategic recommendations

Strategic recommendations

Vendor profiles & capabilities analysis

Vendor profiles & capabilities analysis

5-year forecasts

5-year forecasts

8 regions and 60+ country-level data splits

8 regions and 60+ country-level data splits

Market segment data splits

Market segment data splits

12 months of continuous data updates

12 months of continuous data updates

DELIVERED AS:

PDF EXCEL ONLINE

Full Research Suite


$5000

$7500

$10000

Buy Report Now
Similar Industry Reports

Similar Industry Reports

Optical Spectrum Analyzer Market

Optical Spectrum Analyzer Market Size and Share Forecast Outlook 2025 to 2035

Optical Extinction Analyzer Market

Optical Extinction Analyzer Market Size and Share Forecast Outlook 2025 to 2035

Optical Satellite Market

Optical Satellite Market Size and Share Forecast Outlook 2025 to 2035

Optical Imaging Market

Optical Imaging Market Size and Share Forecast Outlook 2025 to 2035

Optical Whitening Agents Market

Optical Whitening Agents Market Size and Share Forecast Outlook 2025 to 2035

Optical Fingerprint Collector Market

Optical Fingerprint Collector Market Size and Share Forecast Outlook 2025 to 2035

Optical Lens Materials Market

Optical Lens Materials Market Size and Share Forecast Outlook 2025 to 2035

Optical Microscope Market

Optical Microscope Market Size and Share Forecast Outlook 2025 to 2035

Optical Component Tester Market

Optical Component Tester Market Size and Share Forecast Outlook 2025 to 2035

Optical EMI Shielding Adapters Market

Optical EMI Shielding Adapters Market Size and Share Forecast Outlook 2025 to 2035

Optical Connector Polishing Films Market

Optical Connector Polishing Films Market Size and Share Forecast Outlook 2025 to 2035

Optical Transmitter Market

Optical Transmitter Market Size and Share Forecast Outlook 2025 to 2035

Optical Telephoto Lens Market

Optical Telephoto Lens Market Size and Share Forecast Outlook 2025 to 2035

Optical Lattice Clock Market

Optical Lattice Clock Market Size and Share Forecast Outlook 2025 to 2035

Optical Grade Lithium Tantalate Wafers Market

Optical Grade Lithium Tantalate Wafers Market Size and Share Forecast Outlook 2025 to 2035

Optical Grade LiTaO3 Crystal Substrate Market

Optical Grade LiTaO3 Crystal Substrate Market Size and Share Forecast Outlook 2025 to 2035

Optical Brighteners Market

Optical Brighteners Market Size and Share Forecast Outlook 2025 to 2035

Optical Liquid Level Sensor Market

Optical Liquid Level Sensor Market Size and Share Forecast Outlook 2025 to 2035

Optical Fiber Market

Optical Fiber Market Size and Share Forecast Outlook 2025 to 2035

Optical Communication and Networking Market

Optical Communication and Networking Market Size and Share Forecast Outlook 2025 to 2035

Future Market Insights

Optical Character Recognition Market

Chat With MaRIA

Chat With

MaRIA

Hi There, I am MaRIA, Your Market Research Intelligence Assistant. How may I help you?