Reports

- Global Locations -

Headquarters

Future Market Insights, Inc.

Christiana Corporate, 200
Continental Drive, Suite 401,
Newark, Delaware - 19713,
United States

T: +1-845-579-5705

Americas

Future Market Insights, Inc.

616 Corporate Way, Suite 2-9018,
Valley Cottage, NY 10989, United States

T: +1-347-918-3531

MEA

Future Market Insights

1602-6 Jumeirah Bay X2 Tower, Plot No: JLT-PH2-X2A,
Jumeirah Lakes Towers, Dubai,
United Arab Emirates

Europe

Future Market Insights

3rd Floor, 207 Regent Street,
W1B 3HH London
United Kingdom

T: + 44 (0) 20 8123 9659
D: +44 (0) 20 3287 4268

Asia Pacific

Future Market Insights

IndiaLand Global Tech Park, Unit UG-1, Behind Grand HighStreet, Phase 1, Hinjawadi, MH, Pune – 411057, India

Legal Services Market Outlook (2022 to 2032)

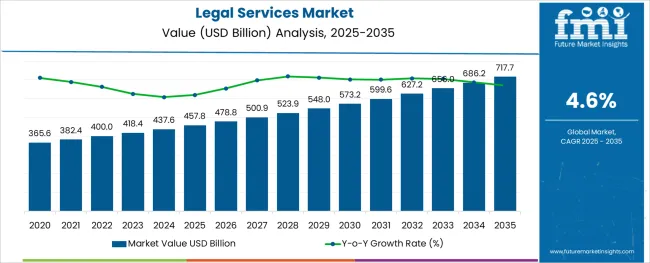
The global legal services industry is predicted to increase at a 4.6% CAGR during the forecast period from 2022 to 2032. The legal services market is estimated to garner a valuation of US$ 400 Billion by the end of 2022.

Development in the historical period was driven by significant economic growth in emerging nations, increasing mergers and acquisitions (M&A), higher consumer spending/more disposable income, and legal sector deregulation. Regulatory hurdles, skills shortages, and in-house legal teams raised pressure on traditional law firms, all of which hampered expansion over the historical period.

Rising demand for transactional practice areas, a developing legal IT industry, and globalization will fuel development in the future. Owing to this factor, the worldwide legal services market is anticipated to attain a value pool of US$ 627.12 Billion by the end of 2032. Rising prices and declining margins, a lack of transparency and consistent service quality, data security challenges and a reduction in free trade are all factors that might stymie future growth in the legal services business.

The rise of Artificial Intelligence has transformed the legal sector (AI). Artificial intelligence (AI)-enabled software has been critical in helping law firms and attorneys to save time. Document generation and review are more efficient when using automation technologies. Team collaboration tools may aid in further simplifying documentation methods. These technology innovations and discoveries benefit attorneys by cutting costs and increasing comfort.

Attributes Details
Legal Services Market CAGR (2022 to 2032) 4.6%
Legal Services Market (2032) US$ 627.12 Billion
Legal Services Market Attraction The trend toward digitalization and increased usage of cutting-edge technology are expected to boost the growth of the legal services industry during the forecast period.

Don't pay for what you don't need

Customize your report by selecting specific countries or regions and save 30%!

What are the Factors Driving Global Legal Services Market?

Digitization and Widespread use of Cutting-Edge Technology to Boost the Market

Legal firms are exploring digitization in order to expedite their procedures. Adoption of technology like artificial intelligence, cloud computing, machine learning, and big data analytics aids in quicker documentation, proofreading, and resource management. This results in cost savings and improved operational efficiency. These technologies can also match the rising demands of investors and clients by providing greater service delivery. Furthermore, growing legal regulations as well as heightened rivalry force businesses to invest in modern technology. Thus, increased digitalization and a trend toward automation are anticipated to drive the market of the legal services market throughout the forecast period.

Machine learning (ML) and artificial intelligence (AI) are advanced technologies that assist professionals in automating some activities and focusing their resources and time on critical legal tasks. These technologies enable organizations to design and assess contracts, as well as do document mining and due diligence. Big data analytics is also expected to increase at a rapid pace. This has fueled the emergence of businesses like FiscalNote, Ravel Law, and InvestCEE Tanacsado Kft., which supply their clients with high-quality, technologically enhanced analytical insights.

The legal services industry is likely to be driven by an increase in transactional practices during the forecast period. Transactional practice involves corporate, tax, and real estate work, as well as mergers and acquisitions investigation, preparation, and evaluation of papers for people and businesses. The multitude of mergers and acquisitions in several industries, including pharmaceutical, accounting, and technology, is expected to increase during the forecast period, owing to pharmaceutical companies seeking new possibilities to improve their product portfolios due to the patent expiration of popular drugs in 2023 to 2026.

One of the anticipated acquisitions is the purchase of Celgene, an American biotechnology company, by Bristol-Myers Squibb, a global biopharmaceutical company based in the United States, in order to create a leading biopharma company to address patients suffering from oncology, immunology, inflammation, and cardiovascular disease. Another significant transaction was Vista Equity Partners' $3.5 billion purchase of Pluralsight, an online training course provider. In Saudi Arabia, the predicted increase in M&A activity may be linked to government measures to diversify the Kingdom's economy and loosen laws governing foreign direct investment, which are backed by Vision 2030 economic reform. The legal services industry is likely to be driven by an increase in M&A activity across sectors and nations.

Legal Services Market

What are the Challenges of the Global Legal Services Market?

Rising Prices as well as Shrinking Margins Impede the Global Legal Services Market Growth

Economic development will result in salary rises as well as a shortage of trained employees in a skilled labor-intensive industry such as legal services. These rising input prices will put pressure on legal services businesses aiming to safeguard profits while maintaining service quality.

According to an Altmanweil poll conducted in 2017, about 95.4% of law firms said that price competitiveness was a significant trend influencing the legal services market and harming their profit margins. Rising legal service expenses are projected to limit the legal services market's expansion.

Sudip Saha
Sudip Saha

Principal Consultant

Talk to Analyst

Find your sweet spots for generating winning opportunities in this market.

What are the Emerging Opportunities in the Global Legal Services Market?

ALSPs are rapidly appearing in the legal business. They are essentially in the law industry and offer a variety of everyday legal services to businesses and law firms. ALSPs handle a wide range of responsibilities for businesses, including document review, litigation, contract life cycle management, compliance, and legal entity management.

This improves the efficiency of law firms by allocating resources more wisely, resulting in cost savings. ALSPs also employ technology to accelerate the value chain in legal services. Thus, over the projection period, ALSPs will generate profitable chances for the expansion of legal services.

Comparative View of Adjacent Global Legal Services Market

Global Legal Services Market:

Attributes Global Legal Services Market
CAGR (2022 to 2032) 4.6%
Market Value (2032) US$ 1.5 Trillion
Growth Factor With new fiscal transaction modes resulting in financial law claims on enterprises and people, the legal services market is expected to expand during the forecast period.
Opportunity The introduction of new technology and the rise of experienced attorneys are expected to drive the development trajectory of the legal services industry upward during the forecast period

Global Legal Process Outsourcing Market:

Attributes Global Legal Process Outsourcing Market
CAGR (2022 to 2032) 26.7%
Market Value (2032) US$ 150 Billion
Growth Factor The industry's expansion will most likely be driven by a high demand for expert legal advice at reasonable prices during the projected period.
Opportunity Over the next six years, cost savings, scalability, and flexibility provided by outsourcing legal services are anticipated to offer significant opportunities for market expansion.

Global Legal AI Software Market:

Attributes Global Legal AI Software Market
CAGR (2022 to 2032) 15.5%
Market Value (2032) US$ 3 Billion
Growth Factor The growing need for automation in applications such as eDiscovery, contract review and management, case prediction, and compliance is propelling the industry forward.
Opportunity Owing to the advancements and improvements in processing capacity in NLP, neural networks, and chips, the legal industry is seeing growing value in its application which is expected to provide significant opportunities for expansion in the market during the forecast period.

Get the data you need at a Fraction of the cost

Personalize your report by choosing insights you need
and save 40%!

What is the Segmentation Analysis of the Global Legal Services Market?

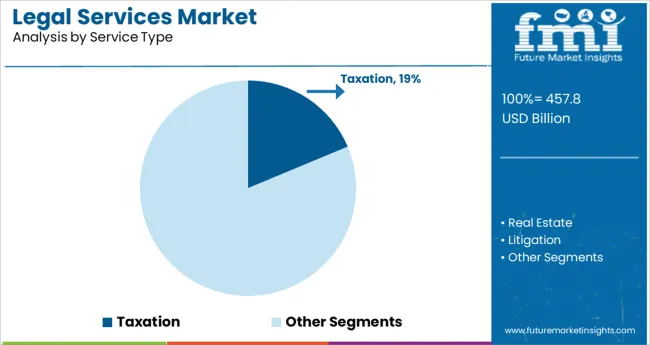
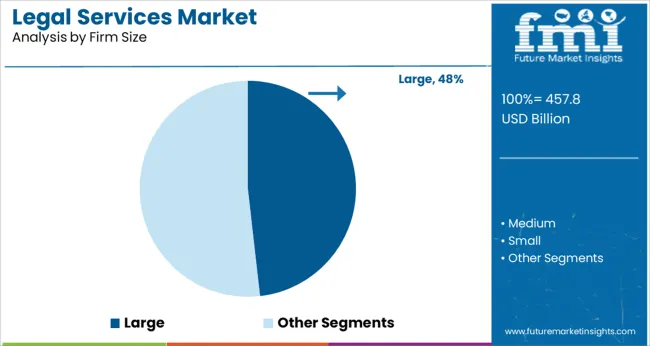
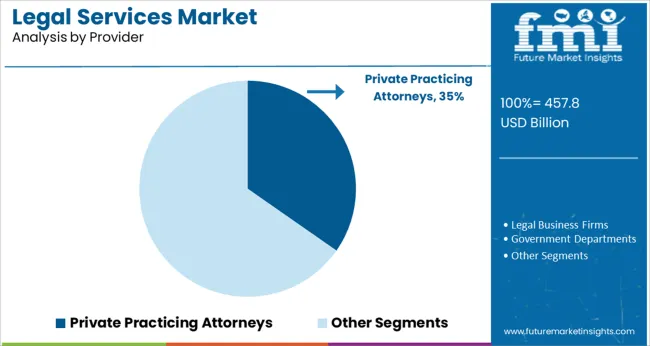
Based on services, the global legal services market can be segmented into taxation, real estate, litigation, bankruptcy, labor/employment, and corporate. Based on firm size, the worldwide legal services market can be segmented into large firms, medium firms, and small firms. Based on the provider, the international legal services market can be segmented into private practicing attorneys, legal business firms, government departments, and others.

As per the analysis, on the basis of service type, the corporate segment led the market in 2021, accounting for more than 25% of worldwide sales. This large percentage is due to the advent of new sorts of financial transactions on business fronts. Furthermore, the corporate category is forecasted to be the dominant service segment during the projection period from 2022 to 2032, as disputes over employee harassment, organizational discrimination audits, and copyright and patent infringement continue to soar. The amplifying demand for intellectual property-related services in the business sector is anticipated to drive the segment's expansion.

In 2021, the litigation segment had a significant revenue share as establishments continued to incur significant expenditures in their lawsuit management. Moreover, third-party legal finance and lawsuit funding service providers are gradually increasing their global capability and widening their jurisdiction range. This has opened up a plethora of prospects for litigation service providers. The implementation of severe labor relations and intellectual property (IP) protection legislation in both developed as well as in emerging nations has contributed to an increase in demand for litigation services.

On the other hand, by firm size, the big firm division led the market in 2021, accounting for more than 36% of worldwide sales. This substantial percentage can be due to large enterprises' diverse variety of services. For example, big firms handle the majority of judicial work, such as large-scale litigations, substantial corporate transactions, and criminal defense proceedings for companies in a variety of sectors. The amplifying demand for corporate and judicial services from big organizations is likely to boost the expansion of the large company category throughout the predicted period.

Similarly, medium- and small-sized legal services firms are expanding globally by recruiting attorneys and building offices overseas. These businesses generally target international clients to aid them in handling their legal needs. They are also broadening their worldwide consumer base by offering high-end specialist services involving complicated transactions. As a result, the medium-firm and small-firm categories are expected to maintain a significant revenue share during the forecast period.

Regional Analysis of the Legal Services Market

Geographically, North America led the market, accounting for more than 40% of worldwide legal service deployment. The United States has emerged as the market leader in North America. In 2020, increased assignment volumes among corporate legal departments in the United States can be linked to a high share of the North America area. Because of the enormous presence of legal service providers, the United States has emerged as one of the major countries in the North American area. Furthermore, increased acquisitions and mergers in the North American region are projected to increase demand for legal services.

Additionally, the rise of the European legal services market during the forecast period between 2022 and 2032 can be attributed to a significant number of law professionals providing legal services to customers in countries such as Spain. Aside from that, a large number of law firms in countries such as the United Kingdom and Germany are outsourcing their legal services to countries such as India and the Philippines in order to avoid incurring huge costs on legal services, which will propel market growth in the continent over the next decade.

On the other hand, due to the rapid adoption of regulatory and legal requirements, notably in China as well as India, Asia Pacific accounted for a substantial market share in 2020. For example, legal service providers in India have begun to offer sophisticated cross-border court services to their corporate clients, creating significant development potential for the nation. Service providers like Venable LLP, Baker & McKenzie, and Allen & Overy LLP have also joined the Indian market, which is projected to enhance the market growth in the area in the future years.

Countries CAGR (2022 to 2032)
United States of America 4.5%
United Kingdom 4.4%
China 4.3%
Japan 4.2%
India 4.3%

Which are the Most Significant Players in the Global Legal Services Market?

Market participants are focused on increasing their consumer base and gaining a competitive advantage over their competitors. They are carrying out a number of strategic activities, including collaborations, mergers and acquisitions, partnerships, and the creation of new products and technologies. Among the main participants in the global legal services industry are:

  • Baker & McKenzie
  • Clifford Chance LLP
  • Deloitte
  • DLA Piper
  • Ernst & Young (E&Y)
  • Kirkland & Ellis LLP
  • KPMG
  • LATHAM & WATKINS LLP
  • PwC
  • Skadden, Arps, Slate, Meagher & Flom LLP

Recent key developments among players are:

In November 2021, Clifford Chance LLP joined Green Map System, Inc., an independent non-profit organization to provide support and advice on the design and execution of the International Guarantee Trust Fund initiative to promote large-scale renewable energy installations.

  • In November 2021, EY announced the acquisition of TAO Leadership Development Inc., a consultancy focused on supporting fast-paced cultural change and organizational transformation in organizations. The purchase sought to accelerate the growth of EY People Advisory Services by boosting the firm's well-known technology-enabled transformational leadership and culture change capabilities.
  • In July 2022, the Uttar Pradesh government agreed on Tuesday to hire Deloitte India as a consultant to develop strategies for growing the state's GDP to USD 1 trillion.
  • In July 2022, Kirkland & Ellis advised I Squared Capital, a leading global infrastructure investment manager, and its ISQ Global Infrastructure Fund III on a definitive agreement to acquire VLS Environmental Solutions ("VLS") from Aurora Capital Partners, a leading middle-market private equity firm, in connection with the acquisition. In North America, VLS delivers mission-critical, specialized trash and specialty cleaning and repair services to a range of highly regulated sectors. The transaction's financial specifics were not disclosed.

Report Scope

Report Attributes Details
Growth Rate 4.6% CAGR from 2022 to 2032
Market Value in 2022 US$ 400 Billion
Market Value in 2032 US$ 627.12 Billion
Base Year for Estimation 2021
Historical Data 2017 to 2021
Forecast Period 2022 to 2032
Quantitative Units Revenue in US$ Million and CAGR from 2022 to 2032
Report Coverage Revenue Forecast, Company Ranking, Competitive Landscape, Growth Factors, Trends, and Pricing Analysis
Segments Covered
  • Service Type
  • Firm Size
  • Provider
  • Region
Regions Covered
  • North America
  • Latin America
  • Europe
  • Asia Pacific
  • Middle East and Africa
Key Countries Profiled
  • United States of America
  • Canada
  • Brazil
  • Mexico
  • Germany
  • United Kingdom
  • France
  • Spain
  • Italy
  • China
  • Japan
  • South Korea
  • Malaysia
  • Singapore
  • Australia
  • New Zealand
  • GCC Countries
  • South Africa
  • Israel

Key Segments Covered in the Legal Services Industry Survey

By Service Type:

  • Taxation
  • Real Estate
  • Litigation
  • Bankruptcy
  • Labor/Employment
  • Corporate

By Firm Size:

  • Large
  • Medium
  • Small

By Provider:

  • Private Practicing Attorneys
  • Legal Business Firms
  • Government Departments
  • Other Providers

By Region:

  • North America
  • Europe
  • Asia Pacific
  • Latin America
  • Middle East & Africa

Frequently Asked Questions

What is the estimated market value of the global legal services market?

The global Legal Services market is estimated at US$ 400 Billion in 2022

What is the anticipated value of the global legal services market during the forecast period?

The global legal services market is estimated at US$ 627.12 Billion by 2032

What is the projected CAGR of the global legal services market from 2022 to 2032?

The global legal services market is forecasted to expand at a 4.6% growth rate till 2032

What is the market size of the legal services in the USA?

The USA market is anticipated to exhibit a 4.5% CAGR from 2022 to 2032

What is the Indian market size of the global Legal Services market?

India is projected to garner a 4.3% CAGR during the forecast period

What is the anticipated CAGR of the corporate segment during the forecast period?

The corporate segment is likely to expand at 4.5% CAGR in the forecast period.

Table of Content

1. Executive Summary | Legal Services Market

    1.1. Global Market Outlook

    1.2. Demand-side Trends

    1.3. Supply-side Trends

    1.4. Technology Roadmap Analysis

    1.5. Analysis and Recommendations

2. Market Overview

    2.1. Market Coverage / Taxonomy

    2.2. Market Definition / Scope / Limitations

3. Market Background

    3.1. Market Dynamics

        3.1.1. Drivers

        3.1.2. Restraints

        3.1.3. Opportunity

        3.1.4. Trends

    3.2. Scenario Forecast

        3.2.1. Demand in Optimistic Scenario

        3.2.2. Demand in Likely Scenario

        3.2.3. Demand in Conservative Scenario

    3.3. Opportunity Map Analysis

    3.4. Investment Feasibility Matrix

    3.5. PESTLE and Porter’s Analysis

    3.6. Regulatory Landscape

        3.6.1. By Key Regions

        3.6.2. By Key Countries

    3.7. Regional Parent Market Outlook

4. Global Market Analysis 2017 to 2021 and Forecast, 2022 to 2032

    4.1. Historical Market Size Value (US$ Million) Analysis, 2017 to 2021

    4.2. Current and Future Market Size Value (US$ Million) Projections, 2022 to 2032

        4.2.1. Y-o-Y Growth Trend Analysis

        4.2.2. Absolute Opportunity Analysis

5. Global Market Analysis 2017 to 2021 and Forecast 2022 to 2032, By Services

    5.1. Introduction / Key Findings

    5.2. Historical Market Size Value (US$ Million) Analysis By Services, 2017 to 2021

    5.3. Current and Future Market Size Value (US$ Million) Analysis and Forecast By Services, 2022 to 2032

        5.3.1. Taxation

        5.3.2. Real Estate

        5.3.3. Litigation

        5.3.4. Bankruptcy

        5.3.5. Labor/Employment

        5.3.6. Corporate

    5.4. Y-o-Y Growth Trend Analysis By Services, 2017 to 2021

    5.5. Absolute Opportunity Analysis By Services, 2022 to 2032

6. Global Market Analysis 2017 to 2021 and Forecast 2022 to 2032, By Firm Size

    6.1. Introduction / Key Findings

    6.2. Historical Market Size Value (US$ Million) Analysis By Firm Size, 2017 to 2021

    6.3. Current and Future Market Size Value (US$ Million) Analysis and Forecast By Firm Size, 2022 to 2032

        6.3.1. Large Firms

        6.3.2. Medium Firms

        6.3.3. Small Firms

    6.4. Y-o-Y Growth Trend Analysis By Firm Size, 2017 to 2021

    6.5. Absolute Opportunity Analysis By Firm Size, 2022 to 2032

7. Global Market Analysis 2017 to 2021 and Forecast 2022 to 2032, By Provider

    7.1. Introduction / Key Findings

    7.2. Historical Market Size Value (US$ Million) Analysis By Provider, 2017 to 2021

    7.3. Current and Future Market Size Value (US$ Million) Analysis and Forecast By Provider, 2022 to 2032

        7.3.1. Private Practicing Attorneys

        7.3.2. Legal Business Firms

        7.3.3. Government Departments

    7.4. Y-o-Y Growth Trend Analysis By Provider, 2017 to 2021

    7.5. Absolute Opportunity Analysis By Provider, 2022 to 2032

8. Global Market Analysis 2017 to 2021 and Forecast 2022 to 2032, By Region

    8.1. Introduction

    8.2. Historical Market Size Value (US$ Million) Analysis By Region, 2017 to 2021

    8.3. Current Market Size Value (US$ Million) Analysis and Forecast By Region, 2022 to 2032

        8.3.1. North America

        8.3.2. Latin America

        8.3.3. Europe

        8.3.4. Asia Pacific

        8.3.5. Middle East and Africa

    8.4. Market Attractiveness Analysis By Region

9. North America Market Analysis 2017 to 2021 and Forecast 2022 to 2032, By Country

    9.1. Historical Market Size Value (US$ Million) Trend Analysis By Market Taxonomy, 2017 to 2021

    9.2. Market Size Value (US$ Million) Forecast By Market Taxonomy, 2022 to 2032

        9.2.1. By Country

            9.2.1.1. United States of America

            9.2.1.2. Canada

        9.2.2. By Services

        9.2.3. By Firm Size

        9.2.4. By Provider

    9.3. Market Attractiveness Analysis

        9.3.1. By Country

        9.3.2. By Services

        9.3.3. By Firm Size

        9.3.4. By Provider

    9.4. Key Takeaways

10. Latin America Market Analysis 2017 to 2021 and Forecast 2022 to 2032, By Country

    10.1. Historical Market Size Value (US$ Million) Trend Analysis By Market Taxonomy, 2017 to 2021

    10.2. Market Size Value (US$ Million) Forecast By Market Taxonomy, 2022 to 2032

        10.2.1. By Country

            10.2.1.1. Brazil

            10.2.1.2. Mexico

            10.2.1.3. Rest of Latin America

        10.2.2. By Services

        10.2.3. By Firm Size

        10.2.4. By Provider

    10.3. Market Attractiveness Analysis

        10.3.1. By Country

        10.3.2. By Services

        10.3.3. By Firm Size

        10.3.4. By Provider

    10.4. Key Takeaways

11. Europe Market Analysis 2017 to 2021 and Forecast 2022 to 2032, By Country

    11.1. Historical Market Size Value (US$ Million) Trend Analysis By Market Taxonomy, 2017 to 2021

    11.2. Market Size Value (US$ Million) Forecast By Market Taxonomy, 2022 to 2032

        11.2.1. By Country

            11.2.1.1. Germany

            11.2.1.2. United Kingdom

            11.2.1.3. France

            11.2.1.4. Spain

            11.2.1.5. Italy

            11.2.1.6. Rest of Europe

        11.2.2. By Services

        11.2.3. By Firm Size

        11.2.4. By Provider

    11.3. Market Attractiveness Analysis

        11.3.1. By Country

        11.3.2. By Services

        11.3.3. By Firm Size

        11.3.4. By Provider

    11.4. Key Takeaways

12. Asia Pacific Market Analysis 2017 to 2021 and Forecast 2022 to 2032, By Country

    12.1. Historical Market Size Value (US$ Million) Trend Analysis By Market Taxonomy, 2017 to 2021

    12.2. Market Size Value (US$ Million) Forecast By Market Taxonomy, 2022 to 2032

        12.2.1. By Country

            12.2.1.1. China

            12.2.1.2. Japan

            12.2.1.3. South Korea

            12.2.1.4. India

            12.2.1.5. Malaysia

            12.2.1.6. Singapore

            12.2.1.7. Australia

            12.2.1.8. New Zealand

            12.2.1.9. Rest of Asia-Pacific (APAC)

        12.2.2. By Services

        12.2.3. By Firm Size

        12.2.4. By Provider

    12.3. Market Attractiveness Analysis

        12.3.1. By Country

        12.3.2. By Services

        12.3.3. By Firm Size

        12.3.4. By Provider

    12.4. Key Takeaways

13. Middle East and Africa Market Analysis 2017 to 2021 and Forecast 2022 to 2032, By Country

    13.1. Historical Market Size Value (US$ Million) Trend Analysis By Market Taxonomy, 2017 to 2021

    13.2. Market Size Value (US$ Million) Forecast By Market Taxonomy, 2022 to 2032

        13.2.1. By Country

            13.2.1.1. GCC Countries

            13.2.1.2. South Africa

            13.2.1.3. Israel

            13.2.1.4. Rest of Middle East and Africa

        13.2.2. By Services

        13.2.3. By Firm Size

        13.2.4. By Provider

    13.3. Market Attractiveness Analysis

        13.3.1. By Country

        13.3.2. By Services

        13.3.3. By Firm Size

        13.3.4. By Provider

    13.4. Key Takeaways

14. Key Countries Market Analysis

    14.1. United States of America

        14.1.1. Pricing Analysis

        14.1.2. Market Share Analysis, 2021

            14.1.2.1. By Services

            14.1.2.2. By Firm Size

            14.1.2.3. By Provider

    14.2. Canada

        14.2.1. Pricing Analysis

        14.2.2. Market Share Analysis, 2021

            14.2.2.1. By Services

            14.2.2.2. By Firm Size

            14.2.2.3. By Provider

    14.3. Brazil

        14.3.1. Pricing Analysis

        14.3.2. Market Share Analysis, 2021

            14.3.2.1. By Services

            14.3.2.2. By Firm Size

            14.3.2.3. By Provider

    14.4. Mexico

        14.4.1. Pricing Analysis

        14.4.2. Market Share Analysis, 2021

            14.4.2.1. By Services

            14.4.2.2. By Firm Size

            14.4.2.3. By Provider

    14.5. Germany

        14.5.1. Pricing Analysis

        14.5.2. Market Share Analysis, 2021

            14.5.2.1. By Services

            14.5.2.2. By Firm Size

            14.5.2.3. By Provider

    14.6. United Kingdom

        14.6.1. Pricing Analysis

        14.6.2. Market Share Analysis, 2021

            14.6.2.1. By Services

            14.6.2.2. By Firm Size

            14.6.2.3. By Provider

    14.7. France

        14.7.1. Pricing Analysis

        14.7.2. Market Share Analysis, 2021

            14.7.2.1. By Services

            14.7.2.2. By Firm Size

            14.7.2.3. By Provider

    14.8. Spain

        14.8.1. Pricing Analysis

        14.8.2. Market Share Analysis, 2021

            14.8.2.1. By Services

            14.8.2.2. By Firm Size

            14.8.2.3. By Provider

    14.9. Italy

        14.9.1. Pricing Analysis

        14.9.2. Market Share Analysis, 2021

            14.9.2.1. By Services

            14.9.2.2. By Firm Size

            14.9.2.3. By Provider

    14.10. China

        14.10.1. Pricing Analysis

        14.10.2. Market Share Analysis, 2021

            14.10.2.1. By Services

            14.10.2.2. By Firm Size

            14.10.2.3. By Provider

    14.11. Japan

        14.11.1. Pricing Analysis

        14.11.2. Market Share Analysis, 2021

            14.11.2.1. By Services

            14.11.2.2. By Firm Size

            14.11.2.3. By Provider

    14.12. South Korea

        14.12.1. Pricing Analysis

        14.12.2. Market Share Analysis, 2021

            14.12.2.1. By Services

            14.12.2.2. By Firm Size

            14.12.2.3. By Provider

    14.13. Malaysia

        14.13.1. Pricing Analysis

        14.13.2. Market Share Analysis, 2021

            14.13.2.1. By Services

            14.13.2.2. By Firm Size

            14.13.2.3. By Provider

    14.14. Singapore

        14.14.1. Pricing Analysis

        14.14.2. Market Share Analysis, 2021

            14.14.2.1. By Services

            14.14.2.2. By Firm Size

            14.14.2.3. By Provider

    14.15. Australia

        14.15.1. Pricing Analysis

        14.15.2. Market Share Analysis, 2021

            14.15.2.1. By Services

            14.15.2.2. By Firm Size

            14.15.2.3. By Provider

    14.16. New Zealand

        14.16.1. Pricing Analysis

        14.16.2. Market Share Analysis, 2021

            14.16.2.1. By Services

            14.16.2.2. By Firm Size

            14.16.2.3. By Provider

    14.17. GCC Countries

        14.17.1. Pricing Analysis

        14.17.2. Market Share Analysis, 2021

            14.17.2.1. By Services

            14.17.2.2. By Firm Size

            14.17.2.3. By Provider

    14.18. South Africa

        14.18.1. Pricing Analysis

        14.18.2. Market Share Analysis, 2021

            14.18.2.1. By Services

            14.18.2.2. By Firm Size

            14.18.2.3. By Provider

    14.19. Israel

        14.19.1. Pricing Analysis

        14.19.2. Market Share Analysis, 2021

            14.19.2.1. By Services

            14.19.2.2. By Firm Size

            14.19.2.3. By Provider

15. Market Structure Analysis

    15.1. Competition Dashboard

    15.2. Competition Benchmarking

    15.3. Market Share Analysis of Top Players

        15.3.1. By Regional

        15.3.2. By Services

        15.3.3. By Firm Size

        15.3.4. By Provider

16. Competition Analysis

    16.1. Competition Deep Dive

        16.1.1. Baker & McKenzie

            16.1.1.1. Overview

            16.1.1.2. Product Portfolio

            16.1.1.3. Profitability by Market Segments

            16.1.1.4. Sales Footprint

            16.1.1.5. Strategy Overview

                16.1.1.5.1. Marketing Strategy

        16.1.2. Clifford Chance LLP

            16.1.2.1. Overview

            16.1.2.2. Product Portfolio

            16.1.2.3. Profitability by Market Segments

            16.1.2.4. Sales Footprint

            16.1.2.5. Strategy Overview

                16.1.2.5.1. Marketing Strategy

        16.1.3. Deloitte

            16.1.3.1. Overview

            16.1.3.2. Product Portfolio

            16.1.3.3. Profitability by Market Segments

            16.1.3.4. Sales Footprint

            16.1.3.5. Strategy Overview

                16.1.3.5.1. Marketing Strategy

        16.1.4. DLA Piper

            16.1.4.1. Overview

            16.1.4.2. Product Portfolio

            16.1.4.3. Profitability by Market Segments

            16.1.4.4. Sales Footprint

            16.1.4.5. Strategy Overview

                16.1.4.5.1. Marketing Strategy

        16.1.5. Ernst & Young (E&Y)

            16.1.5.1. Overview

            16.1.5.2. Product Portfolio

            16.1.5.3. Profitability by Market Segments

            16.1.5.4. Sales Footprint

            16.1.5.5. Strategy Overview

                16.1.5.5.1. Marketing Strategy

        16.1.6. Kirkland & Ellis LLP

            16.1.6.1. Overview

            16.1.6.2. Product Portfolio

            16.1.6.3. Profitability by Market Segments

            16.1.6.4. Sales Footprint

            16.1.6.5. Strategy Overview

                16.1.6.5.1. Marketing Strategy

        16.1.7. KPMG

            16.1.7.1. Overview

            16.1.7.2. Product Portfolio

            16.1.7.3. Profitability by Market Segments

            16.1.7.4. Sales Footprint

            16.1.7.5. Strategy Overview

                16.1.7.5.1. Marketing Strategy

        16.1.8. LATHAM & WATKINS LLP

            16.1.8.1. Overview

            16.1.8.2. Product Portfolio

            16.1.8.3. Profitability by Market Segments

            16.1.8.4. Sales Footprint

            16.1.8.5. Strategy Overview

                16.1.8.5.1. Marketing Strategy

        16.1.9. PwC

            16.1.9.1. Overview

            16.1.9.2. Product Portfolio

            16.1.9.3. Profitability by Market Segments

            16.1.9.4. Sales Footprint

            16.1.9.5. Strategy Overview

                16.1.9.5.1. Marketing Strategy

        16.1.10. Skadden

            16.1.10.1. Overview

            16.1.10.2. Product Portfolio

            16.1.10.3. Profitability by Market Segments

            16.1.10.4. Sales Footprint

            16.1.10.5. Strategy Overview

                16.1.10.5.1. Marketing Strategy

17. Assumptions & Acronyms Used

18. Research Methodology

List of Tables

Table 1: Global Market Value (US$ Million) Forecast by Region, 2017 to 2032

Table 2: Global Market Value (US$ Million) Forecast by Services, 2017 to 2032

Table 3: Global Market Value (US$ Million) Forecast by Firm Size, 2017 to 2032

Table 4: Global Market Value (US$ Million) Forecast by Provider, 2017 to 2032

Table 5: North America Market Value (US$ Million) Forecast by Country, 2017 to 2032

Table 6: North America Market Value (US$ Million) Forecast by Services, 2017 to 2032

Table 7: North America Market Value (US$ Million) Forecast by Firm Size, 2017 to 2032

Table 8: North America Market Value (US$ Million) Forecast by Provider, 2017 to 2032

Table 9: Latin America Market Value (US$ Million) Forecast by Country, 2017 to 2032

Table 10: Latin America Market Value (US$ Million) Forecast by Services, 2017 to 2032

Table 11: Latin America Market Value (US$ Million) Forecast by Firm Size, 2017 to 2032

Table 12: Latin America Market Value (US$ Million) Forecast by Provider, 2017 to 2032

Table 13: Europe Market Value (US$ Million) Forecast by Country, 2017 to 2032

Table 14: Europe Market Value (US$ Million) Forecast by Services, 2017 to 2032

Table 15: Europe Market Value (US$ Million) Forecast by Firm Size, 2017 to 2032

Table 16: Europe Market Value (US$ Million) Forecast by Provider, 2017 to 2032

Table 17: Asia Pacific Market Value (US$ Million) Forecast by Country, 2017 to 2032

Table 18: Asia Pacific Market Value (US$ Million) Forecast by Services, 2017 to 2032

Table 19: Asia Pacific Market Value (US$ Million) Forecast by Firm Size, 2017 to 2032

Table 20: Asia Pacific Market Value (US$ Million) Forecast by Provider, 2017 to 2032

Table 21: Middle East and Africa Market Value (US$ Million) Forecast by Country, 2017 to 2032

Table 22: Middle East and Africa Market Value (US$ Million) Forecast by Services, 2017 to 2032

Table 23: Middle East and Africa Market Value (US$ Million) Forecast by Firm Size, 2017 to 2032

Table 24: Middle East and Africa Market Value (US$ Million) Forecast by Provider, 2017 to 2032

List of Charts

Figure 1: Global Market Value (US$ Million) by Services, 2022 to 2032

Figure 2: Global Market Value (US$ Million) by Firm Size, 2022 to 2032

Figure 3: Global Market Value (US$ Million) by Provider, 2022 to 2032

Figure 4: Global Market Value (US$ Million) by Region, 2022 to 2032

Figure 5: Global Market Value (US$ Million) Analysis by Region, 2017 to 2032

Figure 6: Global Market Value Share (%) and BPS Analysis by Region, 2022 to 2032

Figure 7: Global Market Y-o-Y Growth (%) Projections by Region, 2022 to 2032

Figure 8: Global Market Value (US$ Million) Analysis by Services, 2017 to 2032

Figure 9: Global Market Value Share (%) and BPS Analysis by Services, 2022 to 2032

Figure 10: Global Market Y-o-Y Growth (%) Projections by Services, 2022 to 2032

Figure 11: Global Market Value (US$ Million) Analysis by Firm Size, 2017 to 2032

Figure 12: Global Market Value Share (%) and BPS Analysis by Firm Size, 2022 to 2032

Figure 13: Global Market Y-o-Y Growth (%) Projections by Firm Size, 2022 to 2032

Figure 14: Global Market Value (US$ Million) Analysis by Provider, 2017 to 2032

Figure 15: Global Market Value Share (%) and BPS Analysis by Provider, 2022 to 2032

Figure 16: Global Market Y-o-Y Growth (%) Projections by Provider, 2022 to 2032

Figure 17: Global Market Attractiveness by Services, 2022 to 2032

Figure 18: Global Market Attractiveness by Firm Size, 2022 to 2032

Figure 19: Global Market Attractiveness by Provider, 2022 to 2032

Figure 20: Global Market Attractiveness by Region, 2022 to 2032

Figure 21: North America Market Value (US$ Million) by Services, 2022 to 2032

Figure 22: North America Market Value (US$ Million) by Firm Size, 2022 to 2032

Figure 23: North America Market Value (US$ Million) by Provider, 2022 to 2032

Figure 24: North America Market Value (US$ Million) by Country, 2022 to 2032

Figure 25: North America Market Value (US$ Million) Analysis by Country, 2017 to 2032

Figure 26: North America Market Value Share (%) and BPS Analysis by Country, 2022 to 2032

Figure 27: North America Market Y-o-Y Growth (%) Projections by Country, 2022 to 2032

Figure 28: North America Market Value (US$ Million) Analysis by Services, 2017 to 2032

Figure 29: North America Market Value Share (%) and BPS Analysis by Services, 2022 to 2032

Figure 30: North America Market Y-o-Y Growth (%) Projections by Services, 2022 to 2032

Figure 31: North America Market Value (US$ Million) Analysis by Firm Size, 2017 to 2032

Figure 32: North America Market Value Share (%) and BPS Analysis by Firm Size, 2022 to 2032

Figure 33: North America Market Y-o-Y Growth (%) Projections by Firm Size, 2022 to 2032

Figure 34: North America Market Value (US$ Million) Analysis by Provider, 2017 to 2032

Figure 35: North America Market Value Share (%) and BPS Analysis by Provider, 2022 to 2032

Figure 36: North America Market Y-o-Y Growth (%) Projections by Provider, 2022 to 2032

Figure 37: North America Market Attractiveness by Services, 2022 to 2032

Figure 38: North America Market Attractiveness by Firm Size, 2022 to 2032

Figure 39: North America Market Attractiveness by Provider, 2022 to 2032

Figure 40: North America Market Attractiveness by Country, 2022 to 2032

Figure 41: Latin America Market Value (US$ Million) by Services, 2022 to 2032

Figure 42: Latin America Market Value (US$ Million) by Firm Size, 2022 to 2032

Figure 43: Latin America Market Value (US$ Million) by Provider, 2022 to 2032

Figure 44: Latin America Market Value (US$ Million) by Country, 2022 to 2032

Figure 45: Latin America Market Value (US$ Million) Analysis by Country, 2017 to 2032

Figure 46: Latin America Market Value Share (%) and BPS Analysis by Country, 2022 to 2032

Figure 47: Latin America Market Y-o-Y Growth (%) Projections by Country, 2022 to 2032

Figure 48: Latin America Market Value (US$ Million) Analysis by Services, 2017 to 2032

Figure 49: Latin America Market Value Share (%) and BPS Analysis by Services, 2022 to 2032

Figure 50: Latin America Market Y-o-Y Growth (%) Projections by Services, 2022 to 2032

Figure 51: Latin America Market Value (US$ Million) Analysis by Firm Size, 2017 to 2032

Figure 52: Latin America Market Value Share (%) and BPS Analysis by Firm Size, 2022 to 2032

Figure 53: Latin America Market Y-o-Y Growth (%) Projections by Firm Size, 2022 to 2032

Figure 54: Latin America Market Value (US$ Million) Analysis by Provider, 2017 to 2032

Figure 55: Latin America Market Value Share (%) and BPS Analysis by Provider, 2022 to 2032

Figure 56: Latin America Market Y-o-Y Growth (%) Projections by Provider, 2022 to 2032

Figure 57: Latin America Market Attractiveness by Services, 2022 to 2032

Figure 58: Latin America Market Attractiveness by Firm Size, 2022 to 2032

Figure 59: Latin America Market Attractiveness by Provider, 2022 to 2032

Figure 60: Latin America Market Attractiveness by Country, 2022 to 2032

Figure 61: Europe Market Value (US$ Million) by Services, 2022 to 2032

Figure 62: Europe Market Value (US$ Million) by Firm Size, 2022 to 2032

Figure 63: Europe Market Value (US$ Million) by Provider, 2022 to 2032

Figure 64: Europe Market Value (US$ Million) by Country, 2022 to 2032

Figure 65: Europe Market Value (US$ Million) Analysis by Country, 2017 to 2032

Figure 66: Europe Market Value Share (%) and BPS Analysis by Country, 2022 to 2032

Figure 67: Europe Market Y-o-Y Growth (%) Projections by Country, 2022 to 2032

Figure 68: Europe Market Value (US$ Million) Analysis by Services, 2017 to 2032

Figure 69: Europe Market Value Share (%) and BPS Analysis by Services, 2022 to 2032

Figure 70: Europe Market Y-o-Y Growth (%) Projections by Services, 2022 to 2032

Figure 71: Europe Market Value (US$ Million) Analysis by Firm Size, 2017 to 2032

Figure 72: Europe Market Value Share (%) and BPS Analysis by Firm Size, 2022 to 2032

Figure 73: Europe Market Y-o-Y Growth (%) Projections by Firm Size, 2022 to 2032

Figure 74: Europe Market Value (US$ Million) Analysis by Provider, 2017 to 2032

Figure 75: Europe Market Value Share (%) and BPS Analysis by Provider, 2022 to 2032

Figure 76: Europe Market Y-o-Y Growth (%) Projections by Provider, 2022 to 2032

Figure 77: Europe Market Attractiveness by Services, 2022 to 2032

Figure 78: Europe Market Attractiveness by Firm Size, 2022 to 2032

Figure 79: Europe Market Attractiveness by Provider, 2022 to 2032

Figure 80: Europe Market Attractiveness by Country, 2022 to 2032

Figure 81: Asia Pacific Market Value (US$ Million) by Services, 2022 to 2032

Figure 82: Asia Pacific Market Value (US$ Million) by Firm Size, 2022 to 2032

Figure 83: Asia Pacific Market Value (US$ Million) by Provider, 2022 to 2032

Figure 84: Asia Pacific Market Value (US$ Million) by Country, 2022 to 2032

Figure 85: Asia Pacific Market Value (US$ Million) Analysis by Country, 2017 to 2032

Figure 86: Asia Pacific Market Value Share (%) and BPS Analysis by Country, 2022 to 2032

Figure 87: Asia Pacific Market Y-o-Y Growth (%) Projections by Country, 2022 to 2032

Figure 88: Asia Pacific Market Value (US$ Million) Analysis by Services, 2017 to 2032

Figure 89: Asia Pacific Market Value Share (%) and BPS Analysis by Services, 2022 to 2032

Figure 90: Asia Pacific Market Y-o-Y Growth (%) Projections by Services, 2022 to 2032

Figure 91: Asia Pacific Market Value (US$ Million) Analysis by Firm Size, 2017 to 2032

Figure 92: Asia Pacific Market Value Share (%) and BPS Analysis by Firm Size, 2022 to 2032

Figure 93: Asia Pacific Market Y-o-Y Growth (%) Projections by Firm Size, 2022 to 2032

Figure 94: Asia Pacific Market Value (US$ Million) Analysis by Provider, 2017 to 2032

Figure 95: Asia Pacific Market Value Share (%) and BPS Analysis by Provider, 2022 to 2032

Figure 96: Asia Pacific Market Y-o-Y Growth (%) Projections by Provider, 2022 to 2032

Figure 97: Asia Pacific Market Attractiveness by Services, 2022 to 2032

Figure 98: Asia Pacific Market Attractiveness by Firm Size, 2022 to 2032

Figure 99: Asia Pacific Market Attractiveness by Provider, 2022 to 2032

Figure 100: Asia Pacific Market Attractiveness by Country, 2022 to 2032

Figure 101: Middle East and Africa Market Value (US$ Million) by Services, 2022 to 2032

Figure 102: Middle East and Africa Market Value (US$ Million) by Firm Size, 2022 to 2032

Figure 103: Middle East and Africa Market Value (US$ Million) by Provider, 2022 to 2032

Figure 104: Middle East and Africa Market Value (US$ Million) by Country, 2022 to 2032

Figure 105: Middle East and Africa Market Value (US$ Million) Analysis by Country, 2017 to 2032

Figure 106: Middle East and Africa Market Value Share (%) and BPS Analysis by Country, 2022 to 2032

Figure 107: Middle East and Africa Market Y-o-Y Growth (%) Projections by Country, 2022 to 2032

Figure 108: Middle East and Africa Market Value (US$ Million) Analysis by Services, 2017 to 2032

Figure 109: Middle East and Africa Market Value Share (%) and BPS Analysis by Services, 2022 to 2032

Figure 110: Middle East and Africa Market Y-o-Y Growth (%) Projections by Services, 2022 to 2032

Figure 111: Middle East and Africa Market Value (US$ Million) Analysis by Firm Size, 2017 to 2032

Figure 112: Middle East and Africa Market Value Share (%) and BPS Analysis by Firm Size, 2022 to 2032

Figure 113: Middle East and Africa Market Y-o-Y Growth (%) Projections by Firm Size, 2022 to 2032

Figure 114: Middle East and Africa Market Value (US$ Million) Analysis by Provider, 2017 to 2032

Figure 115: Middle East and Africa Market Value Share (%) and BPS Analysis by Provider, 2022 to 2032

Figure 116: Middle East and Africa Market Y-o-Y Growth (%) Projections by Provider, 2022 to 2032

Figure 117: Middle East and Africa Market Attractiveness by Services, 2022 to 2032

Figure 118: Middle East and Africa Market Attractiveness by Firm Size, 2022 to 2032

Figure 119: Middle East and Africa Market Attractiveness by Provider, 2022 to 2032

Figure 120: Middle East and Africa Market Attractiveness by Country, 2022 to 2032

Recommendations

Technology

Legal Transcription Market

Published : April 2024

Technology

Legal, Risk and Compliance Solution Market

Published : March 2024

Explore Technology Insights

View Reports