AR Tour Services Market Size and Share Forecast Outlook 2025 to 2035

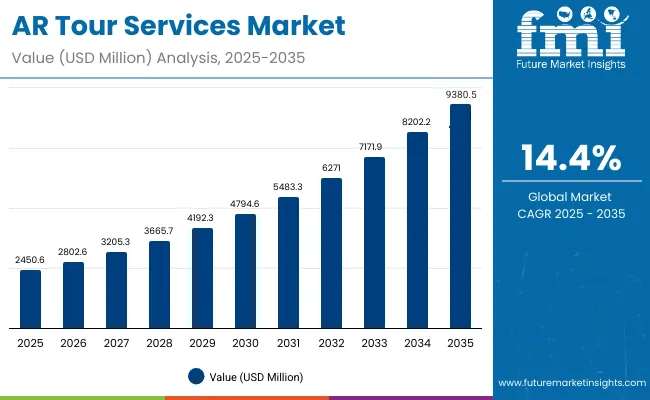
The AR Tour Services Market is expected to record a valuation of USD 2,450.6 million in 2025 and USD 9,380.5 million in 2035, with an increase of USD 6,929.9 million, which equals a growth of 283% over the decade. The overall expansion represents a CAGR of 14.4% and a 3.8X increase in market size.

Quick Stats for AR Tour Services Market

  • AR Tour Services Market Value (2025): USD 2,450.6 million
  • AR Tour Services Market Forecast Value (2035): USD 9,380.5 million
  • AR Tour Services Market Forecast CAGR: 14.4%
  • Leading Segment in AR Tour Services Market in 2025: Smartphone/tablet AR (70.3%)
  • Key Growth Regions in the AR Tour Services Market: North America, Asia-Pacific, Europe
  • Top Key Players in AR Tour Services Market: Google Arts & Culture, Smartify, ARLOOPA, Zappar, Niantic, Blippar, TimeLooper, GuidiGO, Augmentir, Vuzix

Ar Tour Services Market

AR Tour Services Market Key Takeaways

Metric Value
Market Estimated Value in (2025E) USD 2,450.6 million
Market Forecast Value in (2035F) USD 9,380.5 million
Forecast CAGR (2025 to 2035) 14.4%

During the first five-year period from 2025 to 2030, the market increases from USD 2,450.6 million to USD 4,794.6 million, adding USD 2,344 million, which accounts for 33.8% of the total decade growth. This phase records steady adoption in museums, city walking tours, and early theme park integrations, driven by the need for immersive visitor experiences. Smartphone/tablet-based AR solutions dominate this period as they cater to over 70% of delivery devices used across user groups such as tourists, local explorers, and students.

The second half from 2030 to 2035 contributes USD 4,585.9 million, equal to 66.2% of total growth, as the market jumps from USD 4,794.6 million to USD 9,380.5 million. This acceleration is powered by widespread deployment of AI-personalized tour guides, spatially-aware AR integrations, and subscription-based AR travel platforms. Smart glasses and mid-range devices together capture a larger share above 35% by the end of the decade. Cloud-based content platforms and AR SaaS ecosystems add recurring revenue, increasing the software/service component share beyond 40% in total value.

From 2020 to 2024, the AR Tour Services Market experienced a strong build-up toward immersive tourism solutions, with growth accelerated by museum digitization projects, heritage preservation initiatives, and city walking tour apps. Adoption was driven by the accessibility of smartphones and tablets, which provided a cost-effective entry point for AR experiences. By 2025, the market is projected at USD 2,450.6 million, with a significant shift toward subscription-based and pay-per-tour pricing models.

Looking ahead, the revenue mix will evolve as AR smart glasses and cloud-based AR platforms grow to capture larger shares beyond 2025. Traditional AR app providers are facing rising competition from digital-first platforms offering AI-driven personalization, real-time translations, and AR-integrated tourism packages. Market leaders are pivoting toward ecosystem-based models, combining devices, apps, and subscription passes to retain long-term customer engagement. Emerging entrants focusing on cross-sector applications in education, entertainment, and cultural preservation are also gaining traction.

The competitive edge is shifting away from AR delivery devices alone toward scalable platforms, immersive content libraries, and recurring revenue streams that power the next generation of tourism and cultural experiences.
Why the AR Tour Services Market is growing?

A major driver of AR Tour Services growth is its integration with museum digitization, cultural heritage preservation, and educational tourism. Governments and cultural organizations are funding projects that use AR to recreate historical environments, display 3D artifacts, and provide interactive storytelling. This not only improves visitor engagement but also helps in preserving fragile sites by reducing physical interaction. The use of AR in schools and universities for field trips and curriculum-based experiences is creating a long-term, sustainable adoption pipeline.

The market is accelerating due to the rise of AR smart glasses and their ability to deliver hands-free, location-based, and real-time multilingual tours. Tourists in foreign countries benefit from instant AR translations, AI-driven narration, and immersive overlays of cultural or historical insights. This personalized experience enhances convenience and accessibility, making AR indispensable for international travelers. As smart glasses become more affordable and integrated with cloud-based AR platforms, the market is seeing adoption beyond tourists, into students and local explorers, broadening its revenue base.

Segmental Analysis

The market is segmented by application, delivery device, user group, pricing model, and region. Applications include museums & heritage, city walking tours, theme parks & attractions, and travel agencies/DMCs, highlighting the diverse areas where AR enhances visitor engagement and cultural experiences. Delivery device classification covers smartphone/tablet AR and AR smart glasses, catering to both mass-market accessibility and emerging immersive technologies.

Based on user groups, the segmentation includes tourists, students, and local explorers, reflecting the broadening appeal of AR services across different demographics. In terms of pricing models, categories encompass pay-per-tour and subscription passes, offering flexibility between one-time tourist demand and recurring usage by frequent visitors. Regionally, the scope spans North America, Europe, Asia-Pacific, and the Rest of the World, with high-growth opportunities in Asia-Pacific markets such as China, India, and Japan, steady adoption in Europe through Germany and the UK, and innovation-driven expansion in North America, led by the USA
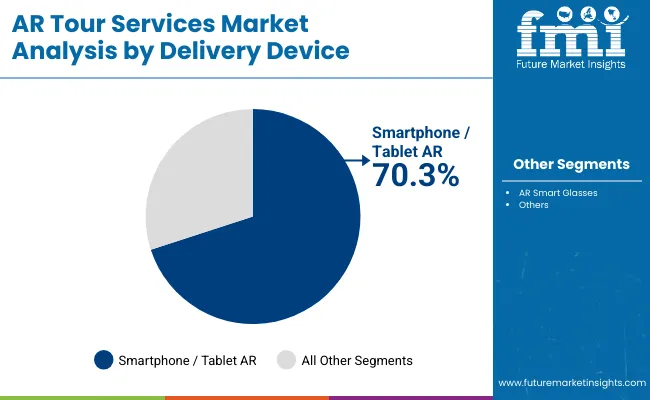
Insights into the Delivery Device Segment with Smartphones/Tablet AR Leading in Market Share

Ar Tour Services Market By Delivery

Delivery Device Value Share% 2025
Smartphone/tablet AR 70.3%
Others 29.7%

The smartphone/tablet AR segment is projected to contribute 70.3% of the AR Tour Services Market revenue in 2025, maintaining its dominance as the primary delivery device. This leadership is driven by the ubiquity of smartphones and the accessibility of AR apps through existing mobile platforms, which lowers barriers to adoption for tourists and casual users. Smartphones enable location-based AR overlays, interactive storytelling, and real-time navigation, making them ideal for city walking tours, museums, and attractions.

Growth is also supported by the continuous improvement of mobile AR capabilities, including faster processors, high-resolution cameras, and 5G connectivity. These advancements enhance immersive experiences while keeping costs manageable for end-users. While AR smart glasses are expected to gain traction in the long term, smartphones and tablets will remain the backbone of AR tour services through the next decade due to their scalability and global reach.
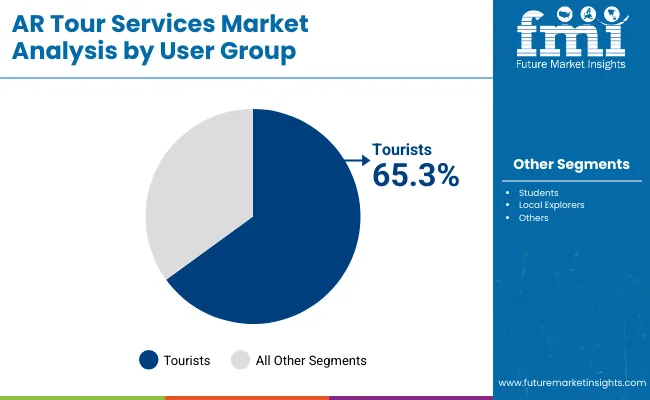
Insights into the User Group Segment with Tourists Leading in Market Share

Ar Tour Services Market By User

User Group Value Share% 2025
Tourists 65.3%
Others 34.7%

The tourist segment is forecasted to hold 65.3% of the AR Tour Services Market revenue in 2025, establishing itself as the leading user group. Tourists are the primary beneficiaries of immersive AR experiences, leveraging AR for city walking tours, museum visits, and heritage exploration. The demand is driven by the growing preference for interactive and personalized travel experiences that combine cultural storytelling with digital engagement.

Adoption is further supported by the global rise of experiential tourism, where AR enables travelers to visualize historical reconstructions, receive real-time multilingual narration, and enjoy gamified exploration of cities and attractions. As affordability improves and AR content libraries expand, tourists are expected to remain the dominant user base of AR tour services. Emerging groups such as students and local explorers will grow, but the tourist category will continue to anchor market revenues.
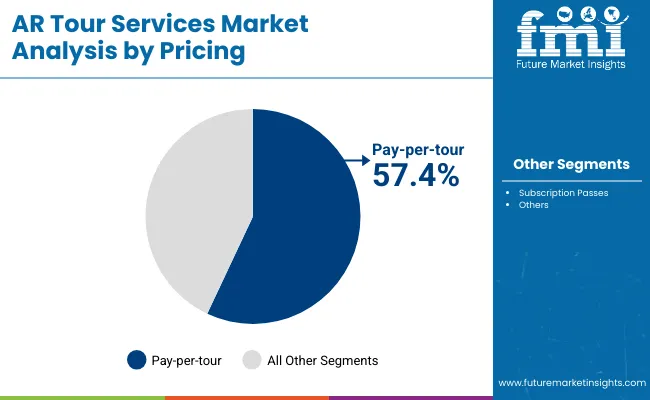
Insights into the Pricing Segment with Pay-per-tour Leading in Market Share

Ar Tour Services Market By Pricing

Pricing Value Share% 2025
Pay-per-tour 57.4%
Others 42.6%

The pay-per-tour segment is projected to contribute 57.4% of the AR Tour Services Market revenue in 2025, making it the leading pricing model. This dominance stems from the one-time, flexible nature of payments that aligns with tourist behavior, where visitors prefer paying for individual attractions, city walking tours, or museum experiences without long-term commitments.

Pay-per-tour is particularly effective for international travelers and casual users, as it provides access to AR-enhanced experiences without requiring subscriptions. Its success is also linked to bundled ticketing models, where museums, heritage sites, or travel agencies integrate AR into existing admission fees. While subscription passes are gaining traction among students and frequent local explorers, pay-per-tour will remain the anchor pricing strategy, given the large tourist base driving demand in the AR Tour Services Market.

What are the Drivers, Restraints, and Key Trends of the AR Tour Services Market?

Growing Demand for Immersive Cultural Experiences

A key driver of the AR Tour Services Market is the increasing consumer preference for immersive and interactive tourism. Museums, heritage sites, and city walking tours are deploying AR to overlay historical reconstructions, multilingual narration, and gamified exploration. This enhances visitor engagement while reducing reliance on physical guides. As international travel rebounds, tourists are actively seeking unique experiences that blend digital innovation with cultural authenticity, positioning AR as a vital tool for tourism boards, museums, and travel operators.

Accessibility Through Smartphones and Tablets

The dominance of smartphone/tablet AR delivery (70.3% in 2025) fuels market growth, as nearly every traveler already owns a compatible device. This eliminates the need for expensive hardware, allowing AR applications to scale quickly across regions and demographics. The widespread availability of 5G and high-resolution cameras further enhances real-time overlays and location-based interactivity. As AR apps integrate with booking platforms and navigation systems, the convenience of accessing AR tours directly from personal devices is accelerating adoption across both developed and emerging markets.

High Cost and Limited Adoption of AR Smart Glasses While smartphones drive mass adoption, the growth of AR smart glassesa critical step for hands-free immersive experiences is hindered by high costs, limited content libraries, and user hesitancy. For many travelers, investing in standalone AR glasses for short-term tourism is not viable. Content developers face challenges in scaling cross-platform experiences due to fragmentation. Until prices decline and ecosystems mature, reliance on smartphones will continue, slowing the full potential of immersive, real-time AR tour services.

Integration of AI and Cloud-based Personalization

A major trend in the AR Tour Services Market is the integration of AI-driven personalization and cloud connectivity. Platforms are increasingly offering real-time translation, adaptive storytelling, and behavior-based recommendations tailored to each user’s profile. Cloud-based AR ecosystems allow seamless updates and remote delivery of new experiences, ensuring scalability. This trend is particularly impactful for tourists in foreign countries, where personalized navigation, cultural narration, and interactive gamification create differentiated experiences. The convergence of AI, AR, and cloud platforms is reshaping digital tourism services globally.
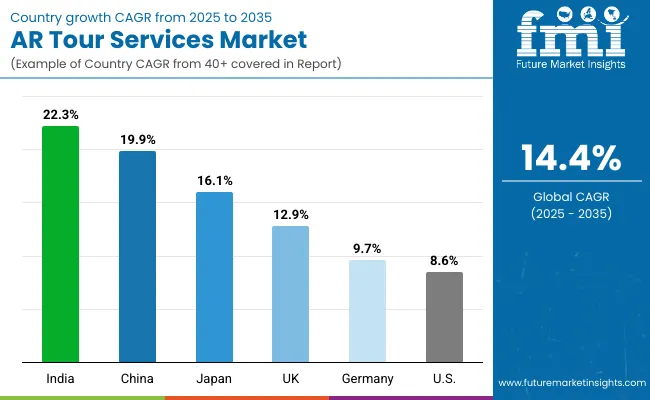
Analysis of AR Tour Services Market By Key Countries

Ar Tour Services Market By Country

Countries Estimated CAGR (2025 to 2035)
China 19.9%
USA 8.6%
India 22.3%
UK 12.9%
Germany 9.7%
Japan 16.1%

The global AR Tour Services Market shows distinct regional variations, shaped by cultural investment, smartphone penetration, and the pace of digital adoption in tourism. Asia-Pacific emerges as the fastest-growing region, anchored by India (22.3% CAGR) and China (19.9% CAGR). India’s growth reflects rising smartphone-led accessibility and government-backed initiatives for smart tourism and digital heritage preservation, which are expanding AR adoption in museums, monuments, and city tours. China’s momentum comes from strong support for cultural digitization, AI integration, and the rapid deployment of AR apps within domestic tourism ecosystems.

Europe maintains steady expansion, led by the UK (12.9% CAGR) and Germany (9.7% CAGR). Growth is supported by the region’s emphasis on museum digitization, heritage site preservation, and government-funded AR tourism programs. Demand in Europe also benefits from the integration of AR into theme parks and cultural institutions, making it a pioneer in public-private adoption models. Japan (16.1% CAGR) is another standout, with AR tour services expanding rapidly across city tourism, entertainment hubs, and educational institutions that emphasize immersive cultural experiences.

North America, with the USA at 8.6% CAGR, shows moderate growth due to a more mature digital tourism infrastructure. Growth is service-driven, fueled by AR-based museum exhibits, city exploration apps, and partnerships with travel agencies, but adoption is comparatively slower than Asia-Pacific where governments and cultural bodies are driving systemic digitization.
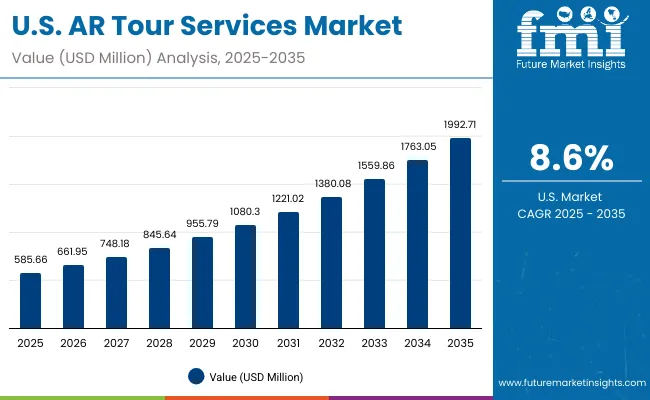
Sales Outlook for AR Tour Services in the United States

Ar Tour Services Market Usa

Year USA AR Tour Services Market (USD Million)
2025 585.66
2026 661.95
2027 748.18
2028 845.64
2029 955.79
2030 1080.30
2031 1221.02
2032 1380.08
2033 1559.86
2034 1763.05
2035 1992.71

The AR Tour Services Market in the United States is projected to grow at a CAGR of 8.6% between 2025 and 2035, reaching nearly USD 2.0 billion by 2035. Growth is fueled by rising adoption of AR city walking tours, museum digitization, and interactive theme park attractions. USA cultural institutions are rapidly deploying AR apps to increase visitor engagement, expand accessibility, and integrate gamified learning experiences. The tourism sector is also seeing collaborations with start-ups and AR content developers to design more immersive experiences for both domestic and international travelers.

  • Museums and heritage sites are leading adopters, using AR to enrich cultural storytelling.
  • Theme parks and attractions are integrating AR overlays for gamified and interactive entertainment.
  • Travel agencies and DMCs are partnering with AR platforms to offer packaged digital-physical tourism experiences.

Growth and Expansion Outlook for AR Tour Services Market in the United Kingdom

The AR Tour Services Market in the United Kingdom is expected to grow at a CAGR of 12.9% from 2025 to 2035, supported by strong adoption in museums, heritage sites, and cultural tourism. The UK has been at the forefront of digitizing artifacts and historical landmarks, enabling interactive storytelling and long-term digital preservation. Major cities are also integrating AR into walking tours and urban exploration, enhancing both domestic and inbound tourist experiences.

Beyond cultural applications, theme parks and attractions are deploying AR overlays to enrich visitor engagement through gamified entertainment. Educational institutions are incorporating AR-based city history tours and museum experiences into student programs, creating a broader base of recurring users. Government-backed innovation grants and collaborations between universities, cultural bodies, and private AR developers are fueling both enterprise and public-sector adoption.

  • Museums and heritage sites are digitizing collections to create immersive AR archives.
  • City walking tours are using AR to enhance cultural storytelling and attract international visitors.
  • Theme parks and attractions are expanding AR features for gamified and interactive tourism.

Growth and Expansion Outlook for AR Tour Services Market in India

India is witnessing rapid expansion in the AR Tour Services Market, forecast to grow at a 22.3% CAGR through 2035, the fastest among major economies. Growth is fueled by the digitization of museums, monuments, and cultural heritage sites, which are integrating AR overlays to bring history to life for visitors. Tier-2 and tier-3 cities are seeing rising adoption as affordable AR solutions and increased smartphone penetration enable broader accessibility beyond metro hubs.

The educational sector is playing a key role, with universities and training institutes deploying AR for interactive learning and virtual field trips, strengthening long-term adoption. Tourism boards and public infrastructure agencies are also investing in AR-based guides for national monuments and archaeological sites, creating immersive storytelling experiences for both domestic and international travelers. Private-sector initiatives from travel agencies and AR start-ups are complementing these efforts, expanding the user base to students, local explorers, and cultural tourists.

  • Adoption in tier-2 and tier-3 cities is rising due to affordable mobile-led AR experiences.
  • Tourism boards are digitizing monuments and heritage sites to attract global visitors.
  • Educational institutions are integrating AR tours into curricula, preparing future generations for digital tourism ecosystems.

Sales Outlook for AR Tour Services in China

The AR Tour Services Market in China is expected to grow at a CAGR of 19.9% between 2025 and 2035, the highest among leading economies. This momentum is driven by the government’s strong focus on cultural digitization, smart tourism, and heritage preservation projects, which integrate AR into museums, historical landmarks, and urban attractions. Major cities are rolling out AR-enabled city walking tours, while theme parks and entertainment hubs are deploying immersive AR overlays to enhance visitor engagement.

Domestic AR technology firms are playing a crucial role by offering affordable, multilingual, and localized AR apps, enabling mass adoption across tourists and local explorers. Municipal governments are also encouraging the integration of AR into public tourism platforms, creating digital twins of heritage sites for global visibility. The educational sector further accelerates adoption, with AR used in history education, archaeology, and student field trips.
  • Cultural digitization programs are boosting AR adoption in museums and heritage sites.
  • AR walking tours in major cities are transforming urban exploration for tourists and residents alike.
  • Domestic AR firms provide cost-effective, localized solutions, fueling large-scale adoption across sectors.

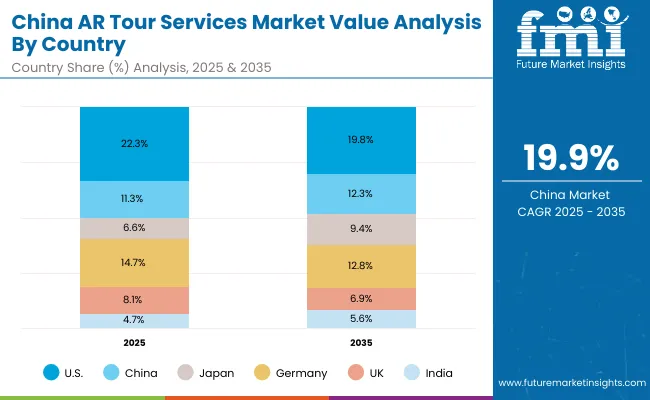
Sales Outlook for AR Tour Services in China

Ar Tour Services Market China

Countries 2025 Share (%)
USA 22.3%
China 11.3%
Japan 6.6%
Germany 14.7%
UK 8.1%
India 4.7%
Countries 2035 Share (%)
USA 19.8%
China 12.3%
Japan 9.4%
Germany 12.8%
UK 6.9%
India 5.6%

The AR Tour Services Market in China is expected to grow at a CAGR of 19.9% between 2025 and 2035, the highest among leading economies. Growth is propelled by the government’s strong commitment to cultural digitization, smart tourism, and heritage preservation projects, which are embedding AR experiences into museums, historical landmarks, and urban attractions. Major metropolitan areas are deploying AR-enabled city walking tours, while theme parks and entertainment hubs are integrating immersive AR overlays to enrich visitor engagement.

Domestic AR technology firms are a key growth driver, offering affordable, multilingual, and localized AR applications, ensuring adoption among both international tourists and local explorers. Municipal governments are also promoting AR integration into public tourism platforms, creating digital twins of heritage sites for enhanced global visibility. Additionally, AR adoption is accelerating in the education sector, where it is applied in history lessons, archaeology programs, and student field trips.
  • Cultural digitization programs are boosting AR adoption in museums and heritage sites.
  • AR walking tours in major cities are transforming urban exploration for tourists and residents alike.
  • Domestic AR firms provide cost-effective, localized solutions, fueling large-scale adoption across sectors.

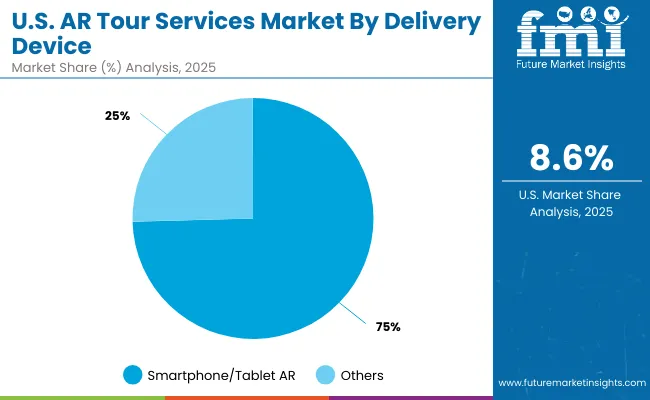
Growth Outlook for AR Tour Services Market in USA

Ar Tour Services Market Usa 2

USA by User Group Value Share% 2025
smartphone/tablet AR 75%
Others 25%

The AR Tour Services Market in the United States is projected at USD 585.7 million in 2025, expanding at a CAGR of 8.6% through 2035 to reach nearly USD 2.0 billion. Growth is being driven by the rapid integration of AR into museums, cultural institutions, and city walking tours, alongside increased adoption in theme parks and entertainment venues. The USA is also at the forefront of AR platform innovation, with domestic start-ups and global leaders creating interactive cultural storytelling and tourism apps.

Unlike hardware-heavy markets, growth in the USA is being shaped by platform-driven services, where cloud integration and AI-powered personalization enhance the visitor journey. The market is also supported by subscription and bundled passes, increasingly offered by travel agencies and destination management companies (DMCs). By 2035, the USA will continue to hold a significant global share despite faster growth in Asia-Pacific, as its strength lies in content innovation, high tourist inflows, and a strong ecosystem of AR developers.
  • Market in the USA is valued at USD 585.7 million in 2025, with steady CAGR of 8.6%.
  • Museums and theme parks dominate adoption, driving cultural and entertainment AR demand.
  • Cloud-based platforms and subscription models are reshaping AR tour monetization strategies.

Opportunity Analysis of China AR Tour Services Market

Ar Tour Services Market China 2

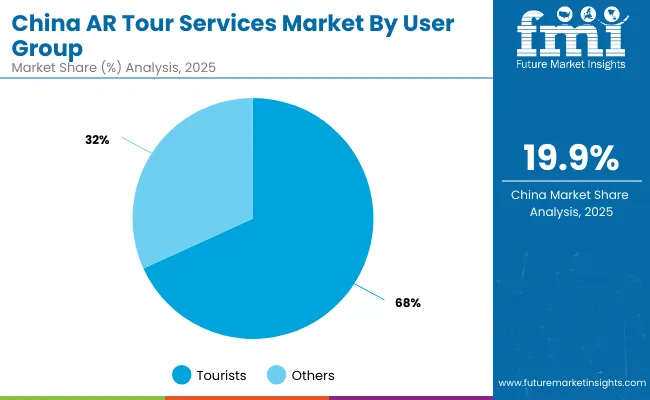
China by User Group Value Share% 2025
Tourists 68.2%
Others 31.8%

The AR Tour Services Market in China is valued at USD 276.9 million in 2025, making it one of the fastest-expanding markets globally with a 19.9% CAGR. The dominance of AR adoption in China is directly tied to the country’s cultural digitization programs, smart tourism projects, and urban AR walking tours, which are transforming how tourists and locals engage with history and entertainment. Domestic AR platforms are leading in multilingual capabilities, localized storytelling, and integration with super-app ecosystems, creating a distinct competitive advantage.

This positions China as a global leader in immersive tourism experiences, particularly through the rollout of AI-enhanced AR apps, cloud-based content distribution, and affordable smartphone/tablet AR solutions. While AR smart glasses adoption remains nascent, China’s ecosystem of low-cost device manufacturing is expected to accelerate uptake in the latter half of the forecast period. With government-backed innovation frameworks, China is poised to expand its global influence in AR-enabled tourism.
  • Market size for China in 2025 is USD 276.9 million.
  • Global market share is approximately 11.3% in 2025, rising to 12.3% by 2035.
  • Tourists dominate adoption, with AR city tours and heritage experiences as primary use cases.

Competitive Landscape of AR Tour Services Market

Ar Tour Services Market By Company

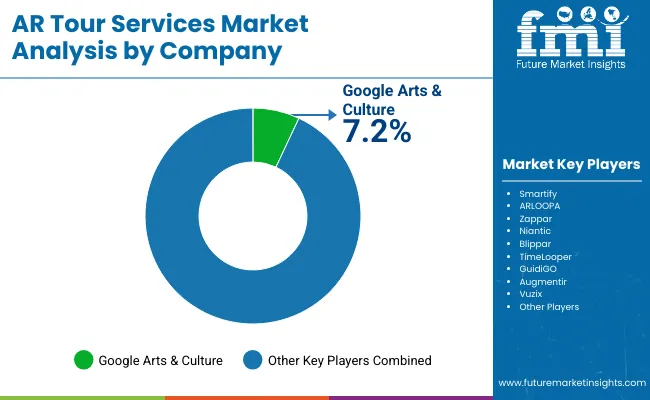
The AR Tour Services Market is moderately fragmented, with global leaders, mid-sized innovators, and niche-focused specialists competing across diverse applications such as museums, city tours, theme parks, and heritage preservation. Global players like Google Arts & Culture and Niantic hold significant visibility, driven by extensive content libraries, platform reach, and collaborations with cultural institutions. Their strategies increasingly emphasize AI-driven personalization, multilingual accessibility, and cloud-based AR platforms that scale across global tourist markets.

Mid-sized innovators such as Smartify, ARLOOPA, and Zappar cater to demand for portable, user-friendly AR experiences that integrate seamlessly into museums, galleries, and walking tours. These companies are accelerating adoption through partnerships with local institutions and travel agencies, making AR services accessible to both tourists and students.

Specialized providers like TimeLooper and GuidiGO focus on niche applications in historical reconstruction, cultural storytelling, and immersive education, offering customized experiences tailored to heritage bodies and smaller tourism operators. Their strength lies in content customization and regional adaptability, rather than global scale. Competitive differentiation is shifting away from device-led adoption toward platform ecosystems, where immersive AR content, subscription-based pricing models, and cross-sector partnerships define market leadership.

Key Developments in AR Tour Services Market

  • In 2025, the UK inaugurated the S&DR Trail of Discovery, a nine-mile interactive walking and cycling path commemorating the 200th anniversary of the Stockton & Darlington Railway. The trail features an augmented reality (AR) game that immerses visitors in the history of early railway infrastructure. The project includes digital overlays at historic sites such as the world’s oldest railway station, integrating heritage storytelling with immersive technology.
  • Uttar Pradesh’s tourism department is elevating its global visibility by incorporating AR-based selfie panels and auto-navigation displays at key international tourism expos. At the PATA (Bangkok) and UPITS-2025 events, visitors experienced AR-enhanced displays allowing interactive engagement with cultural heritage and spiritual tourism highlights like the Buddhist Circuit.

Scope of the Report

Item Value
Quantitative Units USD 2,450.6 Million
Application Museums & heritage, City walking tours, Theme parks & attractions, Travel agencies & DMCs
Delivery Device Smartphone/tablet AR, AR smart glasses
User Group Tourists, Students, Local explorers
Pricing Pay-per-tour, Subscription passes
Regions Covered North America, Europe, Asia-Pacific, Latin America, Middle East & Africa
Country Covered United States, Canada, Germany, France, United Kingdom, China, Japan, India, Brazil, South Africa
Key Companies Profiled Google Arts & Culture, Smartify, ARLOOPA, Zappar, Niantic, Blippar, TimeLooper, GuidiGO, Augmentir, Vuzix
Additional Attribut es Dollar sales by delivery device and pricing model, adoption trends in museums, heritage sites, and city walking tours, rising demand for multilingual AR and AI-driven narration, sector-specific growth in theme parks, cultural institutions, and travel agencies, revenue segmentation by tourists, students, and local explorers, integration with AR/VR and digital twin technologies, regional trends influenced by smart tourism and cultural digitization initiatives, and innovations in wearable AR smart glasses and cloud-enabled AR platforms.

Key Segments

By Application:

  • Museums & heritage
  • City walking tours
  • Theme parks & attractions
  • Travel agencies & DMCs

By Delivery Device:

  • Smartphone/tablet AR
  • AR smart glasses

By User Group:

  • Tourists
  • Students
  • Local explorers

By Pricing:

  • Pay-per-tour
  • Subscription passes

By Region:

  • North America
  • Latin America
  • Europe
  • East Asia
  • South Asia & Pacific
  • Middle East and Africa

Table of Content

  1. Executive Summary
    • Global Market Outlook
    • Demand-side Trends
    • Supply-side Trends
    • Technology Roadmap Analysis
    • Analysis and Recommendations
  2. Market Overview
    • Market Coverage / Taxonomy
    • Market Definition / Scope / Limitations
  3. Market Background
    • Market Dynamics
      • Drivers
      • Restraints
      • Opportunity
      • Trends
    • Scenario Forecast
      • Demand in Optimistic Scenario
      • Demand in Likely Scenario
      • Demand in Conservative Scenario
    • Opportunity Map Analysis
    • Product Life Cycle Analysis
    • Supply Chain Analysis
      • Supply Side Participants and their Roles
        • Producers
        • Mid-Level Participants (Traders/ Agents/ Brokers)
        • Wholesalers and Distributors
      • Value Added and Value Created at Node in the Supply Chain
      • List of Raw Material Suppliers
      • List of Existing and Potential Buyer’s
    • Investment Feasibility Matrix
    • Value Chain Analysis
      • Profit Margin Analysis
      • Wholesalers and Distributors
      • Retailers
    • PESTLE and Porter’s Analysis
    • Regulatory Landscape
      • By Key Regions
      • By Key Countries
    • Regional Parent Market Outlook
    • Production and Consumption Statistics
    • Import and Export Statistics
  4. Global Market Analysis 2020 to 2024 and Forecast, 2025 to 2035
    • Historical Market Size Value (USD Million) & Volume (Units) Analysis, 2020 to 2024
    • Current and Future Market Size Value (USD Million) & Volume (Units) Projections, 2025 to 2035
      • Y-o-Y Growth Trend Analysis
      • Absolute $ Opportunity Analysis
  5. Global Market Analysis 2020 to 2024 and Forecast 2025 to 2035, By Application
    • Introduction / Key Findings
    • Historical Market Size Value (USD Million) & Volume (Units) Analysis By Application, 2020 to 2024
    • Current and Future Market Size Value (USD Million) & Volume (Units) Analysis and Forecast By Application, 2025 to 2035
      • Museums & heritage
      • City walking tours
      • Theme parks & attractions
      • Travel agencies & DMCs
    • Y-o-Y Growth Trend Analysis By Application, 2020 to 2024
    • Absolute $ Opportunity Analysis By Application, 2025 to 2035
  6. Global Market Analysis 2020 to 2024 and Forecast 2025 to 2035, By Delivery Device
    • Introduction / Key Findings
    • Historical Market Size Value (USD Million) & Volume (Units) Analysis By Delivery Device, 2020 to 2024
    • Current and Future Market Size Value (USD Million) & Volume (Units) Analysis and Forecast By Delivery Device, 2025 to 2035
      • Smartphone/tablet AR
      • AR smart glasses
    • Y-o-Y Growth Trend Analysis By Delivery Device, 2020 to 2024
    • Absolute $ Opportunity Analysis By Delivery Device, 2025 to 2035
  7. Global Market Analysis 2020 to 2024 and Forecast 2025 to 2035, By User Group
    • Introduction / Key Findings
    • Historical Market Size Value (USD Million) & Volume (Units) Analysis By User Group, 2020 to 2024
    • Current and Future Market Size Value (USD Million) & Volume (Units) Analysis and Forecast By User Group, 2025 to 2035
      • Tourists
      • Students
      • Local explorers
    • Y-o-Y Growth Trend Analysis By User Group, 2020 to 2024
    • Absolute $ Opportunity Analysis By User Group, 2025 to 2035
  8. Global Market Analysis 2020 to 2024 and Forecast 2025 to 2035, By Pricing
    • Introduction / Key Findings
    • Historical Market Size Value (USD Million) & Volume (Units) Analysis By Pricing, 2020 to 2024
    • Current and Future Market Size Value (USD Million) & Volume (Units) Analysis and Forecast By Pricing, 2025 to 2035
      • Pay-per-tour
      • Subscription passes
    • Y-o-Y Growth Trend Analysis By Pricing, 2020 to 2024
    • Absolute $ Opportunity Analysis By Pricing, 2025 to 2035
  9. Global Market Analysis 2020 to 2024 and Forecast 2025 to 2035, By Region
    • Introduction
    • Historical Market Size Value (USD Million) & Volume (Units) Analysis By Region, 2020 to 2024
    • Current Market Size Value (USD Million) & Volume (Units) Analysis and Forecast By Region, 2025 to 2035
      • North America
      • Latin America
      • Europe
      • East Asia
      • South Asia & Pacific
      • Middle East and Africa
    • Market Attractiveness Analysis By Region
  10. North America Market Analysis 2020 to 2024 and Forecast 2025 to 2035, By Country
    • Historical Market Size Value (USD Million) & Volume (Units) Trend Analysis By Market Taxonomy, 2020 to 2024
    • Market Size Value (USD Million) & Volume (Units) Forecast By Market Taxonomy, 2025 to 2035
      • By Country
        • USA
        • Canada
      • By Application
      • By Delivery Device
      • By User Group
      • By Pricing
    • Market Attractiveness Analysis
      • By Country
      • By Application
      • By Delivery Device
      • By User Group
      • By Pricing
    • Key Takeaways
  11. Latin America Market Analysis 2020 to 2024 and Forecast 2025 to 2035, By Country
    • Historical Market Size Value (USD Million) & Volume (Units) Trend Analysis By Market Taxonomy, 2020 to 2024
    • Market Size Value (USD Million) & Volume (Units) Forecast By Market Taxonomy, 2025 to 2035
      • By Country
        • Brazil
        • Mexico
        • Colombia
        • Rest of Latin America
      • By Application
      • By Delivery Device
      • By User Group
      • By Pricing
    • Market Attractiveness Analysis
      • By Country
      • By Application
      • By Delivery Device
      • By User Group
      • By Pricing
    • Key Takeaways
  12. Europe Market Analysis 2020 to 2024 and Forecast 2025 to 2035, By Country
    • Historical Market Size Value (USD Million) & Volume (Units) Trend Analysis By Market Taxonomy, 2020 to 2024
    • Market Size Value (USD Million) & Volume (Units) Forecast By Market Taxonomy, 2025 to 2035
      • By Country
        • Germany
        • UK
        • France
        • Italy
        • Spain
        • Belgium
        • Netherlands
        • Nordic
        • Switzerland
        • Russia
        • Poland
        • Rest of Europe
      • By Application
      • By Delivery Device
      • By User Group
      • By Pricing
    • Market Attractiveness Analysis
      • By Country
      • By Application
      • By Delivery Device
      • By User Group
      • By Pricing
    • Key Takeaways
  13. East Asia Market Analysis 2020 to 2024 and Forecast 2025 to 2035, By Country
    • Historical Market Size Value (USD Million) & Volume (Units) Trend Analysis By Market Taxonomy, 2020 to 2024
    • Market Size Value (USD Million) & Volume (Units) Forecast By Market Taxonomy, 2025 to 2035
      • By Country
        • China
        • Japan
        • South Korea
      • By Application
      • By Delivery Device
      • By User Group
      • By Pricing
    • Market Attractiveness Analysis
      • By Country
      • By Application
      • By Delivery Device
      • By User Group
      • By Pricing
    • Key Takeaways
  14. South Asia & Pacific Market Analysis 2020 to 2024 and Forecast 2025 to 2035, By Country
    • Historical Market Size Value (USD Million) & Volume (Units) Trend Analysis By Market Taxonomy, 2020 to 2024
    • Market Size Value (USD Million) & Volume (Units) Forecast By Market Taxonomy, 2025 to 2035
      • By Country
        • India
        • Thailand
        • Malaysia
        • Indonesia
        • Singapore
        • Vietnam
        • Australia
        • New Zealand
        • Rest of South Asia
      • By Application
      • By Delivery Device
      • By User Group
      • By Pricing
    • Market Attractiveness Analysis
      • By Country
      • By Application
      • By Delivery Device
      • By User Group
      • By Pricing
    • Key Takeaways
  15. Middle East and Africa Market Analysis 2020 to 2024 and Forecast 2025 to 2035, By Country
    • Historical Market Size Value (USD Million) & Volume (Units) Trend Analysis By Market Taxonomy, 2020 to 2024
    • Market Size Value (USD Million) & Volume (Units) Forecast By Market Taxonomy, 2025 to 2035
      • By Country
        • Turkey
        • UAE
        • Saudi Arabia
        • Israel
        • Other GCC Countries
        • North Africa
        • South Africa
      • By Application
      • By Delivery Device
      • By User Group
      • By Pricing
    • Market Attractiveness Analysis
      • By Country
      • By Application
      • By Delivery Device
      • By User Group
      • By Pricing
    • Key Takeaways
  16. Key Countries Market Analysis
    • USA
      • Pricing Analysis
      • Market Share Analysis, 2024
        • By Application
        • By Delivery Device
        • By User Group
        • By Pricing
    • Canada
      • Pricing Analysis
      • Market Share Analysis, 2024
        • By Application
        • By Delivery Device
        • By User Group
        • By Pricing
    • Brazil
      • Pricing Analysis
      • Market Share Analysis, 2024
        • By Application
        • By Delivery Device
        • By User Group
        • By Pricing
    • Mexico
      • Pricing Analysis
      • Market Share Analysis, 2024
        • By Application
        • By Delivery Device
        • By User Group
        • By Pricing
    • Colombia
      • Pricing Analysis
      • Market Share Analysis, 2024
        • By Application
        • By Delivery Device
        • By User Group
        • By Pricing
    • Germany
      • Pricing Analysis
      • Market Share Analysis, 2024
        • By Application
        • By Delivery Device
        • By User Group
        • By Pricing
    • UK
      • Pricing Analysis
      • Market Share Analysis, 2024
        • By Application
        • By Delivery Device
        • By User Group
        • By Pricing
    • France
      • Pricing Analysis
      • Market Share Analysis, 2024
        • By Application
        • By Delivery Device
        • By User Group
        • By Pricing
    • Italy
      • Pricing Analysis
      • Market Share Analysis, 2024
        • By Application
        • By Delivery Device
        • By User Group
        • By Pricing
    • Spain
      • Pricing Analysis
      • Market Share Analysis, 2024
        • By Application
        • By Delivery Device
        • By User Group
        • By Pricing
    • Belgium
      • Pricing Analysis
      • Market Share Analysis, 2024
        • By Application
        • By Delivery Device
        • By User Group
        • By Pricing
    • Netherlands
      • Pricing Analysis
      • Market Share Analysis, 2024
        • By Application
        • By Delivery Device
        • By User Group
        • By Pricing
    • Nordic
      • Pricing Analysis
      • Market Share Analysis, 2024
        • By Application
        • By Delivery Device
        • By User Group
        • By Pricing
    • Switzerland
      • Pricing Analysis
      • Market Share Analysis, 2024
        • By Application
        • By Delivery Device
        • By User Group
        • By Pricing
    • Russia
      • Pricing Analysis
      • Market Share Analysis, 2024
        • By Application
        • By Delivery Device
        • By User Group
        • By Pricing
    • Poland
      • Pricing Analysis
      • Market Share Analysis, 2024
        • By Application
        • By Delivery Device
        • By User Group
        • By Pricing
    • China
      • Pricing Analysis
      • Market Share Analysis, 2024
        • By Application
        • By Delivery Device
        • By User Group
        • By Pricing
    • Japan
      • Pricing Analysis
      • Market Share Analysis, 2024
        • By Application
        • By Delivery Device
        • By User Group
        • By Pricing
    • South Korea
      • Pricing Analysis
      • Market Share Analysis, 2024
        • By Application
        • By Delivery Device
        • By User Group
        • By Pricing
    • India
      • Pricing Analysis
      • Market Share Analysis, 2024
        • By Application
        • By Delivery Device
        • By User Group
        • By Pricing
    • Thailand
      • Pricing Analysis
      • Market Share Analysis, 2024
        • By Application
        • By Delivery Device
        • By User Group
        • By Pricing
    • Indonesia
      • Pricing Analysis
      • Market Share Analysis, 2024
        • By Application
        • By Delivery Device
        • By User Group
        • By Pricing
    • Australia
      • Pricing Analysis
      • Market Share Analysis, 2024
        • By Application
        • By Delivery Device
        • By User Group
        • By Pricing
    • New Zealand
      • Pricing Analysis
      • Market Share Analysis, 2024
        • By Application
        • By Delivery Device
        • By User Group
        • By Pricing
    • Turkey
      • Pricing Analysis
      • Market Share Analysis, 2024
        • By Application
        • By Delivery Device
        • By User Group
        • By Pricing
    • UAE
      • Pricing Analysis
      • Market Share Analysis, 2024
        • By Application
        • By Delivery Device
        • By User Group
        • By Pricing
    • Saudi Arabia
      • Pricing Analysis
      • Market Share Analysis, 2024
        • By Application
        • By Delivery Device
        • By User Group
        • By Pricing
    • Israel
      • Pricing Analysis
      • Market Share Analysis, 2024
        • By Application
        • By Delivery Device
        • By User Group
        • By Pricing
    • North Africa
      • Pricing Analysis
      • Market Share Analysis, 2024
        • By Application
        • By Delivery Device
        • By User Group
        • By Pricing
    • South Africa
      • Pricing Analysis
      • Market Share Analysis, 2024
        • By Application
        • By Delivery Device
        • By User Group
        • By Pricing
  17. Market Structure Analysis
    • Competition Dashboard
    • Competition Benchmarking
    • Market Share Analysis of Top Players
      • By Regional
      • By Application
      • By Delivery Device
      • By User Group
      • By Pricing
  18. Competition Analysis
    • Competition Deep Dive
      • Google Arts & Culture
        • Overview
        • Product Portfolio
        • Profitability by Market Segments (Product/Age /Sales Channel/Region)
        • Sales Footprint
        • Strategy Overview
          • Marketing Strategy
          • Product Strategy
          • Channel Strategy
      • Smartify
        • Overview
        • Product Portfolio
        • Profitability by Market Segments (Product/Age /Sales Channel/Region)
        • Sales Footprint
        • Strategy Overview
          • Marketing Strategy
          • Product Strategy
          • Channel Strategy
      • ARLOOPA
        • Overview
        • Product Portfolio
        • Profitability by Market Segments (Product/Age /Sales Channel/Region)
        • Sales Footprint
        • Strategy Overview
          • Marketing Strategy
          • Product Strategy
          • Channel Strategy
      • Zappar
        • Overview
        • Product Portfolio
        • Profitability by Market Segments (Product/Age /Sales Channel/Region)
        • Sales Footprint
        • Strategy Overview
          • Marketing Strategy
          • Product Strategy
          • Channel Strategy
      • Niantic
        • Overview
        • Product Portfolio
        • Profitability by Market Segments (Product/Age /Sales Channel/Region)
        • Sales Footprint
        • Strategy Overview
          • Marketing Strategy
          • Product Strategy
          • Channel Strategy
      • Blippar
        • Overview
        • Product Portfolio
        • Profitability by Market Segments (Product/Age /Sales Channel/Region)
        • Sales Footprint
        • Strategy Overview
          • Marketing Strategy
          • Product Strategy
          • Channel Strategy
      • TimeLooper
        • Overview
        • Product Portfolio
        • Profitability by Market Segments (Product/Age /Sales Channel/Region)
        • Sales Footprint
        • Strategy Overview
          • Marketing Strategy
          • Product Strategy
          • Channel Strategy
      • GuidiGO
        • Overview
        • Product Portfolio
        • Profitability by Market Segments (Product/Age /Sales Channel/Region)
        • Sales Footprint
        • Strategy Overview
          • Marketing Strategy
          • Product Strategy
          • Channel Strategy
      • Augmentir
        • Overview
        • Product Portfolio
        • Profitability by Market Segments (Product/Age /Sales Channel/Region)
        • Sales Footprint
        • Strategy Overview
          • Marketing Strategy
          • Product Strategy
          • Channel Strategy
      • Vuzix
        • Overview
        • Product Portfolio
        • Profitability by Market Segments (Product/Age /Sales Channel/Region)
        • Sales Footprint
        • Strategy Overview
          • Marketing Strategy
          • Product Strategy
          • Channel Strategy
      • Others
        • Overview
        • Product Portfolio
        • Profitability by Market Segments (Product/Age /Sales Channel/Region)
        • Sales Footprint
        • Strategy Overview
          • Marketing Strategy
          • Product Strategy
          • Channel Strategy
  19. Assumptions & Acronyms Used
  20. Research Methodology

List of Tables

  • Table 1: Global Market Value (USD Million) Forecast by Region, 2020-2035
  • Table 2: Global Market Volume (Units) Forecast by Region, 2020-2035
  • Table 3: Global Market Value (USD Million) Forecast by Application, 2020-2035
  • Table 4: Global Market Volume (Units) Forecast by Application, 2020-2035
  • Table 5: Global Market Value (USD Million) Forecast by Delivery Device, 2020-2035
  • Table 6: Global Market Volume (Units) Forecast by Delivery Device, 2020-2035
  • Table 7: Global Market Value (USD Million) Forecast by User Group, 2020-2035
  • Table 8: Global Market Volume (Units) Forecast by User Group, 2020-2035
  • Table 9: Global Market Value (USD Million) Forecast by Pricing, 2020-2035
  • Table 10: Global Market Volume (Units) Forecast by Pricing, 2020-2035
  • Table 11: North America Market Value (USD Million) Forecast by Country, 2020-2035
  • Table 12: North America Market Volume (Units) Forecast by Country, 2020-2035
  • Table 13: North America Market Value (USD Million) Forecast by Application, 2020-2035
  • Table 14: North America Market Volume (Units) Forecast by Application, 2020-2035
  • Table 15: North America Market Value (USD Million) Forecast by Delivery Device, 2020-2035
  • Table 16: North America Market Volume (Units) Forecast by Delivery Device, 2020-2035
  • Table 17: North America Market Value (USD Million) Forecast by User Group, 2020-2035
  • Table 18: North America Market Volume (Units) Forecast by User Group, 2020-2035
  • Table 19: North America Market Value (USD Million) Forecast by Pricing, 2020-2035
  • Table 20: North America Market Volume (Units) Forecast by Pricing, 2020-2035
  • Table 21: Latin America Market Value (USD Million) Forecast by Country, 2020-2035
  • Table 22: Latin America Market Volume (Units) Forecast by Country, 2020-2035
  • Table 23: Latin America Market Value (USD Million) Forecast by Application, 2020-2035
  • Table 24: Latin America Market Volume (Units) Forecast by Application, 2020-2035
  • Table 25: Latin America Market Value (USD Million) Forecast by Delivery Device, 2020-2035
  • Table 26: Latin America Market Volume (Units) Forecast by Delivery Device, 2020-2035
  • Table 27: Latin America Market Value (USD Million) Forecast by User Group, 2020-2035
  • Table 28: Latin America Market Volume (Units) Forecast by User Group, 2020-2035
  • Table 29: Latin America Market Value (USD Million) Forecast by Pricing, 2020-2035
  • Table 30: Latin America Market Volume (Units) Forecast by Pricing, 2020-2035
  • Table 31: Europe Market Value (USD Million) Forecast by Country, 2020-2035
  • Table 32: Europe Market Volume (Units) Forecast by Country, 2020-2035
  • Table 33: Europe Market Value (USD Million) Forecast by Application, 2020-2035
  • Table 34: Europe Market Volume (Units) Forecast by Application, 2020-2035
  • Table 35: Europe Market Value (USD Million) Forecast by Delivery Device, 2020-2035
  • Table 36: Europe Market Volume (Units) Forecast by Delivery Device, 2020-2035
  • Table 37: Europe Market Value (USD Million) Forecast by User Group, 2020-2035
  • Table 38: Europe Market Volume (Units) Forecast by User Group, 2020-2035
  • Table 39: Europe Market Value (USD Million) Forecast by Pricing, 2020-2035
  • Table 40: Europe Market Volume (Units) Forecast by Pricing, 2020-2035
  • Table 41: East Asia Market Value (USD Million) Forecast by Country, 2020-2035
  • Table 42: East Asia Market Volume (Units) Forecast by Country, 2020-2035
  • Table 43: East Asia Market Value (USD Million) Forecast by Application, 2020-2035
  • Table 44: East Asia Market Volume (Units) Forecast by Application, 2020-2035
  • Table 45: East Asia Market Value (USD Million) Forecast by Delivery Device, 2020-2035
  • Table 46: East Asia Market Volume (Units) Forecast by Delivery Device, 2020-2035
  • Table 47: East Asia Market Value (USD Million) Forecast by User Group, 2020-2035
  • Table 48: East Asia Market Volume (Units) Forecast by User Group, 2020-2035
  • Table 49: East Asia Market Value (USD Million) Forecast by Pricing, 2020-2035
  • Table 50: East Asia Market Volume (Units) Forecast by Pricing, 2020-2035
  • Table 51: South Asia & Pacific Market Value (USD Million) Forecast by Country, 2020-2035
  • Table 52: South Asia & Pacific Market Volume (Units) Forecast by Country, 2020-2035
  • Table 53: South Asia & Pacific Market Value (USD Million) Forecast by Application, 2020-2035
  • Table 54: South Asia & Pacific Market Volume (Units) Forecast by Application, 2020-2035
  • Table 55: South Asia & Pacific Market Value (USD Million) Forecast by Delivery Device, 2020-2035
  • Table 56: South Asia & Pacific Market Volume (Units) Forecast by Delivery Device, 2020-2035
  • Table 57: South Asia & Pacific Market Value (USD Million) Forecast by User Group, 2020-2035
  • Table 58: South Asia & Pacific Market Volume (Units) Forecast by User Group, 2020-2035
  • Table 59: South Asia & Pacific Market Value (USD Million) Forecast by Pricing, 2020-2035
  • Table 60: South Asia & Pacific Market Volume (Units) Forecast by Pricing, 2020-2035
  • Table 61: Middle East and Africa Market Value (USD Million) Forecast by Country, 2020-2035
  • Table 62: Middle East and Africa Market Volume (Units) Forecast by Country, 2020-2035
  • Table 63: Middle East and Africa Market Value (USD Million) Forecast by Application, 2020-2035
  • Table 64: Middle East and Africa Market Volume (Units) Forecast by Application, 2020-2035
  • Table 65: Middle East and Africa Market Value (USD Million) Forecast by Delivery Device, 2020-2035
  • Table 66: Middle East and Africa Market Volume (Units) Forecast by Delivery Device, 2020-2035
  • Table 67: Middle East and Africa Market Value (USD Million) Forecast by User Group, 2020-2035
  • Table 68: Middle East and Africa Market Volume (Units) Forecast by User Group, 2020-2035
  • Table 69: Middle East and Africa Market Value (USD Million) Forecast by Pricing, 2020-2035
  • Table 70: Middle East and Africa Market Volume (Units) Forecast by Pricing, 2020-2035

List of Figures

  • Figure 1: Global Market Value (USD Million) by Application, 2025-2035
  • Figure 2: Global Market Value (USD Million) by Delivery Device, 2025-2035
  • Figure 3: Global Market Value (USD Million) by User Group, 2025-2035
  • Figure 4: Global Market Value (USD Million) by Pricing, 2025-2035
  • Figure 5: Global Market Value (USD Million) by Region, 2025-2035
  • Figure 6: Global Market Value (USD Million) Analysis by Region, 2020-2035
  • Figure 7: Global Market Volume (Units) Analysis by Region, 2020-2035
  • Figure 8: Global Market Value Share (%) and BPS Analysis by Region, 2025-2035
  • Figure 9: Global Market Y-o-Y Growth (%) Projections by Region, 2025-2035
  • Figure 10: Global Market Value (USD Million) Analysis by Application, 2020-2035
  • Figure 11: Global Market Volume (Units) Analysis by Application, 2020-2035
  • Figure 12: Global Market Value Share (%) and BPS Analysis by Application, 2025-2035
  • Figure 13: Global Market Y-o-Y Growth (%) Projections by Application, 2025-2035
  • Figure 14: Global Market Value (USD Million) Analysis by Delivery Device, 2020-2035
  • Figure 15: Global Market Volume (Units) Analysis by Delivery Device, 2020-2035
  • Figure 16: Global Market Value Share (%) and BPS Analysis by Delivery Device, 2025-2035
  • Figure 17: Global Market Y-o-Y Growth (%) Projections by Delivery Device, 2025-2035
  • Figure 18: Global Market Value (USD Million) Analysis by User Group, 2020-2035
  • Figure 19: Global Market Volume (Units) Analysis by User Group, 2020-2035
  • Figure 20: Global Market Value Share (%) and BPS Analysis by User Group, 2025-2035
  • Figure 21: Global Market Y-o-Y Growth (%) Projections by User Group, 2025-2035
  • Figure 22: Global Market Value (USD Million) Analysis by Pricing, 2020-2035
  • Figure 23: Global Market Volume (Units) Analysis by Pricing, 2020-2035
  • Figure 24: Global Market Value Share (%) and BPS Analysis by Pricing, 2025-2035
  • Figure 25: Global Market Y-o-Y Growth (%) Projections by Pricing, 2025-2035
  • Figure 26: Global Market Attractiveness by Application, 2025-2035
  • Figure 27: Global Market Attractiveness by Delivery Device, 2025-2035
  • Figure 28: Global Market Attractiveness by User Group, 2025-2035
  • Figure 29: Global Market Attractiveness by Pricing, 2025-2035
  • Figure 30: Global Market Attractiveness by Region, 2025-2035
  • Figure 31: North America Market Value (USD Million) by Application, 2025-2035
  • Figure 32: North America Market Value (USD Million) by Delivery Device, 2025-2035
  • Figure 33: North America Market Value (USD Million) by User Group, 2025-2035
  • Figure 34: North America Market Value (USD Million) by Pricing, 2025-2035
  • Figure 35: North America Market Value (USD Million) by Country, 2025-2035
  • Figure 36: North America Market Value (USD Million) Analysis by Country, 2020-2035
  • Figure 37: North America Market Volume (Units) Analysis by Country, 2020-2035
  • Figure 38: North America Market Value Share (%) and BPS Analysis by Country, 2025-2035
  • Figure 39: North America Market Y-o-Y Growth (%) Projections by Country, 2025-2035
  • Figure 40: North America Market Value (USD Million) Analysis by Application, 2020-2035
  • Figure 41: North America Market Volume (Units) Analysis by Application, 2020-2035
  • Figure 42: North America Market Value Share (%) and BPS Analysis by Application, 2025-2035
  • Figure 43: North America Market Y-o-Y Growth (%) Projections by Application, 2025-2035
  • Figure 44: North America Market Value (USD Million) Analysis by Delivery Device, 2020-2035
  • Figure 45: North America Market Volume (Units) Analysis by Delivery Device, 2020-2035
  • Figure 46: North America Market Value Share (%) and BPS Analysis by Delivery Device, 2025-2035
  • Figure 47: North America Market Y-o-Y Growth (%) Projections by Delivery Device, 2025-2035
  • Figure 48: North America Market Value (USD Million) Analysis by User Group, 2020-2035
  • Figure 49: North America Market Volume (Units) Analysis by User Group, 2020-2035
  • Figure 50: North America Market Value Share (%) and BPS Analysis by User Group, 2025-2035
  • Figure 51: North America Market Y-o-Y Growth (%) Projections by User Group, 2025-2035
  • Figure 52: North America Market Value (USD Million) Analysis by Pricing, 2020-2035
  • Figure 53: North America Market Volume (Units) Analysis by Pricing, 2020-2035
  • Figure 54: North America Market Value Share (%) and BPS Analysis by Pricing, 2025-2035
  • Figure 55: North America Market Y-o-Y Growth (%) Projections by Pricing, 2025-2035
  • Figure 56: North America Market Attractiveness by Application, 2025-2035
  • Figure 57: North America Market Attractiveness by Delivery Device, 2025-2035
  • Figure 58: North America Market Attractiveness by User Group, 2025-2035
  • Figure 59: North America Market Attractiveness by Pricing, 2025-2035
  • Figure 60: North America Market Attractiveness by Country, 2025-2035
  • Figure 61: Latin America Market Value (USD Million) by Application, 2025-2035
  • Figure 62: Latin America Market Value (USD Million) by Delivery Device, 2025-2035
  • Figure 63: Latin America Market Value (USD Million) by User Group, 2025-2035
  • Figure 64: Latin America Market Value (USD Million) by Pricing, 2025-2035
  • Figure 65: Latin America Market Value (USD Million) by Country, 2025-2035
  • Figure 66: Latin America Market Value (USD Million) Analysis by Country, 2020-2035
  • Figure 67: Latin America Market Volume (Units) Analysis by Country, 2020-2035
  • Figure 68: Latin America Market Value Share (%) and BPS Analysis by Country, 2025-2035
  • Figure 69: Latin America Market Y-o-Y Growth (%) Projections by Country, 2025-2035
  • Figure 70: Latin America Market Value (USD Million) Analysis by Application, 2020-2035
  • Figure 71: Latin America Market Volume (Units) Analysis by Application, 2020-2035
  • Figure 72: Latin America Market Value Share (%) and BPS Analysis by Application, 2025-2035
  • Figure 73: Latin America Market Y-o-Y Growth (%) Projections by Application, 2025-2035
  • Figure 74: Latin America Market Value (USD Million) Analysis by Delivery Device, 2020-2035
  • Figure 75: Latin America Market Volume (Units) Analysis by Delivery Device, 2020-2035
  • Figure 76: Latin America Market Value Share (%) and BPS Analysis by Delivery Device, 2025-2035
  • Figure 77: Latin America Market Y-o-Y Growth (%) Projections by Delivery Device, 2025-2035
  • Figure 78: Latin America Market Value (USD Million) Analysis by User Group, 2020-2035
  • Figure 79: Latin America Market Volume (Units) Analysis by User Group, 2020-2035
  • Figure 80: Latin America Market Value Share (%) and BPS Analysis by User Group, 2025-2035
  • Figure 81: Latin America Market Y-o-Y Growth (%) Projections by User Group, 2025-2035
  • Figure 82: Latin America Market Value (USD Million) Analysis by Pricing, 2020-2035
  • Figure 83: Latin America Market Volume (Units) Analysis by Pricing, 2020-2035
  • Figure 84: Latin America Market Value Share (%) and BPS Analysis by Pricing, 2025-2035
  • Figure 85: Latin America Market Y-o-Y Growth (%) Projections by Pricing, 2025-2035
  • Figure 86: Latin America Market Attractiveness by Application, 2025-2035
  • Figure 87: Latin America Market Attractiveness by Delivery Device, 2025-2035
  • Figure 88: Latin America Market Attractiveness by User Group, 2025-2035
  • Figure 89: Latin America Market Attractiveness by Pricing, 2025-2035
  • Figure 90: Latin America Market Attractiveness by Country, 2025-2035
  • Figure 91: Europe Market Value (USD Million) by Application, 2025-2035
  • Figure 92: Europe Market Value (USD Million) by Delivery Device, 2025-2035
  • Figure 93: Europe Market Value (USD Million) by User Group, 2025-2035
  • Figure 94: Europe Market Value (USD Million) by Pricing, 2025-2035
  • Figure 95: Europe Market Value (USD Million) by Country, 2025-2035
  • Figure 96: Europe Market Value (USD Million) Analysis by Country, 2020-2035
  • Figure 97: Europe Market Volume (Units) Analysis by Country, 2020-2035
  • Figure 98: Europe Market Value Share (%) and BPS Analysis by Country, 2025-2035
  • Figure 99: Europe Market Y-o-Y Growth (%) Projections by Country, 2025-2035
  • Figure 100: Europe Market Value (USD Million) Analysis by Application, 2020-2035
  • Figure 101: Europe Market Volume (Units) Analysis by Application, 2020-2035
  • Figure 102: Europe Market Value Share (%) and BPS Analysis by Application, 2025-2035
  • Figure 103: Europe Market Y-o-Y Growth (%) Projections by Application, 2025-2035
  • Figure 104: Europe Market Value (USD Million) Analysis by Delivery Device, 2020-2035
  • Figure 105: Europe Market Volume (Units) Analysis by Delivery Device, 2020-2035
  • Figure 106: Europe Market Value Share (%) and BPS Analysis by Delivery Device, 2025-2035
  • Figure 107: Europe Market Y-o-Y Growth (%) Projections by Delivery Device, 2025-2035
  • Figure 108: Europe Market Value (USD Million) Analysis by User Group, 2020-2035
  • Figure 109: Europe Market Volume (Units) Analysis by User Group, 2020-2035
  • Figure 110: Europe Market Value Share (%) and BPS Analysis by User Group, 2025-2035
  • Figure 111: Europe Market Y-o-Y Growth (%) Projections by User Group, 2025-2035
  • Figure 112: Europe Market Value (USD Million) Analysis by Pricing, 2020-2035
  • Figure 113: Europe Market Volume (Units) Analysis by Pricing, 2020-2035
  • Figure 114: Europe Market Value Share (%) and BPS Analysis by Pricing, 2025-2035
  • Figure 115: Europe Market Y-o-Y Growth (%) Projections by Pricing, 2025-2035
  • Figure 116: Europe Market Attractiveness by Application, 2025-2035
  • Figure 117: Europe Market Attractiveness by Delivery Device, 2025-2035
  • Figure 118: Europe Market Attractiveness by User Group, 2025-2035
  • Figure 119: Europe Market Attractiveness by Pricing, 2025-2035
  • Figure 120: Europe Market Attractiveness by Country, 2025-2035
  • Figure 121: East Asia Market Value (USD Million) by Application, 2025-2035
  • Figure 122: East Asia Market Value (USD Million) by Delivery Device, 2025-2035
  • Figure 123: East Asia Market Value (USD Million) by User Group, 2025-2035
  • Figure 124: East Asia Market Value (USD Million) by Pricing, 2025-2035
  • Figure 125: East Asia Market Value (USD Million) by Country, 2025-2035
  • Figure 126: East Asia Market Value (USD Million) Analysis by Country, 2020-2035
  • Figure 127: East Asia Market Volume (Units) Analysis by Country, 2020-2035
  • Figure 128: East Asia Market Value Share (%) and BPS Analysis by Country, 2025-2035
  • Figure 129: East Asia Market Y-o-Y Growth (%) Projections by Country, 2025-2035
  • Figure 130: East Asia Market Value (USD Million) Analysis by Application, 2020-2035
  • Figure 131: East Asia Market Volume (Units) Analysis by Application, 2020-2035
  • Figure 132: East Asia Market Value Share (%) and BPS Analysis by Application, 2025-2035
  • Figure 133: East Asia Market Y-o-Y Growth (%) Projections by Application, 2025-2035
  • Figure 134: East Asia Market Value (USD Million) Analysis by Delivery Device, 2020-2035
  • Figure 135: East Asia Market Volume (Units) Analysis by Delivery Device, 2020-2035
  • Figure 136: East Asia Market Value Share (%) and BPS Analysis by Delivery Device, 2025-2035
  • Figure 137: East Asia Market Y-o-Y Growth (%) Projections by Delivery Device, 2025-2035
  • Figure 138: East Asia Market Value (USD Million) Analysis by User Group, 2020-2035
  • Figure 139: East Asia Market Volume (Units) Analysis by User Group, 2020-2035
  • Figure 140: East Asia Market Value Share (%) and BPS Analysis by User Group, 2025-2035
  • Figure 141: East Asia Market Y-o-Y Growth (%) Projections by User Group, 2025-2035
  • Figure 142: East Asia Market Value (USD Million) Analysis by Pricing, 2020-2035
  • Figure 143: East Asia Market Volume (Units) Analysis by Pricing, 2020-2035
  • Figure 144: East Asia Market Value Share (%) and BPS Analysis by Pricing, 2025-2035
  • Figure 145: East Asia Market Y-o-Y Growth (%) Projections by Pricing, 2025-2035
  • Figure 146: East Asia Market Attractiveness by Application, 2025-2035
  • Figure 147: East Asia Market Attractiveness by Delivery Device, 2025-2035
  • Figure 148: East Asia Market Attractiveness by User Group, 2025-2035
  • Figure 149: East Asia Market Attractiveness by Pricing, 2025-2035
  • Figure 150: East Asia Market Attractiveness by Country, 2025-2035
  • Figure 151: South Asia & Pacific Market Value (USD Million) by Application, 2025-2035
  • Figure 152: South Asia & Pacific Market Value (USD Million) by Delivery Device, 2025-2035
  • Figure 153: South Asia & Pacific Market Value (USD Million) by User Group, 2025-2035
  • Figure 154: South Asia & Pacific Market Value (USD Million) by Pricing, 2025-2035
  • Figure 155: South Asia & Pacific Market Value (USD Million) by Country, 2025-2035
  • Figure 156: South Asia & Pacific Market Value (USD Million) Analysis by Country, 2020-2035
  • Figure 157: South Asia & Pacific Market Volume (Units) Analysis by Country, 2020-2035
  • Figure 158: South Asia & Pacific Market Value Share (%) and BPS Analysis by Country, 2025-2035
  • Figure 159: South Asia & Pacific Market Y-o-Y Growth (%) Projections by Country, 2025-2035
  • Figure 160: South Asia & Pacific Market Value (USD Million) Analysis by Application, 2020-2035
  • Figure 161: South Asia & Pacific Market Volume (Units) Analysis by Application, 2020-2035
  • Figure 162: South Asia & Pacific Market Value Share (%) and BPS Analysis by Application, 2025-2035
  • Figure 163: South Asia & Pacific Market Y-o-Y Growth (%) Projections by Application, 2025-2035
  • Figure 164: South Asia & Pacific Market Value (USD Million) Analysis by Delivery Device, 2020-2035
  • Figure 165: South Asia & Pacific Market Volume (Units) Analysis by Delivery Device, 2020-2035
  • Figure 166: South Asia & Pacific Market Value Share (%) and BPS Analysis by Delivery Device, 2025-2035
  • Figure 167: South Asia & Pacific Market Y-o-Y Growth (%) Projections by Delivery Device, 2025-2035
  • Figure 168: South Asia & Pacific Market Value (USD Million) Analysis by User Group, 2020-2035
  • Figure 169: South Asia & Pacific Market Volume (Units) Analysis by User Group, 2020-2035
  • Figure 170: South Asia & Pacific Market Value Share (%) and BPS Analysis by User Group, 2025-2035
  • Figure 171: South Asia & Pacific Market Y-o-Y Growth (%) Projections by User Group, 2025-2035
  • Figure 172: South Asia & Pacific Market Value (USD Million) Analysis by Pricing, 2020-2035
  • Figure 173: South Asia & Pacific Market Volume (Units) Analysis by Pricing, 2020-2035
  • Figure 174: South Asia & Pacific Market Value Share (%) and BPS Analysis by Pricing, 2025-2035
  • Figure 175: South Asia & Pacific Market Y-o-Y Growth (%) Projections by Pricing, 2025-2035
  • Figure 176: South Asia & Pacific Market Attractiveness by Application, 2025-2035
  • Figure 177: South Asia & Pacific Market Attractiveness by Delivery Device, 2025-2035
  • Figure 178: South Asia & Pacific Market Attractiveness by User Group, 2025-2035
  • Figure 179: South Asia & Pacific Market Attractiveness by Pricing, 2025-2035
  • Figure 180: South Asia & Pacific Market Attractiveness by Country, 2025-2035
  • Figure 181: Middle East and Africa Market Value (USD Million) by Application, 2025-2035
  • Figure 182: Middle East and Africa Market Value (USD Million) by Delivery Device, 2025-2035
  • Figure 183: Middle East and Africa Market Value (USD Million) by User Group, 2025-2035
  • Figure 184: Middle East and Africa Market Value (USD Million) by Pricing, 2025-2035
  • Figure 185: Middle East and Africa Market Value (USD Million) by Country, 2025-2035
  • Figure 186: Middle East and Africa Market Value (USD Million) Analysis by Country, 2020-2035
  • Figure 187: Middle East and Africa Market Volume (Units) Analysis by Country, 2020-2035
  • Figure 188: Middle East and Africa Market Value Share (%) and BPS Analysis by Country, 2025-2035
  • Figure 189: Middle East and Africa Market Y-o-Y Growth (%) Projections by Country, 2025-2035
  • Figure 190: Middle East and Africa Market Value (USD Million) Analysis by Application, 2020-2035
  • Figure 191: Middle East and Africa Market Volume (Units) Analysis by Application, 2020-2035
  • Figure 192: Middle East and Africa Market Value Share (%) and BPS Analysis by Application, 2025-2035
  • Figure 193: Middle East and Africa Market Y-o-Y Growth (%) Projections by Application, 2025-2035
  • Figure 194: Middle East and Africa Market Value (USD Million) Analysis by Delivery Device, 2020-2035
  • Figure 195: Middle East and Africa Market Volume (Units) Analysis by Delivery Device, 2020-2035
  • Figure 196: Middle East and Africa Market Value Share (%) and BPS Analysis by Delivery Device, 2025-2035
  • Figure 197: Middle East and Africa Market Y-o-Y Growth (%) Projections by Delivery Device, 2025-2035
  • Figure 198: Middle East and Africa Market Value (USD Million) Analysis by User Group, 2020-2035
  • Figure 199: Middle East and Africa Market Volume (Units) Analysis by User Group, 2020-2035
  • Figure 200: Middle East and Africa Market Value Share (%) and BPS Analysis by User Group, 2025-2035
  • Figure 201: Middle East and Africa Market Y-o-Y Growth (%) Projections by User Group, 2025-2035
  • Figure 202: Middle East and Africa Market Value (USD Million) Analysis by Pricing, 2020-2035
  • Figure 203: Middle East and Africa Market Volume (Units) Analysis by Pricing, 2020-2035
  • Figure 204: Middle East and Africa Market Value Share (%) and BPS Analysis by Pricing, 2025-2035
  • Figure 205: Middle East and Africa Market Y-o-Y Growth (%) Projections by Pricing, 2025-2035
  • Figure 206: Middle East and Africa Market Attractiveness by Application, 2025-2035
  • Figure 207: Middle East and Africa Market Attractiveness by Delivery Device, 2025-2035
  • Figure 208: Middle East and Africa Market Attractiveness by User Group, 2025-2035
  • Figure 209: Middle East and Africa Market Attractiveness by Pricing, 2025-2035
  • Figure 210: Middle East and Africa Market Attractiveness by Country, 2025-2035

Frequently Asked Questions

How big is the AR Tour Services Market in 2025?

The global AR Tour Services Market is estimated to be valued at USD 2,450.6 million in 2025.

What will be the size of AR Tour Services Market in 2035?

The market size for the AR Tour Services Market is projected to reach USD 9,380.5 million by 2035.

How much will be the AR Tour Services Market growth between 2025 and 2035?

The AR Tour Services Market is expected to grow at a 14.4% CAGR between 2025 and 2035.

What are the key delivery devices in the AR Tour Services Market?

The key delivery devices in the AR Tour Services Market are smartphone/tablet AR and AR smart glasses.

Which user group segment will contribute significant share in the AR Tour Services Market in 2025?

In terms of user groups, tourists are set to command 65.3% share in the AR Tour Services Market in 2025.

Explore Similar Insights

Future Market Insights

AR Tour Services Market