AR Fitness Services Market Size and Share Forecast Outlook 2025 to 2035

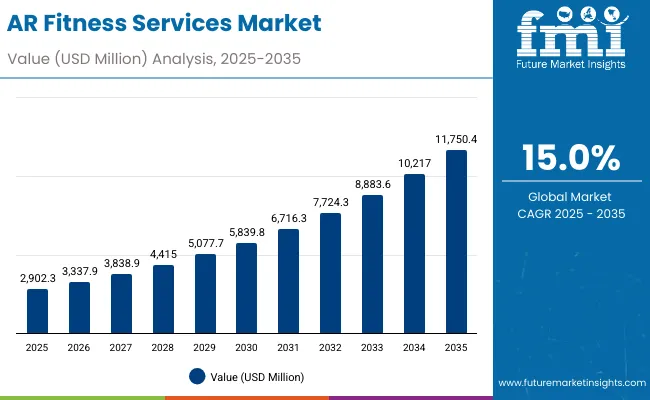
The AR Fitness Services Market is expected to record a valuation of USD 2,902.3 million in 2025 and USD 11,750.4 million in 2035, with an increase of USD 8,848.1 million, which equals a growth of 305% over the decade. The overall expansion represents a CAGR of 15.0% and a nearly 4X increase in market size.
Quick Stats for AR Fitness Services Market

  • AR Fitness Services Market Value (2025): USD 2,902.3 million
  • AR Fitness Services Market Forecast Value (2035): USD 11,750.4 million
  • AR Fitness Services Market Forecast CAGR: 15.0%
  • Leading Segment in AR Fitness Services Market in 2025: Home fitness consumers (70.3%)
  • Key Growth Regions in the AR Fitness Services Market: China, India, Japan
  • Top Key Players in AR Fitness Services Market: Supernatural, Zwift, Liteboxer, ARX Fit, FitXR, Peloton, VirZOOM, YUR, AR Trainers, Les Mills Immersive

Ar Fitness Services Market

AR Fitness Services Market Key Takeaways

Metric Value
Market Estimated Value in (2025E) USD 2,902.3 million
Market Forecast Value in (2035F) USD 11,750.4 million
Forecast CAGR (2025 to 2035) 15.0%

During the first five-year period from 2025 to 2030, the market increases from USD 2,902.3 million to USD 5,839.8 million, adding USD 2,937.5 million, which accounts for 33.2% of the total decade growth. This phase records steady adoption in home-based AR subscriptions, gym integrations, and wellness apps, driven by the need for gamified and engaging workouts. Smartphone/tablet AR dominates this period as it caters to over 61% of users requiring accessible fitness formats.

The second half from 2030 to 2035 contributes USD 5,910.6 million, equal to 66.8% of total growth, as the market jumps from USD 5,839.8 million to USD 11,750.4 million. This acceleration is powered by widespread deployment of AR headsets, connected fitness mirrors, and corporate wellness platforms in global workplaces. Subscription-based models and corporate packages together capture a larger share above 70% by the end of the decade. Content-led services, immersive AR group classes, and AI-driven personalization add recurring revenue, increasing the subscription share beyond 65% in total value.

From 2020 to 2024, the AR Fitness Services Market grew steadily from a small niche of pilot AR workouts to a consumer-ready segment valued close to USD 2.9 billion by 2025, driven by subscription-based adoption and smartphone-centric AR content. During this period, the competitive landscape was dominated by early innovators and fitness-tech hybrids, with leaders such as Supernatural, FitXR, and Zwift focusing on immersive workout experiences for cardio and group fitness. Competitive differentiation relied on gamification, engaging content, and accessibility via smartphones, while headset adoption remained limited. Corporate wellness and service-based models had minimal traction, contributing less than 15% of the total market value.

Demand for AR-based fitness will expand to USD 11.7 billion by 2035, and the revenue mix will shift as subscription and corporate wellness programs grow to over 70% share. Traditional connected fitness leaders like Peloton face rising competition from AR-first players offering immersive group fitness, real-time motion tracking, and AI-driven personalization. Major players are pivoting to hybrid models, integrating AR headsets, fitness mirrors, and cloud-based analytics to retain relevance. Emerging entrants specializing in corporate AR wellness packages, AR/VR interoperability, and immersive dance/yoga classes are gaining share. The competitive advantage is moving away from hardware and equipment toward ecosystem strength, subscription loyalty, and corporate partnerships.

Why the AR Fitness Services Market is Growing?

Advances in AR delivery devices and immersive fitness platforms have improved accessibility and engagement, allowing for more efficient workout delivery across diverse fitness applications. Smartphone/tablet AR has gained popularity due to its affordability, portability, and suitability for interactive workouts. The rise of subscription-based pricing models has contributed to higher user retention and recurring revenue opportunities.

Segments such as home fitness consumers, gyms/studios, and corporate wellness are driving demand for AR fitness services that can seamlessly integrate into existing fitness routines and digital platforms. Expansion of immersive AR group classes, gamified workouts, and wellness tracking has fueled market growth. Innovations in AR headsets, connected fitness mirrors, and AI-driven personalization are expected to open new application areas. Segment growth is expected to be led by home fitness consumers, subscription pricing models, and smartphone/tablet AR devices due to their precision, accessibility, and adaptability.

Segmental Analysis

The market is segmented by workout type, delivery device, pricing model, and user group. Workout types include AR gamified cardio, AR strength training, AR yoga/meditation, and AR dance & group fitness, highlighting the diverse formats driving adoption. Delivery devices cover smartphone/tablet AR, AR headsets/glasses, and connected fitness mirrors, catering to different user preferences. Based on pricing model, the segmentation includes subscription, per-class purchase, and corporate wellness packages. In terms of user groups, categories encompass home fitness consumers, gyms/studios, and corporate wellness clients. Regionally, the scope spans North America, Europe, Asia-Pacific, Latin America, and the Middle East & Africa, with country-level coverage of the USA, China, India, UK, Germany, and Japan.
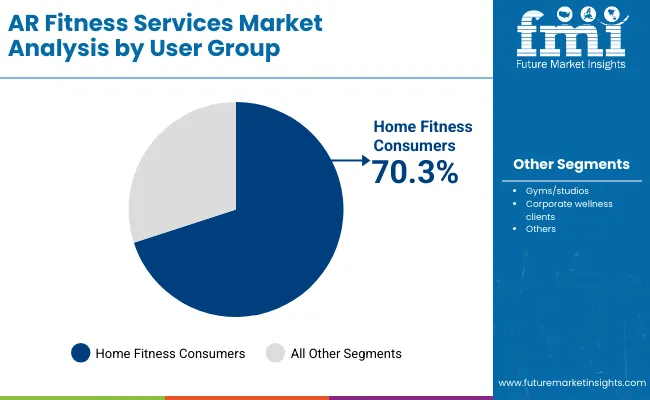
Insights into the User Group Segment with Home Fitness Consumers Leading in Market Share

Ar Fitness Services Market By User

User Group Segment Market Value Share, 2025
Home Fitness Consumers 70.3%
Others 29.7%

The home fitness consumers segment is projected to contribute 70.3% of the AR Fitness Services Market revenue in 2025, maintaining its lead as the dominant user category. This is driven by ongoing demand for convenient, at-home fitness solutions powered by AR gamification, guided meditation, and interactive cardio sessions. Home users are investing in smartphones, fitness mirrors, and AR headsets to replicate gym-like experiences within their homes. The segment’s growth is also supported by the development of subscription platforms that provide unlimited access to AR fitness content. As immersive content libraries expand and social AR features become more popular, home fitness consumers are expected to retain their position as the backbone of AR fitness demand.
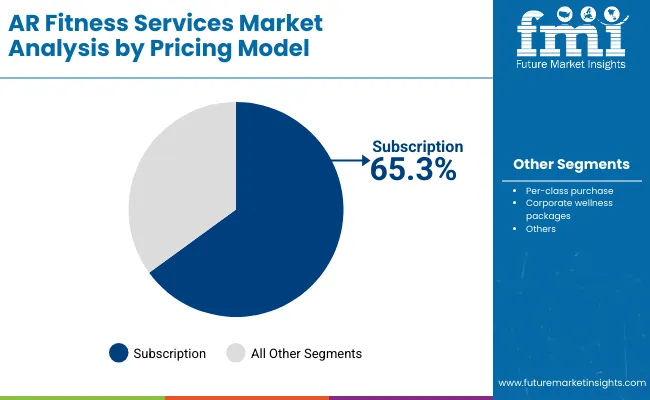
Insights into the Pricing Model Segment with Subscription Dominating the Demand

Ar Fitness Services Market By Pricing

Pricing Model Segment Market Value Share, 2025
Subscription 65.3%
Others 34.7%

The subscription segment is forecasted to hold 65.3% of the market share in 2025, led by its ability to provide cost-effective, recurring access to fitness content. Subscriptions are favored for their unlimited access to AR cardio, strength, and meditation programs, making them ideal for continuous engagement and consumer retention. Their flexible pricing, bundling options, and compatibility with mobile and wearable devices have facilitated widespread adoption in home and corporate fitness ecosystems. The segment’s growth is bolstered by corporate wellness partnerships and loyalty-driven platforms that integrate AR workouts into broader health initiatives. As demand for recurring and personalized fitness solutions rises, subscription-based models are expected to continue their dominance in the market.
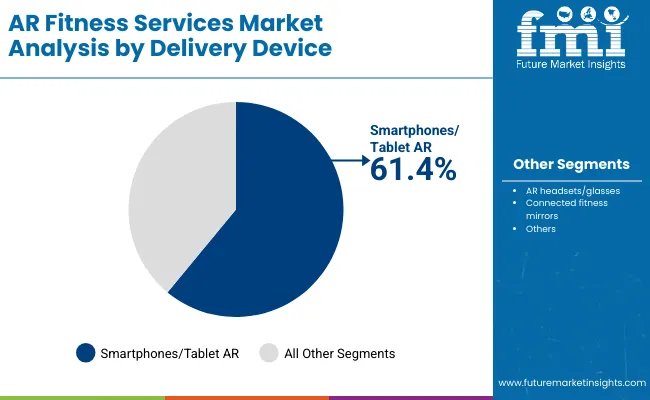
Insights into the Delivery Device Segment with Smartphones/Tablet AR Leading

Ar Fitness Services Market By Delivery

Delivery Device Segment Market Value Share, 2025
Smartphones/Tablet AR 61.4%
Others 38.6%

The smartphone/tablet AR segment is projected to account for 61.4% of the AR Fitness Services Market revenue in 2025, establishing it as the leading delivery device type. This category is preferred for its ease of access, affordability, and wide compatibility with consumer devices already in use. Its suitability for streaming immersive AR fitness sessions, gamified group workouts, and guided meditation has made it popular across fitness enthusiasts globally. Developments in camera sensors, mobile AR frameworks, and 5G connectivity have enhanced resolution, real-time motion tracking, and engagement, improving the overall AR fitness experience. Given its balance of affordability and scalability, smartphone/tablet AR is expected to maintain its leading role in the AR Fitness Services Market.

What are the Drivers, Restraints, and Key Trends of the AR Fitness Services Market?

Drivers

Rising Adoption of Home-Based Fitness Solutions

One of the most powerful forces driving the growth of the AR fitness services market is the rising adoption of home-based fitness solutions. Consumers increasingly prefer to exercise in the comfort of their homes, where convenience, privacy, and flexibility allow them to build personalized routines without the time and cost commitments of traditional gyms. Augmented reality has elevated this experience by introducing gamification, immersive guidance, and interactive overlays that simulate trainer-led environments.

Cardio workouts, yoga practices, and group dance sessions can now be transformed into engaging and highly motivating digital formats. Another layer fueling this trend is the growing reliance on everyday devices such as smartphones and tablets, which serve as primary entry points into AR fitness ecosystems. By leveraging devices already in consumers’ hands, adoption barriers are minimized, ensuring widespread accessibility. The integration of social features, community-driven competitions, and immersive content further enhances the stickiness of these platforms, making home-based AR fitness not just a substitute for gym sessions but a lifestyle choice. This driver underscores the central role of at-home adoption in ensuring long-term growth for the AR fitness industry.

Subscription-Led Recurring Revenue Models

A second major driver of the market lies in the dominance of subscription-based business models. Subscriptions have transformed the fitness landscape by offering continuous access to diverse workout libraries covering cardio, strength, meditation, and group formats under a single recurring fee. This approach removes the limitations of one-off class purchases and encourages long-term user engagement. Consumers are drawn to platforms that frequently refresh their content, keeping workouts dynamic and preventing fatigue.

From the perspective of providers, subscription revenues offer predictability and stability, enabling continuous reinvestment in content creation, technology upgrades, and customer retention strategies. The model also aligns well with emerging trends in corporate wellness, where organizations purchase bulk subscription access for employees as part of broader well-being initiatives. The ability of subscription models to deliver affordability for users and sustainability for businesses makes them one of the most significant growth drivers shaping the AR fitness services market.

Restraints

High Cost and Limited Penetration of AR Hardware

While smartphones and tablets provide a widely accessible entry point, the adoption of advanced AR hardware such as connected fitness mirrors and AR headsets faces significant challenges. These devices remain relatively expensive, limiting their accessibility to only certain consumer groups. The need for specialized infrastructure and compatible ecosystems further slows down mass adoption. In many markets, especially developing regions, the affordability gap widens the divide between basic AR-enabled mobile solutions and premium immersive hardware.

Another factor limiting penetration is consumer hesitation regarding rapidly evolving technology. Hardware innovation cycles often outpace consumer adoption, creating uncertainty around obsolescence and long-term value. For fitness studios and gyms, the upfront cost of AR integration including devices, content licensing, and staff training can also act as a barrier. This makes the transition to fully hardware-integrated AR fitness environments slower, restraining the market’s ability to achieve broader penetration in the short term.

Content Fragmentation and Engagement Fatigue

The market also faces challenges from content fragmentation and engagement fatigue. With numerous platforms competing for attention, users are often required to juggle multiple subscriptions or apps to access the full range of workout types they desire. This siloed approach leads to inefficiencies and reduces the value proposition of AR fitness for consumers seeking comprehensive solutions. As content quality and variety vary significantly across providers, user experience can be inconsistent, further complicating retention.

In addition, AR fitness heavily relies on novelty and engagement. If platforms fail to refresh their content libraries or provide sufficient personalization, users may lose interest over time. Engagement fatigue can set in when workouts become repetitive or gamification loses its appeal. Subscription fatigue is another risk, as consumers become increasingly selective about the number of recurring services they are willing to maintain. Addressing this restraint requires platforms to focus on interoperability, collaboration, and personalized experiences that keep users motivated and loyal in a crowded marketplace.

Key Trends

Shift Toward Corporate Wellness Integration

A defining trend shaping the AR fitness services market is the growing integration of these platforms into corporate wellness programs. Employers are increasingly recognizing the value of offering fitness and stress-management solutions to their workforce, not only to improve health outcomes but also to enhance productivity and morale. AR platforms lend themselves particularly well to this setting, offering scalable, engaging, and cost-effective wellness benefits that can be accessed remotely by employees working in hybrid or distributed environments.

Corporate wellness applications extend beyond physical exercise to include guided meditation, mindfulness training, and group wellness challenges, all enhanced by AR’s immersive capabilities. By positioning themselves as holistic wellness providers, AR fitness companies are tapping into a large and relatively untapped customer base in the enterprise segment. This trend represents a critical diversification of demand away from consumer-only adoption, opening new long-term revenue streams and deepening the relevance of AR fitness in organizational well-being strategies.

Emergence of AR Headsets and Immersive Group Fitness

Although smartphones currently dominate AR delivery, the next wave of market evolution is being defined by the emergence of AR headsets and immersive group fitness experiences. These technologies offer a more hands-free and fully engaging environment, allowing users to participate in dance classes, strength challenges, and meditation sessions in highly interactive digital spaces. The sense of immersion enhances motivation, replicating the social and community-driven atmosphere of gyms and studios.

Immersive group formats are gaining traction as users increasingly seek experiences that blend fitness with entertainment. By integrating motion tracking, AI-driven coaching, and social interaction features, AR platforms are turning exercise into a shared activity rather than an isolated one. Over the coming decade, AR headsets and fitness mirrors are expected to play a growing role in multi-device ecosystems where consumers switch seamlessly between different platforms. This trend points to a future where AR fitness evolves into a fully immersive, socially connected, and multi-device experience.
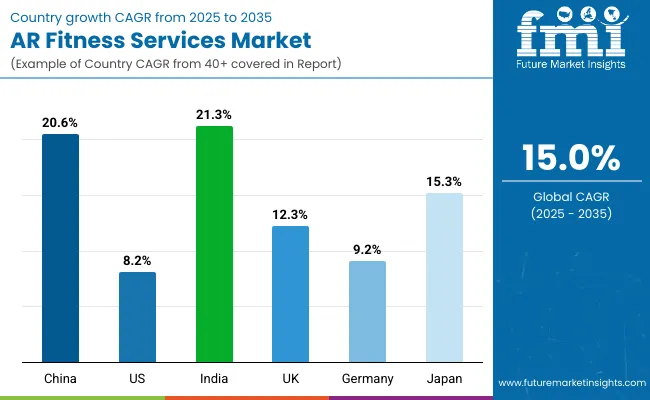
Analysis of AR Fitness Services Market By Key Countries

Ar Fitness Services Market By Country

Countries Estimated CAGR (2025 to 2035)
China 20.6%
USA 8.2%
India 21.3%
UK 12.3%
Germany 9.2%
Japan 15.3%

The AR Fitness Services Market shows highly uneven growth rates across countries, reflecting differences in digital infrastructure, consumer readiness, and fitness culture. Emerging economies such as China and India are leading with exceptionally high growth prospects, supported by strong smartphone penetration, younger demographics, and a growing appetite for affordable, tech-driven wellness solutions. These markets are adopting AR fitness rapidly as part of a broader digital lifestyle shift, with subscriptions and gamified content becoming mainstream drivers. Japan also stands out with a robust double-digit growth outlook, driven by rising interest in technology-enabled wellness and the cultural emphasis on holistic health.

In contrast, mature markets such as the USA, UK, and Germany exhibit more moderate growth trajectories, as adoption is already established and competition among providers is intense. While the USA remains a large and influential market, its growth pace is slower due to saturation and higher consumer expectations for premium immersive experiences. The UK and Germany also reflect stable, steady growth tied to broader wellness adoption and digital fitness integration into gym and studio ecosystems. Together, these patterns indicate that while developed markets will sustain demand, the fastest momentum for AR fitness services will come from Asia, reshaping the geographic balance of market leadership over the next decade.
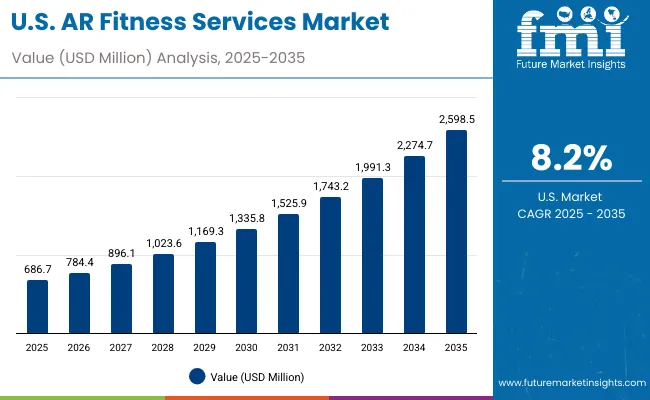
Sales Outlook for AR Fitness Services in the United States

Ar Fitness Services Market Usa

Year USA AR Fitness Services Market (USD Million)
2025 686.7
2026 784.4
2027 896.1
2028 1023.6
2029 1169.3
2030 1335.8
2031 1525.9
2032 1743.2
2033 1991.3
2034 2274.7
2035 2598.5

The AR Fitness Services Market in the United States is projected to expand steadily, reflecting growing demand for home-based immersive workouts and corporate wellness integration. Adoption is being fueled by consumer preference for AR-enhanced cardio, yoga, and group fitness formats accessible via smartphones and tablets. The presence of established players such as Supernatural, FitXR, and Peloton has created strong momentum, particularly among home fitness consumers. Corporate wellness programs are also beginning to integrate AR packages, targeting employee engagement and well-being.

  • Home fitness adoption continues to dominate, with immersive cardio and group classes most popular.
  • Corporate wellness clients are increasingly testing AR subscriptions to boost employee engagement.
  • Smartphone-based AR remains the leading delivery mode, while connected mirrors are slowly gaining traction.

Growth and Expansion Outlook for AR Fitness Services in the United Kingdom

The AR Fitness Services Market in the United Kingdom is expected to grow at a double-digit rate, supported by widespread digital fitness adoption and integration into gyms and studios. Consumers are drawn to gamified cardio and AR-driven group fitness formats, while boutique studios are experimenting with immersive class offerings. The cultural acceptance of hybrid fitness models post-pandemic is reinforcing demand for AR-based wellness tools. Additionally, technology partnerships between local fitness brands and AR developers are accelerating accessibility.

  • Gyms and boutique studios are integrating AR into class-based programs.
  • Consumers are embracing gamified fitness formats for higher motivation and consistency.
  • Local partnerships between fitness providers and AR firms are expanding ecosystem adoption.

Growth and Expansion Outlook for AR Fitness Services in India

India is witnessing rapid growth in the AR Fitness Services Market, driven by younger demographics, affordability of smartphone-based platforms, and increasing interest in digital fitness experiences. Tier-2 and Tier-3 cities are seeing higher adoption due to improved awareness and cost-effective subscription packages. AR-based yoga and meditation are particularly appealing in the Indian context, combining cultural relevance with immersive digital formats. Educational institutions and corporate wellness programs are also exploring AR fitness integration as awareness spreads.
  • Adoption in smaller cities is increasing through cost-efficient subscription platforms.
  • AR yoga and meditation are gaining traction due to cultural alignment and accessibility.
  • Corporates and institutions are introducing AR wellness programs for broader employee engagement.

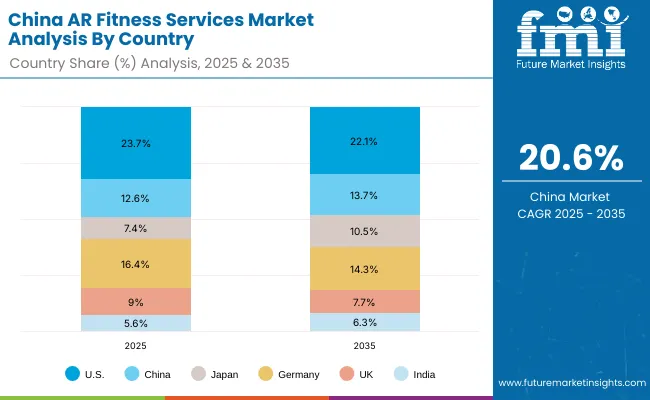
Sales Outlook for AR Fitness Services in China

Ar Fitness Services Market China

Countries 2025 Share (%)
USA 23.7%
China 12.6%
Japan 7.4%
Germany 16.4%
UK 9.0%
India 5.6%
Countries 2035 Share (%)
USA 22.1%
China 13.7%
Japan 10.5%
Germany 14.3%
UK 7.7%
India 6.3%

The AR Fitness Services Market in China is forecast to record the highest growth rate among leading economies, fueled by strong consumer interest in gamified and immersive wellness platforms. Rapid smartphone penetration and the popularity of AR-enhanced entertainment are directly influencing adoption in the fitness space. Local technology firms are investing in affordable AR fitness applications, making services more accessible to a wider audience. Municipal programs promoting digital wellness and partnerships with domestic gyms are further supporting growth.
  • Gamified AR fitness platforms are driving rapid consumer adoption across age groups.
  • Local tech firms are producing cost-effective AR apps, boosting mass-market reach.
  • Gyms and municipalities are integrating AR fitness into community-based wellness initiatives.

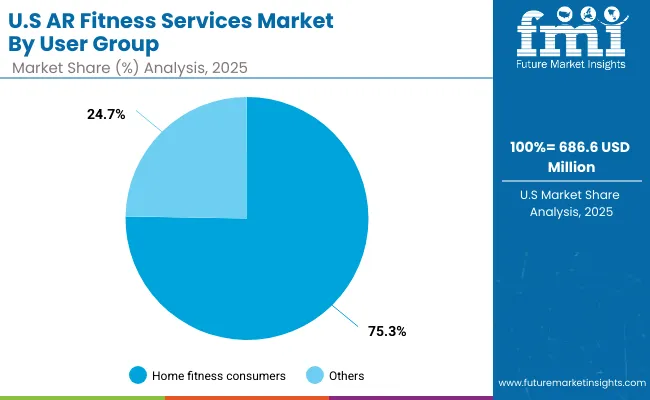
Opportunity Analysis of the USA AR Fitness Services Market

Ar Fitness Services Market Usa 2

User Group Segment Market Value Share, 2025
Home fitness consumers 75.3%
Others 24.7%

The AR Fitness Services Market in the United States is valued at USD 686.6 million in 2025, with home fitness consumers leading at 75.3%, while other segments, including gyms/studios and corporate wellness clients, hold a smaller share. The dominance of home-based adoption is closely tied to the country’s strong culture of personal fitness, subscription streaming platforms, and preference for flexible workout formats. Smartphones and fitness mirrors are widely used for AR-enabled workouts, while headsets are gradually penetrating tech-savvy households.

The USA market also benefits from high consumer willingness to pay for premium fitness content, a trend supported by strong brand positioning from early leaders such as Supernatural, FitXR, and Peloton. Corporate wellness adoption, though still emerging, presents a significant opportunity as employers integrate AR-based exercise and meditation programs into broader health benefits. Over time, the corporate segment is expected to contribute more strongly as enterprises prioritize employee well-being in hybrid work environments.
  • Market size for the USA in 2025 is USD 686.6million
  • Global market share is approximately 23.7%
  • Home fitness consumers dominate with 75.3% share due to strong at-home adoption trends

Opportunity Analysis of the China AR Fitness Services Market

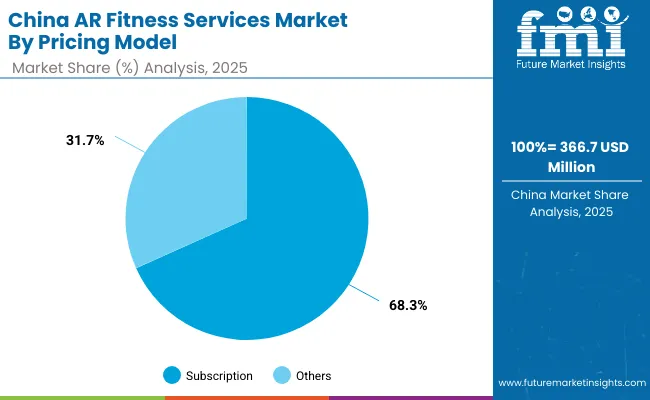
Ar Fitness Services Market China 2

Pricing Model Segment Market Value Share, 2025
Subscription 68.3%
Others 31.7%

The AR Fitness Services Market in China is valued at USD 366.7 million in 2025, with subscriptions leading at 68.3%, while one-time purchases and corporate packages account for the rest. The strong preference for subscriptions is supported by China’s digital ecosystem, where consumers are accustomed to low-cost, high-volume streaming platforms and recurring app-based payments. Affordable subscription bundles and rapid content refresh cycles have made AR fitness widely appealing to younger demographics and urban populations.

The country’s rapid CAGR outlook reflects not only consumer adoption but also innovation from local tech companies creating AR-driven wellness applications. Smartphone-based AR dominates, though AR headsets are beginning to see traction due to strong domestic manufacturing capabilities. Integration of AR workouts into local gyms, social media platforms, and e-commerce ecosystems ensures that fitness services are accessible and engaging. China’s momentum positions it as a key growth engine for the global market.
  • Market size for China in 2025 is USD 366.7 million
  • Global market share is approximately 12.6%
  • Subscriptions dominate with 68.3% share, reflecting widespread adoption of recurring digital services

Competitive Landscape of the AR Fitness Services Market

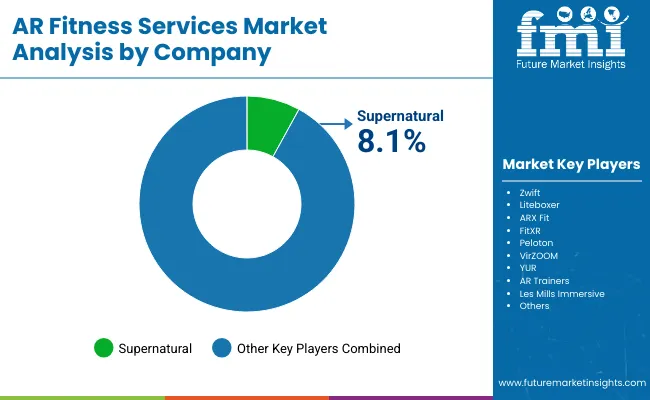
Ar Fitness Services Market By Company

The AR Fitness Services Market is highly fragmented, with a mix of global leaders, mid-sized innovators, and niche-focused specialists. Early pioneers such as Supernatural, FitXR, and Zwift have carved out significant mindshare through immersive cardio, yoga, and group fitness experiences. Supernatural currently leads with the highest individual market share, supported by a strong subscription base and high-quality content integration. Mid-sized challengers including Liteboxer, ARX Fit, and VirZOOM are capturing demand for specialized formats such as boxing, resistance training, and gamified cycling.

Their strength lies in portability, affordability, and the ability to integrate AR workouts into existing consumer ecosystems via smartphones and fitness mirrors. Companies like Peloton and Les Mills Immersive are leveraging brand equity from the traditional fitness space, extending their offerings into AR-driven classes to retain competitiveness. Smaller innovators such as YUR and AR Trainers are driving experimentation in wearable integration, gamification, and niche group workout formats.

Their advantage lies in adaptability, creativity, and the ability to target under-served market niches. Across the landscape, competitive differentiation is shifting away from hardware or workout categories alone and toward ecosystem-driven models that integrate recurring subscriptions, AI-driven personalization, and social engagement. This creates opportunities for players capable of offering holistic, immersive, and loyalty-focused AR fitness ecosystems.

Key Developments in AR Fitness Services Market

  • On November 7, 2024, Supernatural launched Supernatural Together, enabling real-time group AR/VR workouts with voice chat, private rooms, and collaborative challenge features, making social fitness a core part of its ecosystem.
  • On June 17, 2025, Zwift upgraded its Companion App, adding Fitness Trends and Training Status features to track weekly goals, outdoor ride sync, and readiness indicators, enhancing engagement through advanced analytics.

Scope of the Report

Item Value
Quantitative Units USD 2,902.3 million
Workout Type AR gamified cardio, AR strength training, AR yoga/meditation, AR dance & group fitness
Delivery Device Smartphone/tablet AR, AR headsets/glasses, Connected fitness mirrors
Pricing Model Subscription, Per-class purchase, Corporate wellness packages
User Group Home fitness consumers, Gyms/studios, Corporate wellness clients
Regions Covered North America, Europe, Asia-Pacific, Latin America, Middle East & Africa
Country Covered United States, Canada, Germany, France, United Kingdom, China, Japan, India, Brazil, South Africa
Key Companies Profiled Supernatural, Zwift, Liteboxer, ARX Fit, FitXR, Peloton, VirZOOM, YUR, AR Trainers, Les Mills Immersive
Additional Attributes Dollar sales by user group and pricing model, adoption trends in home fitness and corporate wellness, rising demand for smartphone/tablet-based AR fitness, segment-specific growth in gamified cardio, yoga/meditation, and group classes, subscription revenue segmentation, integration with AR headsets and connected mirrors, regional growth influenced by digital wellness initiatives, and innovations in AI-driven personalization, gamification, and immersive group fitness formats.

Key Segments

By Workout Type:

  • AR gamified cardio
  • AR strength training
  • AR yoga/meditation
  • AR dance & group fitness

By Delivery Device:

  • Smartphone/tablet AR
  • AR headsets/glasses
  • Connected fitness mirrors

By Pricing Model:

  • Subscription
  • Per-class purchase
  • Corporate wellness packages

By User Group:

  • Home fitness consumers
  • Gyms/studios
  • Corporate wellness clients

By Region:

  • North America
  • Latin America
  • Europe
  • East Asia
  • South Asia & Pacific
  • Middle East and Africa

Table of Content

  1. Executive Summary
    • Global Market Outlook
    • Demand-side Trends
    • Supply-side Trends
    • Technology Roadmap Analysis
    • Analysis and Recommendations
  2. Market Overview
    • Market Coverage / Taxonomy
    • Market Definition / Scope / Limitations
  3. Market Background
    • Market Dynamics
      • Drivers
      • Restraints
      • Opportunity
      • Trends
    • Scenario Forecast
      • Demand in Optimistic Scenario
      • Demand in Likely Scenario
      • Demand in Conservative Scenario
    • Opportunity Map Analysis
    • Product Life Cycle Analysis
    • Supply Chain Analysis
      • Supply Side Participants and their Roles
        • Producers
        • Mid-Level Participants (Traders/ Agents/ Brokers)
        • Wholesalers and Distributors
      • Value Added and Value Created at Node in the Supply Chain
      • List of Raw Material Suppliers
      • List of Existing and Potential Buyer’s
    • Investment Feasibility Matrix
    • Value Chain Analysis
      • Profit Margin Analysis
      • Wholesalers and Distributors
      • Retailers
    • PESTLE and Porter’s Analysis
    • Regulatory Landscape
      • By Key Regions
      • By Key Countries
    • Regional Parent Market Outlook
    • Production and Consumption Statistics
    • Import and Export Statistics
  4. Global Market Analysis 2020 to 2024 and Forecast, 2025 to 2035
    • Historical Market Size Value (USD Million) & Volume (Units) Analysis, 2020 to 2024
    • Current and Future Market Size Value (USD Million) & Volume (Units) Projections, 2025 to 2035
      • Y-o-Y Growth Trend Analysis
      • Absolute $ Opportunity Analysis
  5. Global Market Analysis 2020 to 2024 and Forecast 2025 to 2035, By Workout Type
    • Introduction / Key Findings
    • Historical Market Size Value (USD Million) & Volume (Units) Analysis By Workout Type, 2020 to 2024
    • Current and Future Market Size Value (USD Million) & Volume (Units) Analysis and Forecast By Workout Type, 2025 to 2035
      • AR gamified cardio
      • AR strength training
      • AR yoga/meditation
      • AR dance & group fitness
    • Y-o-Y Growth Trend Analysis By Workout Type, 2020 to 2024
    • Absolute $ Opportunity Analysis By Workout Type, 2025 to 2035
  6. Global Market Analysis 2020 to 2024 and Forecast 2025 to 2035, By Delivery Device
    • Introduction / Key Findings
    • Historical Market Size Value (USD Million) & Volume (Units) Analysis By Delivery Device, 2020 to 2024
    • Current and Future Market Size Value (USD Million) & Volume (Units) Analysis and Forecast By Delivery Device, 2025 to 2035
      • Smartphone/tablet AR
      • AR headsets/glasses
      • Connected fitness mirrors
    • Y-o-Y Growth Trend Analysis By Delivery Device, 2020 to 2024
    • Absolute $ Opportunity Analysis By Delivery Device, 2025 to 2035
  7. Global Market Analysis 2020 to 2024 and Forecast 2025 to 2035, By Pricing Model
    • Introduction / Key Findings
    • Historical Market Size Value (USD Million) & Volume (Units) Analysis By Pricing Model, 2020 to 2024
    • Current and Future Market Size Value (USD Million) & Volume (Units) Analysis and Forecast By Pricing Model, 2025 to 2035
      • Subscription
      • Per-class purchase
      • Corporate wellness packages
    • Y-o-Y Growth Trend Analysis By Pricing Model, 2020 to 2024
    • Absolute $ Opportunity Analysis By Pricing Model, 2025 to 2035
  8. Global Market Analysis 2020 to 2024 and Forecast 2025 to 2035, By User Group
    • Introduction / Key Findings
    • Historical Market Size Value (USD Million) & Volume (Units) Analysis By User Group, 2020 to 2024
    • Current and Future Market Size Value (USD Million) & Volume (Units) Analysis and Forecast By User Group, 2025 to 2035
      • Home fitness consumers
      • Gyms/studios
      • Corporate wellness clients
    • Y-o-Y Growth Trend Analysis By User Group, 2020 to 2024
    • Absolute $ Opportunity Analysis By User Group, 2025 to 2035
  9. Global Market Analysis 2020 to 2024 and Forecast 2025 to 2035, By Region
    • Introduction
    • Historical Market Size Value (USD Million) & Volume (Units) Analysis By Region, 2020 to 2024
    • Current Market Size Value (USD Million) & Volume (Units) Analysis and Forecast By Region, 2025 to 2035
      • North America
      • Latin America
      • Europe
      • East Asia
      • South Asia & Pacific
      • Middle East and Africa
    • Market Attractiveness Analysis By Region
  10. North America Market Analysis 2020 to 2024 and Forecast 2025 to 2035, By Country
    • Historical Market Size Value (USD Million) & Volume (Units) Trend Analysis By Market Taxonomy, 2020 to 2024
    • Market Size Value (USD Million) & Volume (Units) Forecast By Market Taxonomy, 2025 to 2035
      • By Country
        • USA
        • Canada
      • By Workout Type
      • By Delivery Device
      • By Pricing Model
      • By User Group
    • Market Attractiveness Analysis
      • By Country
      • By Workout Type
      • By Delivery Device
      • By Pricing Model
      • By User Group
    • Key Takeaways
  11. Latin America Market Analysis 2020 to 2024 and Forecast 2025 to 2035, By Country
    • Historical Market Size Value (USD Million) & Volume (Units) Trend Analysis By Market Taxonomy, 2020 to 2024
    • Market Size Value (USD Million) & Volume (Units) Forecast By Market Taxonomy, 2025 to 2035
      • By Country
        • Brazil
        • Mexico
        • Colombia
        • Rest of Latin America
      • By Workout Type
      • By Delivery Device
      • By Pricing Model
      • By User Group
    • Market Attractiveness Analysis
      • By Country
      • By Workout Type
      • By Delivery Device
      • By Pricing Model
      • By User Group
    • Key Takeaways
  12. Europe Market Analysis 2020 to 2024 and Forecast 2025 to 2035, By Country
    • Historical Market Size Value (USD Million) & Volume (Units) Trend Analysis By Market Taxonomy, 2020 to 2024
    • Market Size Value (USD Million) & Volume (Units) Forecast By Market Taxonomy, 2025 to 2035
      • By Country
        • Germany
        • UK
        • France
        • Italy
        • Spain
        • Belgium
        • Netherlands
        • Nordic
        • Switzerland
        • Russia
        • Poland
        • Rest of Europe
      • By Workout Type
      • By Delivery Device
      • By Pricing Model
      • By User Group
    • Market Attractiveness Analysis
      • By Country
      • By Workout Type
      • By Delivery Device
      • By Pricing Model
      • By User Group
    • Key Takeaways
  13. East Asia Market Analysis 2020 to 2024 and Forecast 2025 to 2035, By Country
    • Historical Market Size Value (USD Million) & Volume (Units) Trend Analysis By Market Taxonomy, 2020 to 2024
    • Market Size Value (USD Million) & Volume (Units) Forecast By Market Taxonomy, 2025 to 2035
      • By Country
        • China
        • Japan
        • South Korea
      • By Workout Type
      • By Delivery Device
      • By Pricing Model
      • By User Group
    • Market Attractiveness Analysis
      • By Country
      • By Workout Type
      • By Delivery Device
      • By Pricing Model
      • By User Group
    • Key Takeaways
  14. South Asia & Pacific Market Analysis 2020 to 2024 and Forecast 2025 to 2035, By Country
    • Historical Market Size Value (USD Million) & Volume (Units) Trend Analysis By Market Taxonomy, 2020 to 2024
    • Market Size Value (USD Million) & Volume (Units) Forecast By Market Taxonomy, 2025 to 2035
      • By Country
        • India
        • Thailand
        • Malaysia
        • Indonesia
        • Singapore
        • Vietnam
        • Australia
        • New Zealand
        • Rest of South Asia
      • By Workout Type
      • By Delivery Device
      • By Pricing Model
      • By User Group
    • Market Attractiveness Analysis
      • By Country
      • By Workout Type
      • By Delivery Device
      • By Pricing Model
      • By User Group
    • Key Takeaways
  15. Middle East and Africa Market Analysis 2020 to 2024 and Forecast 2025 to 2035, By Country
    • Historical Market Size Value (USD Million) & Volume (Units) Trend Analysis By Market Taxonomy, 2020 to 2024
    • Market Size Value (USD Million) & Volume (Units) Forecast By Market Taxonomy, 2025 to 2035
      • By Country
        • Turkey
        • UAE
        • Saudi Arabia
        • Israel
        • Other GCC Countries
        • North Africa
        • South Africa
      • By Workout Type
      • By Delivery Device
      • By Pricing Model
      • By User Group
    • Market Attractiveness Analysis
      • By Country
      • By Workout Type
      • By Delivery Device
      • By Pricing Model
      • By User Group
    • Key Takeaways
  16. Key Countries Market Analysis
    • USA
      • Pricing Analysis
      • Market Share Analysis, 2024
        • By Workout Type
        • By Delivery Device
        • By Pricing Model
        • By User Group
    • Canada
      • Pricing Analysis
      • Market Share Analysis, 2024
        • By Workout Type
        • By Delivery Device
        • By Pricing Model
        • By User Group
    • Brazil
      • Pricing Analysis
      • Market Share Analysis, 2024
        • By Workout Type
        • By Delivery Device
        • By Pricing Model
        • By User Group
    • Mexico
      • Pricing Analysis
      • Market Share Analysis, 2024
        • By Workout Type
        • By Delivery Device
        • By Pricing Model
        • By User Group
    • Colombia
      • Pricing Analysis
      • Market Share Analysis, 2024
        • By Workout Type
        • By Delivery Device
        • By Pricing Model
        • By User Group
    • Germany
      • Pricing Analysis
      • Market Share Analysis, 2024
        • By Workout Type
        • By Delivery Device
        • By Pricing Model
        • By User Group
    • UK
      • Pricing Analysis
      • Market Share Analysis, 2024
        • By Workout Type
        • By Delivery Device
        • By Pricing Model
        • By User Group
    • France
      • Pricing Analysis
      • Market Share Analysis, 2024
        • By Workout Type
        • By Delivery Device
        • By Pricing Model
        • By User Group
    • Italy
      • Pricing Analysis
      • Market Share Analysis, 2024
        • By Workout Type
        • By Delivery Device
        • By Pricing Model
        • By User Group
    • Spain
      • Pricing Analysis
      • Market Share Analysis, 2024
        • By Workout Type
        • By Delivery Device
        • By Pricing Model
        • By User Group
    • Belgium
      • Pricing Analysis
      • Market Share Analysis, 2024
        • By Workout Type
        • By Delivery Device
        • By Pricing Model
        • By User Group
    • Netherlands
      • Pricing Analysis
      • Market Share Analysis, 2024
        • By Workout Type
        • By Delivery Device
        • By Pricing Model
        • By User Group
    • Nordic
      • Pricing Analysis
      • Market Share Analysis, 2024
        • By Workout Type
        • By Delivery Device
        • By Pricing Model
        • By User Group
    • Switzerland
      • Pricing Analysis
      • Market Share Analysis, 2024
        • By Workout Type
        • By Delivery Device
        • By Pricing Model
        • By User Group
    • Russia
      • Pricing Analysis
      • Market Share Analysis, 2024
        • By Workout Type
        • By Delivery Device
        • By Pricing Model
        • By User Group
    • Poland
      • Pricing Analysis
      • Market Share Analysis, 2024
        • By Workout Type
        • By Delivery Device
        • By Pricing Model
        • By User Group
    • China
      • Pricing Analysis
      • Market Share Analysis, 2024
        • By Workout Type
        • By Delivery Device
        • By Pricing Model
        • By User Group
    • Japan
      • Pricing Analysis
      • Market Share Analysis, 2024
        • By Workout Type
        • By Delivery Device
        • By Pricing Model
        • By User Group
    • South Korea
      • Pricing Analysis
      • Market Share Analysis, 2024
        • By Workout Type
        • By Delivery Device
        • By Pricing Model
        • By User Group
    • India
      • Pricing Analysis
      • Market Share Analysis, 2024
        • By Workout Type
        • By Delivery Device
        • By Pricing Model
        • By User Group
    • Thailand
      • Pricing Analysis
      • Market Share Analysis, 2024
        • By Workout Type
        • By Delivery Device
        • By Pricing Model
        • By User Group
    • Indonesia
      • Pricing Analysis
      • Market Share Analysis, 2024
        • By Workout Type
        • By Delivery Device
        • By Pricing Model
        • By User Group
    • Australia
      • Pricing Analysis
      • Market Share Analysis, 2024
        • By Workout Type
        • By Delivery Device
        • By Pricing Model
        • By User Group
    • New Zealand
      • Pricing Analysis
      • Market Share Analysis, 2024
        • By Workout Type
        • By Delivery Device
        • By Pricing Model
        • By User Group
    • Turkey
      • Pricing Analysis
      • Market Share Analysis, 2024
        • By Workout Type
        • By Delivery Device
        • By Pricing Model
        • By User Group
    • UAE
      • Pricing Analysis
      • Market Share Analysis, 2024
        • By Workout Type
        • By Delivery Device
        • By Pricing Model
        • By User Group
    • Saudi Arabia
      • Pricing Analysis
      • Market Share Analysis, 2024
        • By Workout Type
        • By Delivery Device
        • By Pricing Model
        • By User Group
    • Israel
      • Pricing Analysis
      • Market Share Analysis, 2024
        • By Workout Type
        • By Delivery Device
        • By Pricing Model
        • By User Group
    • North Africa
      • Pricing Analysis
      • Market Share Analysis, 2024
        • By Workout Type
        • By Delivery Device
        • By Pricing Model
        • By User Group
    • South Africa
      • Pricing Analysis
      • Market Share Analysis, 2024
        • By Workout Type
        • By Delivery Device
        • By Pricing Model
        • By User Group
  17. Market Structure Analysis
    • Competition Dashboard
    • Competition Benchmarking
    • Market Share Analysis of Top Players
      • By Regional
      • By Workout Type
      • By Delivery Device
      • By Pricing Model
      • By User Group
  18. Competition Analysis
    • Competition Deep Dive
      • Supernatural
        • Overview
        • Product Portfolio
        • Profitability by Market Segments (Product/Age /Sales Channel/Region)
        • Sales Footprint
        • Strategy Overview
          • Marketing Strategy
          • Product Strategy
          • Channel Strategy
      • Zwift
        • Overview
        • Product Portfolio
        • Profitability by Market Segments (Product/Age /Sales Channel/Region)
        • Sales Footprint
        • Strategy Overview
          • Marketing Strategy
          • Product Strategy
          • Channel Strategy
      • Liteboxer
        • Overview
        • Product Portfolio
        • Profitability by Market Segments (Product/Age /Sales Channel/Region)
        • Sales Footprint
        • Strategy Overview
          • Marketing Strategy
          • Product Strategy
          • Channel Strategy
      • ARX Fit
        • Overview
        • Product Portfolio
        • Profitability by Market Segments (Product/Age /Sales Channel/Region)
        • Sales Footprint
        • Strategy Overview
          • Marketing Strategy
          • Product Strategy
          • Channel Strategy
      • FitXR
        • Overview
        • Product Portfolio
        • Profitability by Market Segments (Product/Age /Sales Channel/Region)
        • Sales Footprint
        • Strategy Overview
          • Marketing Strategy
          • Product Strategy
          • Channel Strategy
      • Peloton
        • Overview
        • Product Portfolio
        • Profitability by Market Segments (Product/Age /Sales Channel/Region)
        • Sales Footprint
        • Strategy Overview
          • Marketing Strategy
          • Product Strategy
          • Channel Strategy
      • VirZOOM
        • Overview
        • Product Portfolio
        • Profitability by Market Segments (Product/Age /Sales Channel/Region)
        • Sales Footprint
        • Strategy Overview
          • Marketing Strategy
          • Product Strategy
          • Channel Strategy
      • YUR
        • Overview
        • Product Portfolio
        • Profitability by Market Segments (Product/Age /Sales Channel/Region)
        • Sales Footprint
        • Strategy Overview
          • Marketing Strategy
          • Product Strategy
          • Channel Strategy
      • AR Trainers
        • Overview
        • Product Portfolio
        • Profitability by Market Segments (Product/Age /Sales Channel/Region)
        • Sales Footprint
        • Strategy Overview
          • Marketing Strategy
          • Product Strategy
          • Channel Strategy
      • Les Mills Immersive
        • Overview
        • Product Portfolio
        • Profitability by Market Segments (Product/Age /Sales Channel/Region)
        • Sales Footprint
        • Strategy Overview
          • Marketing Strategy
          • Product Strategy
          • Channel Strategy
  19. Assumptions & Acronyms Used
  20. Research Methodology

List of Tables

  • Table 1: Global Market Value (USD Million) Forecast by Region, 2020-2035
  • Table 2: Global Market Volume (Units) Forecast by Region, 2020-2035
  • Table 3: Global Market Value (USD Million) Forecast by Workout Type, 2020-2035
  • Table 4: Global Market Volume (Units) Forecast by Workout Type, 2020-2035
  • Table 5: Global Market Value (USD Million) Forecast by Delivery Device, 2020-2035
  • Table 6: Global Market Volume (Units) Forecast by Delivery Device, 2020-2035
  • Table 7: Global Market Value (USD Million) Forecast by Pricing Model, 2020-2035
  • Table 8: Global Market Volume (Units) Forecast by Pricing Model, 2020-2035
  • Table 9: Global Market Value (USD Million) Forecast by User Group, 2020-2035
  • Table 10: Global Market Volume (Units) Forecast by User Group, 2020-2035
  • Table 11: North America Market Value (USD Million) Forecast by Country, 2020-2035
  • Table 12: North America Market Volume (Units) Forecast by Country, 2020-2035
  • Table 13: North America Market Value (USD Million) Forecast by Workout Type, 2020-2035
  • Table 14: North America Market Volume (Units) Forecast by Workout Type, 2020-2035
  • Table 15: North America Market Value (USD Million) Forecast by Delivery Device, 2020-2035
  • Table 16: North America Market Volume (Units) Forecast by Delivery Device, 2020-2035
  • Table 17: North America Market Value (USD Million) Forecast by Pricing Model, 2020-2035
  • Table 18: North America Market Volume (Units) Forecast by Pricing Model, 2020-2035
  • Table 19: North America Market Value (USD Million) Forecast by User Group, 2020-2035
  • Table 20: North America Market Volume (Units) Forecast by User Group, 2020-2035
  • Table 21: Latin America Market Value (USD Million) Forecast by Country, 2020-2035
  • Table 22: Latin America Market Volume (Units) Forecast by Country, 2020-2035
  • Table 23: Latin America Market Value (USD Million) Forecast by Workout Type, 2020-2035
  • Table 24: Latin America Market Volume (Units) Forecast by Workout Type, 2020-2035
  • Table 25: Latin America Market Value (USD Million) Forecast by Delivery Device, 2020-2035
  • Table 26: Latin America Market Volume (Units) Forecast by Delivery Device, 2020-2035
  • Table 27: Latin America Market Value (USD Million) Forecast by Pricing Model, 2020-2035
  • Table 28: Latin America Market Volume (Units) Forecast by Pricing Model, 2020-2035
  • Table 29: Latin America Market Value (USD Million) Forecast by User Group, 2020-2035
  • Table 30: Latin America Market Volume (Units) Forecast by User Group, 2020-2035
  • Table 31: Europe Market Value (USD Million) Forecast by Country, 2020-2035
  • Table 32: Europe Market Volume (Units) Forecast by Country, 2020-2035
  • Table 33: Europe Market Value (USD Million) Forecast by Workout Type, 2020-2035
  • Table 34: Europe Market Volume (Units) Forecast by Workout Type, 2020-2035
  • Table 35: Europe Market Value (USD Million) Forecast by Delivery Device, 2020-2035
  • Table 36: Europe Market Volume (Units) Forecast by Delivery Device, 2020-2035
  • Table 37: Europe Market Value (USD Million) Forecast by Pricing Model, 2020-2035
  • Table 38: Europe Market Volume (Units) Forecast by Pricing Model, 2020-2035
  • Table 39: Europe Market Value (USD Million) Forecast by User Group, 2020-2035
  • Table 40: Europe Market Volume (Units) Forecast by User Group, 2020-2035
  • Table 41: East Asia Market Value (USD Million) Forecast by Country, 2020-2035
  • Table 42: East Asia Market Volume (Units) Forecast by Country, 2020-2035
  • Table 43: East Asia Market Value (USD Million) Forecast by Workout Type, 2020-2035
  • Table 44: East Asia Market Volume (Units) Forecast by Workout Type, 2020-2035
  • Table 45: East Asia Market Value (USD Million) Forecast by Delivery Device, 2020-2035
  • Table 46: East Asia Market Volume (Units) Forecast by Delivery Device, 2020-2035
  • Table 47: East Asia Market Value (USD Million) Forecast by Pricing Model, 2020-2035
  • Table 48: East Asia Market Volume (Units) Forecast by Pricing Model, 2020-2035
  • Table 49: East Asia Market Value (USD Million) Forecast by User Group, 2020-2035
  • Table 50: East Asia Market Volume (Units) Forecast by User Group, 2020-2035
  • Table 51: South Asia & Pacific Market Value (USD Million) Forecast by Country, 2020-2035
  • Table 52: South Asia & Pacific Market Volume (Units) Forecast by Country, 2020-2035
  • Table 53: South Asia & Pacific Market Value (USD Million) Forecast by Workout Type, 2020-2035
  • Table 54: South Asia & Pacific Market Volume (Units) Forecast by Workout Type, 2020-2035
  • Table 55: South Asia & Pacific Market Value (USD Million) Forecast by Delivery Device, 2020-2035
  • Table 56: South Asia & Pacific Market Volume (Units) Forecast by Delivery Device, 2020-2035
  • Table 57: South Asia & Pacific Market Value (USD Million) Forecast by Pricing Model, 2020-2035
  • Table 58: South Asia & Pacific Market Volume (Units) Forecast by Pricing Model, 2020-2035
  • Table 59: South Asia & Pacific Market Value (USD Million) Forecast by User Group, 2020-2035
  • Table 60: South Asia & Pacific Market Volume (Units) Forecast by User Group, 2020-2035
  • Table 61: Middle East and Africa Market Value (USD Million) Forecast by Country, 2020-2035
  • Table 62: Middle East and Africa Market Volume (Units) Forecast by Country, 2020-2035
  • Table 63: Middle East and Africa Market Value (USD Million) Forecast by Workout Type, 2020-2035
  • Table 64: Middle East and Africa Market Volume (Units) Forecast by Workout Type, 2020-2035
  • Table 65: Middle East and Africa Market Value (USD Million) Forecast by Delivery Device, 2020-2035
  • Table 66: Middle East and Africa Market Volume (Units) Forecast by Delivery Device, 2020-2035
  • Table 67: Middle East and Africa Market Value (USD Million) Forecast by Pricing Model, 2020-2035
  • Table 68: Middle East and Africa Market Volume (Units) Forecast by Pricing Model, 2020-2035
  • Table 69: Middle East and Africa Market Value (USD Million) Forecast by User Group, 2020-2035
  • Table 70: Middle East and Africa Market Volume (Units) Forecast by User Group, 2020-2035

List of Figures

  • Figure 1: Global Market Value (USD Million) by Workout Type, 2025-2035
  • Figure 2: Global Market Value (USD Million) by Delivery Device, 2025-2035
  • Figure 3: Global Market Value (USD Million) by Pricing Model, 2025-2035
  • Figure 4: Global Market Value (USD Million) by User Group, 2025-2035
  • Figure 5: Global Market Value (USD Million) by Region, 2025-2035
  • Figure 6: Global Market Value (USD Million) Analysis by Region, 2020-2035
  • Figure 7: Global Market Volume (Units) Analysis by Region, 2020-2035
  • Figure 8: Global Market Value Share (%) and BPS Analysis by Region, 2025-2035
  • Figure 9: Global Market Y-o-Y Growth (%) Projections by Region, 2025-2035
  • Figure 10: Global Market Value (USD Million) Analysis by Workout Type, 2020-2035
  • Figure 11: Global Market Volume (Units) Analysis by Workout Type, 2020-2035
  • Figure 12: Global Market Value Share (%) and BPS Analysis by Workout Type, 2025-2035
  • Figure 13: Global Market Y-o-Y Growth (%) Projections by Workout Type, 2025-2035
  • Figure 14: Global Market Value (USD Million) Analysis by Delivery Device, 2020-2035
  • Figure 15: Global Market Volume (Units) Analysis by Delivery Device, 2020-2035
  • Figure 16: Global Market Value Share (%) and BPS Analysis by Delivery Device, 2025-2035
  • Figure 17: Global Market Y-o-Y Growth (%) Projections by Delivery Device, 2025-2035
  • Figure 18: Global Market Value (USD Million) Analysis by Pricing Model, 2020-2035
  • Figure 19: Global Market Volume (Units) Analysis by Pricing Model, 2020-2035
  • Figure 20: Global Market Value Share (%) and BPS Analysis by Pricing Model, 2025-2035
  • Figure 21: Global Market Y-o-Y Growth (%) Projections by Pricing Model, 2025-2035
  • Figure 22: Global Market Value (USD Million) Analysis by User Group, 2020-2035
  • Figure 23: Global Market Volume (Units) Analysis by User Group, 2020-2035
  • Figure 24: Global Market Value Share (%) and BPS Analysis by User Group, 2025-2035
  • Figure 25: Global Market Y-o-Y Growth (%) Projections by User Group, 2025-2035
  • Figure 26: Global Market Attractiveness by Workout Type, 2025-2035
  • Figure 27: Global Market Attractiveness by Delivery Device, 2025-2035
  • Figure 28: Global Market Attractiveness by Pricing Model, 2025-2035
  • Figure 29: Global Market Attractiveness by User Group, 2025-2035
  • Figure 30: Global Market Attractiveness by Region, 2025-2035
  • Figure 31: North America Market Value (USD Million) by Workout Type, 2025-2035
  • Figure 32: North America Market Value (USD Million) by Delivery Device, 2025-2035
  • Figure 33: North America Market Value (USD Million) by Pricing Model, 2025-2035
  • Figure 34: North America Market Value (USD Million) by User Group, 2025-2035
  • Figure 35: North America Market Value (USD Million) by Country, 2025-2035
  • Figure 36: North America Market Value (USD Million) Analysis by Country, 2020-2035
  • Figure 37: North America Market Volume (Units) Analysis by Country, 2020-2035
  • Figure 38: North America Market Value Share (%) and BPS Analysis by Country, 2025-2035
  • Figure 39: North America Market Y-o-Y Growth (%) Projections by Country, 2025-2035
  • Figure 40: North America Market Value (USD Million) Analysis by Workout Type, 2020-2035
  • Figure 41: North America Market Volume (Units) Analysis by Workout Type, 2020-2035
  • Figure 42: North America Market Value Share (%) and BPS Analysis by Workout Type, 2025-2035
  • Figure 43: North America Market Y-o-Y Growth (%) Projections by Workout Type, 2025-2035
  • Figure 44: North America Market Value (USD Million) Analysis by Delivery Device, 2020-2035
  • Figure 45: North America Market Volume (Units) Analysis by Delivery Device, 2020-2035
  • Figure 46: North America Market Value Share (%) and BPS Analysis by Delivery Device, 2025-2035
  • Figure 47: North America Market Y-o-Y Growth (%) Projections by Delivery Device, 2025-2035
  • Figure 48: North America Market Value (USD Million) Analysis by Pricing Model, 2020-2035
  • Figure 49: North America Market Volume (Units) Analysis by Pricing Model, 2020-2035
  • Figure 50: North America Market Value Share (%) and BPS Analysis by Pricing Model, 2025-2035
  • Figure 51: North America Market Y-o-Y Growth (%) Projections by Pricing Model, 2025-2035
  • Figure 52: North America Market Value (USD Million) Analysis by User Group, 2020-2035
  • Figure 53: North America Market Volume (Units) Analysis by User Group, 2020-2035
  • Figure 54: North America Market Value Share (%) and BPS Analysis by User Group, 2025-2035
  • Figure 55: North America Market Y-o-Y Growth (%) Projections by User Group, 2025-2035
  • Figure 56: North America Market Attractiveness by Workout Type, 2025-2035
  • Figure 57: North America Market Attractiveness by Delivery Device, 2025-2035
  • Figure 58: North America Market Attractiveness by Pricing Model, 2025-2035
  • Figure 59: North America Market Attractiveness by User Group, 2025-2035
  • Figure 60: North America Market Attractiveness by Country, 2025-2035
  • Figure 61: Latin America Market Value (USD Million) by Workout Type, 2025-2035
  • Figure 62: Latin America Market Value (USD Million) by Delivery Device, 2025-2035
  • Figure 63: Latin America Market Value (USD Million) by Pricing Model, 2025-2035
  • Figure 64: Latin America Market Value (USD Million) by User Group, 2025-2035
  • Figure 65: Latin America Market Value (USD Million) by Country, 2025-2035
  • Figure 66: Latin America Market Value (USD Million) Analysis by Country, 2020-2035
  • Figure 67: Latin America Market Volume (Units) Analysis by Country, 2020-2035
  • Figure 68: Latin America Market Value Share (%) and BPS Analysis by Country, 2025-2035
  • Figure 69: Latin America Market Y-o-Y Growth (%) Projections by Country, 2025-2035
  • Figure 70: Latin America Market Value (USD Million) Analysis by Workout Type, 2020-2035
  • Figure 71: Latin America Market Volume (Units) Analysis by Workout Type, 2020-2035
  • Figure 72: Latin America Market Value Share (%) and BPS Analysis by Workout Type, 2025-2035
  • Figure 73: Latin America Market Y-o-Y Growth (%) Projections by Workout Type, 2025-2035
  • Figure 74: Latin America Market Value (USD Million) Analysis by Delivery Device, 2020-2035
  • Figure 75: Latin America Market Volume (Units) Analysis by Delivery Device, 2020-2035
  • Figure 76: Latin America Market Value Share (%) and BPS Analysis by Delivery Device, 2025-2035
  • Figure 77: Latin America Market Y-o-Y Growth (%) Projections by Delivery Device, 2025-2035
  • Figure 78: Latin America Market Value (USD Million) Analysis by Pricing Model, 2020-2035
  • Figure 79: Latin America Market Volume (Units) Analysis by Pricing Model, 2020-2035
  • Figure 80: Latin America Market Value Share (%) and BPS Analysis by Pricing Model, 2025-2035
  • Figure 81: Latin America Market Y-o-Y Growth (%) Projections by Pricing Model, 2025-2035
  • Figure 82: Latin America Market Value (USD Million) Analysis by User Group, 2020-2035
  • Figure 83: Latin America Market Volume (Units) Analysis by User Group, 2020-2035
  • Figure 84: Latin America Market Value Share (%) and BPS Analysis by User Group, 2025-2035
  • Figure 85: Latin America Market Y-o-Y Growth (%) Projections by User Group, 2025-2035
  • Figure 86: Latin America Market Attractiveness by Workout Type, 2025-2035
  • Figure 87: Latin America Market Attractiveness by Delivery Device, 2025-2035
  • Figure 88: Latin America Market Attractiveness by Pricing Model, 2025-2035
  • Figure 89: Latin America Market Attractiveness by User Group, 2025-2035
  • Figure 90: Latin America Market Attractiveness by Country, 2025-2035
  • Figure 91: Europe Market Value (USD Million) by Workout Type, 2025-2035
  • Figure 92: Europe Market Value (USD Million) by Delivery Device, 2025-2035
  • Figure 93: Europe Market Value (USD Million) by Pricing Model, 2025-2035
  • Figure 94: Europe Market Value (USD Million) by User Group, 2025-2035
  • Figure 95: Europe Market Value (USD Million) by Country, 2025-2035
  • Figure 96: Europe Market Value (USD Million) Analysis by Country, 2020-2035
  • Figure 97: Europe Market Volume (Units) Analysis by Country, 2020-2035
  • Figure 98: Europe Market Value Share (%) and BPS Analysis by Country, 2025-2035
  • Figure 99: Europe Market Y-o-Y Growth (%) Projections by Country, 2025-2035
  • Figure 100: Europe Market Value (USD Million) Analysis by Workout Type, 2020-2035
  • Figure 101: Europe Market Volume (Units) Analysis by Workout Type, 2020-2035
  • Figure 102: Europe Market Value Share (%) and BPS Analysis by Workout Type, 2025-2035
  • Figure 103: Europe Market Y-o-Y Growth (%) Projections by Workout Type, 2025-2035
  • Figure 104: Europe Market Value (USD Million) Analysis by Delivery Device, 2020-2035
  • Figure 105: Europe Market Volume (Units) Analysis by Delivery Device, 2020-2035
  • Figure 106: Europe Market Value Share (%) and BPS Analysis by Delivery Device, 2025-2035
  • Figure 107: Europe Market Y-o-Y Growth (%) Projections by Delivery Device, 2025-2035
  • Figure 108: Europe Market Value (USD Million) Analysis by Pricing Model, 2020-2035
  • Figure 109: Europe Market Volume (Units) Analysis by Pricing Model, 2020-2035
  • Figure 110: Europe Market Value Share (%) and BPS Analysis by Pricing Model, 2025-2035
  • Figure 111: Europe Market Y-o-Y Growth (%) Projections by Pricing Model, 2025-2035
  • Figure 112: Europe Market Value (USD Million) Analysis by User Group, 2020-2035
  • Figure 113: Europe Market Volume (Units) Analysis by User Group, 2020-2035
  • Figure 114: Europe Market Value Share (%) and BPS Analysis by User Group, 2025-2035
  • Figure 115: Europe Market Y-o-Y Growth (%) Projections by User Group, 2025-2035
  • Figure 116: Europe Market Attractiveness by Workout Type, 2025-2035
  • Figure 117: Europe Market Attractiveness by Delivery Device, 2025-2035
  • Figure 118: Europe Market Attractiveness by Pricing Model, 2025-2035
  • Figure 119: Europe Market Attractiveness by User Group, 2025-2035
  • Figure 120: Europe Market Attractiveness by Country, 2025-2035
  • Figure 121: East Asia Market Value (USD Million) by Workout Type, 2025-2035
  • Figure 122: East Asia Market Value (USD Million) by Delivery Device, 2025-2035
  • Figure 123: East Asia Market Value (USD Million) by Pricing Model, 2025-2035
  • Figure 124: East Asia Market Value (USD Million) by User Group, 2025-2035
  • Figure 125: East Asia Market Value (USD Million) by Country, 2025-2035
  • Figure 126: East Asia Market Value (USD Million) Analysis by Country, 2020-2035
  • Figure 127: East Asia Market Volume (Units) Analysis by Country, 2020-2035
  • Figure 128: East Asia Market Value Share (%) and BPS Analysis by Country, 2025-2035
  • Figure 129: East Asia Market Y-o-Y Growth (%) Projections by Country, 2025-2035
  • Figure 130: East Asia Market Value (USD Million) Analysis by Workout Type, 2020-2035
  • Figure 131: East Asia Market Volume (Units) Analysis by Workout Type, 2020-2035
  • Figure 132: East Asia Market Value Share (%) and BPS Analysis by Workout Type, 2025-2035
  • Figure 133: East Asia Market Y-o-Y Growth (%) Projections by Workout Type, 2025-2035
  • Figure 134: East Asia Market Value (USD Million) Analysis by Delivery Device, 2020-2035
  • Figure 135: East Asia Market Volume (Units) Analysis by Delivery Device, 2020-2035
  • Figure 136: East Asia Market Value Share (%) and BPS Analysis by Delivery Device, 2025-2035
  • Figure 137: East Asia Market Y-o-Y Growth (%) Projections by Delivery Device, 2025-2035
  • Figure 138: East Asia Market Value (USD Million) Analysis by Pricing Model, 2020-2035
  • Figure 139: East Asia Market Volume (Units) Analysis by Pricing Model, 2020-2035
  • Figure 140: East Asia Market Value Share (%) and BPS Analysis by Pricing Model, 2025-2035
  • Figure 141: East Asia Market Y-o-Y Growth (%) Projections by Pricing Model, 2025-2035
  • Figure 142: East Asia Market Value (USD Million) Analysis by User Group, 2020-2035
  • Figure 143: East Asia Market Volume (Units) Analysis by User Group, 2020-2035
  • Figure 144: East Asia Market Value Share (%) and BPS Analysis by User Group, 2025-2035
  • Figure 145: East Asia Market Y-o-Y Growth (%) Projections by User Group, 2025-2035
  • Figure 146: East Asia Market Attractiveness by Workout Type, 2025-2035
  • Figure 147: East Asia Market Attractiveness by Delivery Device, 2025-2035
  • Figure 148: East Asia Market Attractiveness by Pricing Model, 2025-2035
  • Figure 149: East Asia Market Attractiveness by User Group, 2025-2035
  • Figure 150: East Asia Market Attractiveness by Country, 2025-2035
  • Figure 151: South Asia & Pacific Market Value (USD Million) by Workout Type, 2025-2035
  • Figure 152: South Asia & Pacific Market Value (USD Million) by Delivery Device, 2025-2035
  • Figure 153: South Asia & Pacific Market Value (USD Million) by Pricing Model, 2025-2035
  • Figure 154: South Asia & Pacific Market Value (USD Million) by User Group, 2025-2035
  • Figure 155: South Asia & Pacific Market Value (USD Million) by Country, 2025-2035
  • Figure 156: South Asia & Pacific Market Value (USD Million) Analysis by Country, 2020-2035
  • Figure 157: South Asia & Pacific Market Volume (Units) Analysis by Country, 2020-2035
  • Figure 158: South Asia & Pacific Market Value Share (%) and BPS Analysis by Country, 2025-2035
  • Figure 159: South Asia & Pacific Market Y-o-Y Growth (%) Projections by Country, 2025-2035
  • Figure 160: South Asia & Pacific Market Value (USD Million) Analysis by Workout Type, 2020-2035
  • Figure 161: South Asia & Pacific Market Volume (Units) Analysis by Workout Type, 2020-2035
  • Figure 162: South Asia & Pacific Market Value Share (%) and BPS Analysis by Workout Type, 2025-2035
  • Figure 163: South Asia & Pacific Market Y-o-Y Growth (%) Projections by Workout Type, 2025-2035
  • Figure 164: South Asia & Pacific Market Value (USD Million) Analysis by Delivery Device, 2020-2035
  • Figure 165: South Asia & Pacific Market Volume (Units) Analysis by Delivery Device, 2020-2035
  • Figure 166: South Asia & Pacific Market Value Share (%) and BPS Analysis by Delivery Device, 2025-2035
  • Figure 167: South Asia & Pacific Market Y-o-Y Growth (%) Projections by Delivery Device, 2025-2035
  • Figure 168: South Asia & Pacific Market Value (USD Million) Analysis by Pricing Model, 2020-2035
  • Figure 169: South Asia & Pacific Market Volume (Units) Analysis by Pricing Model, 2020-2035
  • Figure 170: South Asia & Pacific Market Value Share (%) and BPS Analysis by Pricing Model, 2025-2035
  • Figure 171: South Asia & Pacific Market Y-o-Y Growth (%) Projections by Pricing Model, 2025-2035
  • Figure 172: South Asia & Pacific Market Value (USD Million) Analysis by User Group, 2020-2035
  • Figure 173: South Asia & Pacific Market Volume (Units) Analysis by User Group, 2020-2035
  • Figure 174: South Asia & Pacific Market Value Share (%) and BPS Analysis by User Group, 2025-2035
  • Figure 175: South Asia & Pacific Market Y-o-Y Growth (%) Projections by User Group, 2025-2035
  • Figure 176: South Asia & Pacific Market Attractiveness by Workout Type, 2025-2035
  • Figure 177: South Asia & Pacific Market Attractiveness by Delivery Device, 2025-2035
  • Figure 178: South Asia & Pacific Market Attractiveness by Pricing Model, 2025-2035
  • Figure 179: South Asia & Pacific Market Attractiveness by User Group, 2025-2035
  • Figure 180: South Asia & Pacific Market Attractiveness by Country, 2025-2035
  • Figure 181: Middle East and Africa Market Value (USD Million) by Workout Type, 2025-2035
  • Figure 182: Middle East and Africa Market Value (USD Million) by Delivery Device, 2025-2035
  • Figure 183: Middle East and Africa Market Value (USD Million) by Pricing Model, 2025-2035
  • Figure 184: Middle East and Africa Market Value (USD Million) by User Group, 2025-2035
  • Figure 185: Middle East and Africa Market Value (USD Million) by Country, 2025-2035
  • Figure 186: Middle East and Africa Market Value (USD Million) Analysis by Country, 2020-2035
  • Figure 187: Middle East and Africa Market Volume (Units) Analysis by Country, 2020-2035
  • Figure 188: Middle East and Africa Market Value Share (%) and BPS Analysis by Country, 2025-2035
  • Figure 189: Middle East and Africa Market Y-o-Y Growth (%) Projections by Country, 2025-2035
  • Figure 190: Middle East and Africa Market Value (USD Million) Analysis by Workout Type, 2020-2035
  • Figure 191: Middle East and Africa Market Volume (Units) Analysis by Workout Type, 2020-2035
  • Figure 192: Middle East and Africa Market Value Share (%) and BPS Analysis by Workout Type, 2025-2035
  • Figure 193: Middle East and Africa Market Y-o-Y Growth (%) Projections by Workout Type, 2025-2035
  • Figure 194: Middle East and Africa Market Value (USD Million) Analysis by Delivery Device, 2020-2035
  • Figure 195: Middle East and Africa Market Volume (Units) Analysis by Delivery Device, 2020-2035
  • Figure 196: Middle East and Africa Market Value Share (%) and BPS Analysis by Delivery Device, 2025-2035
  • Figure 197: Middle East and Africa Market Y-o-Y Growth (%) Projections by Delivery Device, 2025-2035
  • Figure 198: Middle East and Africa Market Value (USD Million) Analysis by Pricing Model, 2020-2035
  • Figure 199: Middle East and Africa Market Volume (Units) Analysis by Pricing Model, 2020-2035
  • Figure 200: Middle East and Africa Market Value Share (%) and BPS Analysis by Pricing Model, 2025-2035
  • Figure 201: Middle East and Africa Market Y-o-Y Growth (%) Projections by Pricing Model, 2025-2035
  • Figure 202: Middle East and Africa Market Value (USD Million) Analysis by User Group, 2020-2035
  • Figure 203: Middle East and Africa Market Volume (Units) Analysis by User Group, 2020-2035
  • Figure 204: Middle East and Africa Market Value Share (%) and BPS Analysis by User Group, 2025-2035
  • Figure 205: Middle East and Africa Market Y-o-Y Growth (%) Projections by User Group, 2025-2035
  • Figure 206: Middle East and Africa Market Attractiveness by Workout Type, 2025-2035
  • Figure 207: Middle East and Africa Market Attractiveness by Delivery Device, 2025-2035
  • Figure 208: Middle East and Africa Market Attractiveness by Pricing Model, 2025-2035
  • Figure 209: Middle East and Africa Market Attractiveness by User Group, 2025-2035
  • Figure 210: Middle East and Africa Market Attractiveness by Country, 2025-2035

Frequently Asked Questions

How big is the AR Fitness Services Market in 2025?

The AR Fitness Services Market is estimated to be valued at USD 2,902.3 million in 2025.

What will be the size of the AR Fitness Services Market in 2035?

The market size for the AR Fitness Services Market is projected to reach USD 11,750.4 million by 2035.

How much will be the AR Fitness Services Market growth between 2025 and 2035?

The AR Fitness Services Market is expected to grow at a 15.0% CAGR between 2025 and 2035.

What are the key workout types in the AR Fitness Services Market?

The key workout types in the AR Fitness Services Market are AR gamified cardio, AR strength training, AR yoga/meditation, and AR dance & group fitness.

Which user group segment will contribute significant share in the AR Fitness Services Market in 2025?

In terms of user groups, the home fitness consumers segment is expected to command the largest share in the AR Fitness Services Market in 2025.

Explore Similar Insights

Future Market Insights

AR Fitness Services Market