Areca Nut Market Size, Share, and Forecast Outlook 2025 to 2035 

The global areca nut market is projected to reach USD 1,008 million by 2025 and USD 2,075 million by 2035, based on a consistent CAGR of 7.9% during the forecast period. This translates to an absolute dollar opportunity of over USD 1.2 billion across the forecast horizon.
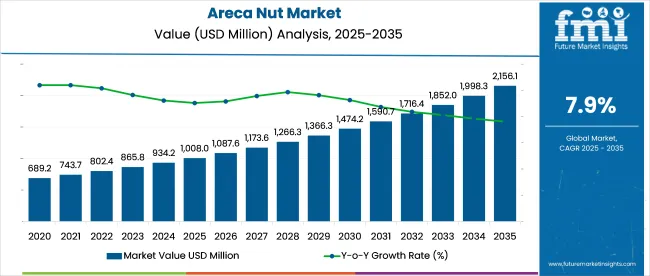
Quick Stats of the Areca Nut Market

  • Market Value (2025): USD 1,008 million
  • Forecast Value (2035): USD 2,075 million
  • Forecast CAGR (2025 to 2035): 7.9%
  • Leading Segment in 2025: Indian (75% share)
  • Key Growth Region: Asia Pacific (India is the fastest growing market with 8.8% CAGR)
  • Key Players: GM Group, Surya Exim, K. TRADING, Biotan Pharma, Shri Ganesh Prasad Traders, Marlene Traders Co., Ltd., Viet D.E.L.T.A Industrial Co., Ltd, SWASTIKA INTERNATIONAL, THE CAMPCO LTD., SRI VINAYAKA BETELNUT TRADERS.

Areca Nut Market Market

Attribute Values
Estimated Industry Size (2025E) USD 1,008 million
Projected Industry Value (2035F) USD 2,075 million
CAGR (2025 to 2035) 7.9%

In volume terms, markets in India, Bangladesh, Myanmar, and Indonesia are contributing to more than 70% of global consumption, while demand from the Middle East and North African (MENA)and European ethnic segmentsis rising steadily. India remains the dominant producer and consumer, accounting for over 45% of total production and domestic consumption, with Karnataka, Kerala, and Assam as key cultivation zones.

The industry accounts for varying levels of share across its parent markets. Within the food & beverage industry, it accounts for 0.5% of global value due to its niche application in traditional and regional products. In the agricultural commodities market, theycontribute around 1.2%, driven by their economic significance in South and Southeast Asia.

Its presence in the convenience and functional food market is limited, at less than 0.3%, as its use is highly localized. However, in the traditional medicine and herbal products market, it captures nearly 2.5% due to its frequent use in Ayurveda and traditional Chinese medicine. In the natural stimulants market, its share is higher, at 4.1%, owing to its psychoactive properties and habitual consumption.

Areca nut, widely known for its traditional use in betel quid chewing, is witnessing a broader application portfolio that includes medicinal and therapeutic use cases, particularly in Ayurveda and traditional Asian medicine. The demand surge can be traced to rising consumer awareness about herbal and natural products and their perceived health benefits.

As health-conscious consumers in Southeast Asia and parts of South Asia continue to favor natural stimulants over synthetic alternatives, this finding has increased relevance. Despite regulatory scrutiny in some countries due to health concerns associated with excessive consumption, demand continues to persist across rural and urban markets, driven by cultural embedding and habitual consumption patterns. The economic significance of product cultivation is also prompting regional governments to invest in farming practices and market infrastructure.

Analyzing Areca Nut Market by Top Investment Segments

Chali areca nuts lead the market with a 70% share due to their longer shelf life, cost-effectiveness, and strong demand in India and Bangladesh. The Indian variety dominates with a 75% share, driven by superior quality, cultural relevance, and robust domestic production supported by organized cooperatives like The CAMPCO Ltd.
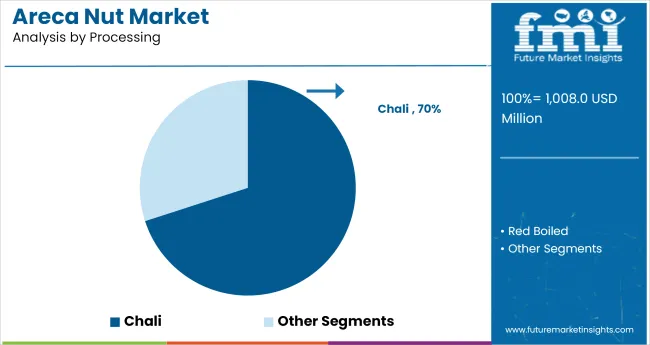
Chali Areca Nut Leads the Market by Processing Segment

Areca Nut Market Analysis By Processing

The Chali areca nut segment dominates the market by processing type, accounting for an estimated 70% share of global demand as of 2025. This dominance is attributed to its widespread consumption, especially in India and Bangladesh, where dried whole nuts are preferred for chewing and traditional uses.

  • Chali nuts, being sun-dried and less processed compared to red boiled variants, offer longer shelf life and lower production costs, making them economically viable for both farmers and processors.
  • Chali are more suitable for export due to their stable quality and ease of transportation.
  • The segment continues to benefit from entrenched cultural preferences and strong demand in domestic retail and wholesale markets, further solidifying its position as the leading processed form.

By Varieties, Indian Segment Accounts for Over 75% Share

Areca Nut Market Analysis By Varieties 

The Indian areca nut variety holds the leading position in the global market, commanding 75% of the total market share by variety in 2025. This dominance is primarily due to India's position as the largest producer and consumer of areca nut globally, with key cultivation hubs in Karnataka, Kerala, and Assam.

  • Indian areca nuts are highly preferred for their superior quality, uniform size, and higher alkaloid content, making them particularly desirable in chewing applications.
  • The deep cultural integration of the product in Indian social rituals, religious ceremonies, and daily habits supports domestic demand.
  • Organized cooperative structures like The CAMPCO Ltd. in India ensure stable pricing, quality control, and efficient market distribution, enhancing the segment’s global competitiveness over non-Indian varieties.

Top Areca Nut Market Dynamics

The areca nut market is expanding due to strong cultural demand, growing herbal stimulant use, and rising exports, especially from South Asia. India leads with organized farming and stable yields, while regulatory pressures are driving a shift toward certified, low-alkaloid varieties.

Dynamics Driving Areca Nut Market Expansion

The global areca nut market is witnessing strong demand-side momentum, primarily fueled by traditional and habitual consumption patterns across South and Southeast Asia. Chewing applications continue to dominate, supported by deep-rooted cultural practices in India, Bangladesh, and Myanmar.

Rising demand for herbal and plant-based stimulants has introduced new consumer segments, particularly in urban and diaspora communities. The medicinal and ayurvedic uses of the product further add to its appeal, especially in natural health product markets. Export demand is also on the rise, particularly from the Gulf and East African regions.

  • Cultural and habitual chewingnon-cyclical demand
  • Growth in herbal and natural product preferences boosts adoption
  • Rising exports to the Gulf and African countries expand global reach

Regulatory Factors Shaping Market Structure

On the supply side, India remains the largest producer, benefiting from organized cooperative systems and government support for farming. Stability in production volumes is further ensured by efficient post-harvest management practices and expanding cultivation acreage in states like Karnataka and Assam.

However, the market is increasingly shaped by regulatory scrutiny, especially due to health-related concerns tied to overconsumption. In response, producers are investing in premium-grade, low-alkaloid varieties and quality certifications to meet global compliance standards and retain market access.
  • India’s dominance is secured by robust farmer cooperatives like CAMPCO
  • Expanding cultivation and stable yields ensure a consistent supply
  • Regulatory push drives shift toward certified, premium-grade products

Analysis of Top Countries Producing and Supplying Areca Nut Globally

Country Wise Analysis Of Areca Nut Market

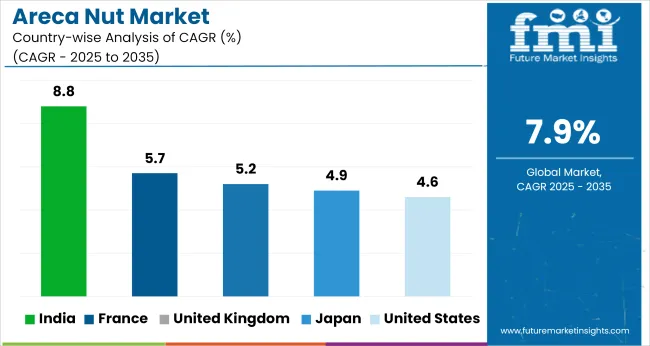
Countries CAGR (2025 to 2035)
United States 4.6%
United Kingdom 5.2%
France 5.7%
Japan 4.9%
India 8.8%

The industry is expected to grow at varied rates across key global economies, shaped by cultural, regulatory, and demographic factors. India leads with the highest CAGR of 8.8%, driven by its status as the world’s largest consumer and producer, with widespread cultural use, strong cooperative networks like CAMPCO, and integration into traditional medicine such as Ayurveda.

France (5.7%), the United Kingdom (5.2%), Japan (4.9%), and the United States (4.6%) represent moderate-growth markets, primarily driven by South and Southeast Asian diaspora consumption. These developed markets, all part of the OECD and G7 groups, reflect niche demand trends influenced by ethnic habits and growing interest in natural stimulants, though moderated by regulatory oversight and health labeling requirements.

India, being part of BRICS, G20, and SCO, continues to dominate through its cultural affinity and institutional support, while developed countries maintain steady demand through specialty retail and compliant imports.

The report covers a detailed analysis of 40+ countries, and the top five countries have been shared as a reference.

The USA Areca Nut Market Insights

The USA areca nut market is estimated to grow at a CAGR of 4.6% during the forecast period. Areca nut consumption is gaining traction primarily within immigrant communities from South and Southeast Asia, where the product holds cultural significance. The increasing availability of international and ethnic products in specialty grocery stores and e-commerce platforms has enhanced accessibility to areca nut products.

Consumers within the Indian, Bangladeshi, Burmese, and Nepalese diaspora often continue the practice of chewing areca nut as a traditional stimulant, driving steady growth. While the USA regulatory environment poses strict labeling and health warnings, demand remains resilient in pockets of ethnic populations.

Small-scale importers and distributors cater to this niche, ensuring consistent supply through direct sourcing from India and Myanmar. Awareness of cultural practices and relaxation in some regional regulations regarding traditional imports has made the USA a stable yet regulated market.

  • Strong diaspora demand niche consumption
  • Ethnic retailers and e-commerce support product access
  • Regulatory compliance encourages the import of labeled, approved products

Areca Nut Sales Analysis in the UK

The UK areca nut market is projected to expand at a CAGR of 5.2% through 2035. The presence of large Indian, Pakistani, Bangladeshi, and Sri Lankan communities continues to drive demand for areca nut products. The chewing of betel quid remains a socially embedded habit among first-generation migrants and older adults, which baseline demand. While awareness about potential health risks has slowed uptake among younger populations, niche cultural use ensures a consistent buyer base.

The UK market is also benefiting from ethnic grocery chains and online stores that import high-quality products, mainly from India. The government mandates health warning labels, but products with compliant packaging and certified sourcing are permitted in the market. As demand stabilizes within these ethnic segments, some small enterprises are also exploring premium, herbal-blended formulations that appeal to the evolving preference for natural stimulants.

  • Migrant community habits maintain consumption levels
  • Growth in ethnic grocery retail and online imports
  • Regulatory acceptance with proper health labeling ensures market access

France Areca Nut Market Analysis

The France areca nut market is forecast to grow at a CAGR of 5.7% during the forecast period, and rising areca nut imports are linked to demand from Southeast Asian and Indian communities residing in centers like Paris, Marseille, and Lyon. Though traditionally not a French staple, the product is consumed by specific diaspora groups for its psychoactive and cultural value.

Local specialty stores and ethnic supermarkets are expanding their offerings to include processed forms like Chali and pan masala blends. France's consumer shifts toward plant-based and herbal alternatives have indirectly supported interest in ethnic botanicals, despite regulatory limitations.

While new consumption is not mainstream, the stability of demand among migrants is a small but reliable market. The industry is gradually exploring health-compliant formulations with proper labeling to navigate France's tight food safety frameworks and leverage demand through regulated trade.

  • Urban diaspora centers act as high-demand zones
  • Ethnic retail chains introduce new SKUs and formats
  • Focus on regulated imports with certified quality and labeling

Areca Nut Demand Analysis in Japan

The Japanese areca nut market is expected to grow at a CAGR of 4.9% from 2025 to 2035 Japan represents a niche but gradually evolving market for areca nut, with demand coming from Southeast Asian workers and small cultural enclaves. The consumption is still limited and remains within specific regions where ethnic stores cater to foreign labor populations.

Japan's strict import laws and quality control regulations restrict the entry of processed food items unless well-documented and compliant with the Food Sanitation Act. However, demand is steadily growing through formalized ethnic trade networks, and some companies are exploring value-added derivatives in traditional medicine and oral health supplements.

While general Japanese consumers do not consume widely, awareness is increasing due to its inclusion in some imported herbal products marketed for digestion and alertness. The market is small in size but promising in specialized retail formats and health-compliant derivatives.

  • Growth driven by Southeast Asian workforce and cultural zones
  • Product acceptance through regulated, traditional health channels
  • Strict quality control pushes demand for certified and traceable imports

India Areca Nut Market Analysis

The Indian areca nut market is projected to grow at a CAGR of 8.8% between 2025 and 2035. India remains the world's largest consumer and producer of areca nut, with deeply embedded cultural and economic connections to the product. Consumption spans all age groups and income levels, especially in the form of chewing products such as betel quid and pan masala.

The domestic market is driven by high-volume retail, institutional demand, and widespread small-scale consumption across populations. Government support through cooperatives like The CAMPCO Ltd. and regional subsidies ensures a strong supply chain infrastructure and farmer participation.

In India, it is also used in traditional medicine, particularly Ayurveda, adding a complementary layer of demand. The sector is evolving with better drying, processing, and packaging technologies to meet rising safety and quality standards. The growing preference for natural stimulants and the cultural continuity of chewing habits ensure India’s dominance in both consumption and cultivation.
  • Cultural continuity and chewing habits ensure a stable, growing demand
  • Government-backed cooperatives support production and price stability
  • Advances in processing boost product safety and market competitiveness

Leading Areca Nut Suppliers

Areca Nut Market Analysis By Company

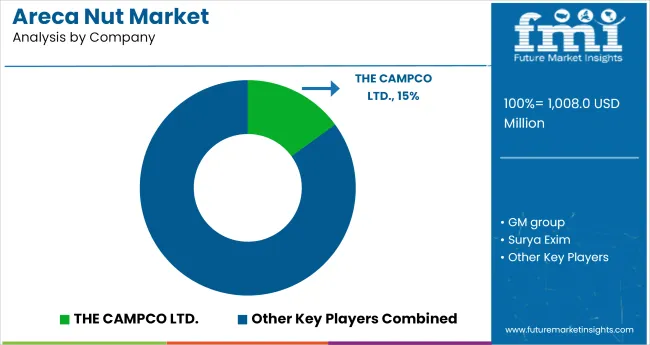
In the areca nut industry, key players are leveraging regional sourcing strength, cultural familiarity, and trade linkages to expand their footprints across domestic and export channels. Companies such as GM Group, Surya Exim, and K. TRADING are tapping into wholesale and bulk distribution networks across South Asia and the Gulf.

Firms like Biotan Pharma and Marlene Traders Co., Ltd. are positioning themselves in value-added applications, including nutraceuticals and herbal blends. THE CAMPCO LTD., a cooperative-based giant, dominates with traceable sourcing and farmer partnerships.

Exporters such as Viet D.E.L.T.A Industrial Co. Ltd and SWASTIKA INTERNATIONAL are building scale in ASEAN and Middle Eastern markets. Shri Ganesh Prasad Traders and SRI VINAYAKA BETELNUT TRADERS are reinforcing their presence through hybrid procurement and regional retail partnerships to cater to growing ethnic demand.

Recent Areca Nut Industry News

  • In September 2024, CAMPCO secured government approval for collaborative health research with premier institutions like AIIMS and IISc to clarify areca nut’s safety profile.

Leading Players

  • GM group
  • Surya Exim
  • K. TRADING
  • Biotan Pharma
  • Shri Ganesh Prasad Traders
  • Marlene Traders Co., Ltd.
  • Viet D.E.L.T.A Industrial Co. Ltd
  • SWASTIKA INTERNATIONAL
  • THE CAMPCO LTD.
  • SRI VINAYAKA BETELNUT TRADERS

Report Coverage and Scope Summary

Report Attributes Details
Market Size (2025) USD 1,008 million
Projected Market Size (2035) USD 2,075 million
CAGR (2025 to 2035) 7.9%
Base Year for Estimation 2024
Historical Period 2020 to 2024
Projections Period 2025 to 2035
Quantitative Units USD million for value and volume in metric tons
Processing Analyzed (Segment 1) Chali and Red Boiled.
Varieties Analyzed (Segment 2) Indian (South Kanaka, Thirthahali, Rotha, Mettupalayam, Kahikuchi, Mohitnaga) and non-Indian (Mangala, Sumangala, Sree Mangala, Others).
Regions Covered North America, Europe, Asia Pacific, Middle East & Africa, Latin America
Countries Covered United States, Canada, Germany, United Kingdom, France, Italy, Spain, China, Japan, South Korea, India, Australia, Brazil, Mexico, Argentina, Saudi Arabia, UAE, South Africa
Key Players GM Group, Surya Exim, K. TRADING, Biotan Pharma, Shri Ganesh Prasad Traders, Marlene Traders Co., Ltd., Viet D.E.L.T.A Industrial Co., Ltd, SWASTIKA INTERNATIONAL, THE CAMPCO LTD., SRI VINAYAKA BETELNUT TRADERS.
Additional Attributes Dollar sales, share, volume trends, top consuming regions, buyer behavior, export-import flows, regulatory updates, pricing dynamics, competitive positioning, and future demand forecasts.

Key Segmentation

By Processing:

The industry is segmented into chali and red boiled.

By Varieties:

The industry is segmented into Indian (South Kanaka, Thirthahali, Rotha, Mettupalayam, Kahikuchi, Mohitnaga) and non-Indian (Mangala, Sumangala, SreeMangala, Others).

By Region:

The industry covers regions including North America, Europe, Asia Pacific, Latin America, and the Middle East & Africa.

Table of Content

  1. Executive Summary
    • Global Market Outlook
    • Demand-side Trends
    • Supply-side Trends
    • Technology Roadmap Analysis
    • Analysis and Recommendations
  2. Market Overview
    • Market Coverage/Taxonomy
    • Market Definition/Scope/Limitations
  3. Market Background
    • Market Dynamics
      • Drivers
      • Restraints
      • Opportunity
      • Trends
    • Scenario Forecast
      • Demand in Optimistic Scenario
      • Demand in Likely Scenario
      • Demand in Conservative Scenario
    • Opportunity Map Analysis
    • Product Life Cycle Analysis
    • Supply Chain Analysis
      • Supply Side Participants and their Roles
        • Producers
        • Mid-Level Participants (Traders/ Agents/ Brokers)
        • Wholesalers and Distributors
      • Value Added and Value Created at Node in the Supply Chain
      • List of Raw Material Suppliers
      • List of Existing and Potential Buyer’s
    • Investment Feasibility Matrix
    • Value Chain Analysis
      • Profit Margin Analysis
      • Wholesalers and Distributors
      • Retailers
    • PESTLE and Porter’s Analysis
    • Regulatory Landscape
      • By Key Regions
      • By Key Countries
    • Regional Parent Market Outlook
    • Production and Consumption Statistics
    • Import and Export Statistics
  4. Global Market Analysis 2020 to 2024 and Forecast, 2025 to 2035
    • Historical Market Size Value (USD Million) & Volume (Metric tons) Analysis, 2020 to 2024
    • Current and Future Market Size Value (USD Million) & Volume (Metric tons) Projections, 2025 to 2035
      • Y-o-Y Growth Trend Analysis
      • Absolute $ Opportunity Analysis
  5. Global Market Pricing Analysis 2020 to 2024 and Forecast 2025 to 2035
  6. Global Market Analysis 2020 to 2024 and Forecast 2025 to 2035, By Processing
    • Introduction/Key Findings
    • Historical Market Size Value (USD Million) & Volume (Metric tons) Analysis By Processing, 2020 to 2024
    • Current and Future Market Size Value (USD Million) & Volume (Metric tons) Analysis and Forecast By Processing, 2025 to 2035
      • Chali
      • Red Boiled
    • Y-o-Y Growth Trend Analysis By Processing, 2020 to 2024
    • Absolute $ Opportunity Analysis By Processing, 2025 to 2035
  7. Global Market Analysis 2020 to 2024 and Forecast 2025 to 2035, By Varieties
    • Introduction/Key Findings
    • Historical Market Size Value (USD Million) & Volume (Metric tons) Analysis By Varieties, 2020 to 2024
    • Current and Future Market Size Value (USD Million) & Volume (Metric tons) Analysis and Forecast By Varieties, 2025 to 2035
      • Indian
        • South Kanaka
        • Thirthahali
        • Rotha
        • Mettupalayam
        • Kahikuchi
        • Mohitnagar
      • Non-Indian
        • Mangala
        • Sumangala
        • Sree Mangala
        • Others
    • Y-o-Y Growth Trend Analysis By Varieties, 2020 to 2024
    • Absolute $ Opportunity Analysis By Varieties, 2025 to 2035
  8. Global Market Analysis 2020 to 2024 and Forecast 2025 to 2035, By Region
    • Introduction
    • Historical Market Size Value (USD Million) & Volume (Metric tons) Analysis By Region, 2020 to 2024
    • Current Market Size Value (USD Million) & Volume (Metric tons) Analysis and Forecast By Region, 2025 to 2035
      • North America
      • Latin America
      • Western Europe
      • Eastern Europe
      • East Asia
      • South Asia & Pacific
      • Middle East and Africa
    • Market Attractiveness Analysis By Region
  9. North America Market Analysis 2020 to 2024 and Forecast 2025 to 2035, By Country
    • Historical Market Size Value (USD Million) & Volume (Metric tons) Trend Analysis By Market Taxonomy, 2020 to 2024
    • Market Size Value (USD Million) & Volume (Metric tons) Forecast By Market Taxonomy, 2025 to 2035
      • By Country
        • USA
        • Canada
        • Mexico
      • By Processing
      • By Varieties
    • Market Attractiveness Analysis
      • By Country
      • By Processing
      • By Varieties
    • Key Takeaways
  10. Latin America Market Analysis 2020 to 2024 and Forecast 2025 to 2035, By Country
    • Historical Market Size Value (USD Million) & Volume (Metric tons) Trend Analysis By Market Taxonomy, 2020 to 2024
    • Market Size Value (USD Million) & Volume (Metric tons) Forecast By Market Taxonomy, 2025 to 2035
      • By Country
        • Brazil
        • Argentina
        • Rest of LATAM
      • By Processing
      • By Varieties
    • Market Attractiveness Analysis
      • By Country
      • By Processing
      • By Varieties
    • Key Takeaways
  11. Western Europe Market Analysis 2020 to 2024 and Forecast 2025 to 2035, By Country
    • Historical Market Size Value (USD Million) & Volume (Metric tons) Trend Analysis By Market Taxonomy, 2020 to 2024
    • Market Size Value (USD Million) & Volume (Metric tons) Forecast By Market Taxonomy, 2025 to 2035
      • By Country
        • Germany
        • Italy
        • France
        • UK
        • Spain
        • BENELUX
        • Nordic
        • Rest of W.Europe
      • By Processing
      • By Varieties
    • Market Attractiveness Analysis
      • By Country
      • By Processing
      • By Varieties
    • Key Takeaways
  12. Eastern Europe Market Analysis 2020 to 2024 and Forecast 2025 to 2035, By Country
    • Historical Market Size Value (USD Million) & Volume (Metric tons) Trend Analysis By Market Taxonomy, 2020 to 2024
    • Market Size Value (USD Million) & Volume (Metric tons) Forecast By Market Taxonomy, 2025 to 2035
      • By Country
        • Russia
        • Hungary
        • Poland
        • Balkan & Baltics
        • Rest of E. Europe
      • By Processing
      • By Varieties
    • Market Attractiveness Analysis
      • By Country
      • By Processing
      • By Varieties
    • Key Takeaways
  13. East Asia Market Analysis 2020 to 2024 and Forecast 2025 to 2035, By Country
    • Historical Market Size Value (USD Million) & Volume (Metric tons) Trend Analysis By Market Taxonomy, 2020 to 2024
    • Market Size Value (USD Million) & Volume (Metric tons) Forecast By Market Taxonomy, 2025 to 2035
      • By Country
        • China
        • Japan
        • South Korea
      • By Processing
      • By Varieties
    • Market Attractiveness Analysis
      • By Country
      • By Processing
      • By Varieties
    • Key Takeaways
  14. South Asia & Pacific Market Analysis 2020 to 2024 and Forecast 2025 to 2035, By Country
    • Historical Market Size Value (USD Million) & Volume (Metric tons) Trend Analysis By Market Taxonomy, 2020 to 2024
    • Market Size Value (USD Million) & Volume (Metric tons) Forecast By Market Taxonomy, 2025 to 2035
      • By Country
        • India
        • Australia & New Zealand
        • ASEAN
        • Rest of SAP
      • By Processing
      • By Varieties
    • Market Attractiveness Analysis
      • By Country
      • By Processing
      • By Varieties
    • Key Takeaways
  15. Middle East and Africa Market Analysis 2020 to 2024 and Forecast 2025 to 2035, By Country
    • Historical Market Size Value (USD Million) & Volume (Metric tons) Trend Analysis By Market Taxonomy, 2020 to 2024
    • Market Size Value (USD Million) & Volume (Metric tons) Forecast By Market Taxonomy, 2025 to 2035
      • By Country
        • GCC Countries
        • Northern Africa
        • South Africa
        • Turkiye
        • Rest of MEA
      • By Processing
      • By Varieties
    • Market Attractiveness Analysis
      • By Country
      • By Processing
      • By Varieties
    • Key Takeaways
  16. Key Countries Market Analysis
    • USA
      • Pricing Analysis
      • Market Share Analysis, 2024
        • By Processing
        • By Varieties
    • Canada
      • Pricing Analysis
      • Market Share Analysis, 2024
        • By Processing
        • By Varieties
    • Brazil
      • Pricing Analysis
      • Market Share Analysis, 2024
        • By Processing
        • By Varieties
    • Mexico
      • Pricing Analysis
      • Market Share Analysis, 2024
        • By Processing
        • By Varieties
    • Argentina
      • Pricing Analysis
      • Market Share Analysis, 2024
        • By Processing
        • By Varieties
  17. Market Structure Analysis
    • Competition Dashboard
    • Competition Benchmarking
    • Market Share Analysis of Top Players
      • By Regional
      • By Processing
      • By Varieties
  18. Competition Analysis
    • Competition Deep Dive
      • GM group
        • Overview
        • Product Portfolio
        • Profitability by Market Segments (Product/Age /Sales Channel/Region)
        • Sales Footprint
        • Strategy Overview
          • Marketing Strategy
          • Product Strategy
          • Channel Strategy
      • Surya Exim
        • Overview
        • Product Portfolio
        • Profitability by Market Segments (Product/Age /Sales Channel/Region)
        • Sales Footprint
        • Strategy Overview
          • Marketing Strategy
          • Product Strategy
          • Channel Strategy
      • K. TRADING
        • Overview
        • Product Portfolio
        • Profitability by Market Segments (Product/Age /Sales Channel/Region)
        • Sales Footprint
        • Strategy Overview
          • Marketing Strategy
          • Product Strategy
          • Channel Strategy
      • Biotan Pharma
        • Overview
        • Product Portfolio
        • Profitability by Market Segments (Product/Age /Sales Channel/Region)
        • Sales Footprint
        • Strategy Overview
          • Marketing Strategy
          • Product Strategy
          • Channel Strategy
      • Shri Ganesh Prasad Traders
        • Overview
        • Product Portfolio
        • Profitability by Market Segments (Product/Age /Sales Channel/Region)
        • Sales Footprint
        • Strategy Overview
          • Marketing Strategy
          • Product Strategy
          • Channel Strategy
      • Marlene Traders Co., Ltd.
        • Overview
        • Product Portfolio
        • Profitability by Market Segments (Product/Age /Sales Channel/Region)
        • Sales Footprint
        • Strategy Overview
          • Marketing Strategy
          • Product Strategy
          • Channel Strategy
      • Viet D.E.L.T.A Industrial Co. Ltd
        • Overview
        • Product Portfolio
        • Profitability by Market Segments (Product/Age /Sales Channel/Region)
        • Sales Footprint
        • Strategy Overview
          • Marketing Strategy
          • Product Strategy
          • Channel Strategy
      • SWASTIKA INTERNATIONAL
        • Overview
        • Product Portfolio
        • Profitability by Market Segments (Product/Age /Sales Channel/Region)
        • Sales Footprint
        • Strategy Overview
          • Marketing Strategy
          • Product Strategy
          • Channel Strategy
      • THE CAMPCO LTD.
        • Overview
        • Product Portfolio
        • Profitability by Market Segments (Product/Age /Sales Channel/Region)
        • Sales Footprint
        • Strategy Overview
          • Marketing Strategy
          • Product Strategy
          • Channel Strategy
      • SRI VINAYAKA BETELNUT TRADERS
        • Overview
        • Product Portfolio
        • Profitability by Market Segments (Product/Age /Sales Channel/Region)
        • Sales Footprint
        • Strategy Overview
          • Marketing Strategy
          • Product Strategy
          • Channel Strategy
  19. Assumptions & Acronyms Used
  20. Research Methodology

List of Tables

  • Table 1: Global Market Value (USD Million) Forecast by Region, 2020-2035
  • Table 2: Global Market Volume (Metric tons) Forecast by Region, 2020-2035
  • Table 3: Global Market Value (USD Million) Forecast by Processing, 2020-2035
  • Table 4: Global Market Volume (Metric tons) Forecast by Processing, 2020-2035
  • Table 5: Global Market Value (USD Million) Forecast by Varieties, 2020-2035
  • Table 6: Global Market Volume (Metric tons) Forecast by Varieties, 2020-2035
  • Table 7: North America Market Value (USD Million) Forecast by Country, 2020-2035
  • Table 8: North America Market Volume (Metric tons) Forecast by Country, 2020-2035
  • Table 9: North America Market Value (USD Million) Forecast by Processing, 2020-2035
  • Table 10: North America Market Volume (Metric tons) Forecast by Processing, 2020-2035
  • Table 11: North America Market Value (USD Million) Forecast by Varieties, 2020-2035
  • Table 12: North America Market Volume (Metric tons) Forecast by Varieties, 2020-2035
  • Table 13: Latin America Market Value (USD Million) Forecast by Country, 2020-2035
  • Table 14: Latin America Market Volume (Metric tons) Forecast by Country, 2020-2035
  • Table 15: Latin America Market Value (USD Million) Forecast by Processing, 2020-2035
  • Table 16: Latin America Market Volume (Metric tons) Forecast by Processing, 2020-2035
  • Table 17: Latin America Market Value (USD Million) Forecast by Varieties, 2020-2035
  • Table 18: Latin America Market Volume (Metric tons) Forecast by Varieties, 2020-2035
  • Table 19: Western Europe Market Value (USD Million) Forecast by Country, 2020-2035
  • Table 20: Western Europe Market Volume (Metric tons) Forecast by Country, 2020-2035
  • Table 21: Western Europe Market Value (USD Million) Forecast by Processing, 2020-2035
  • Table 22: Western Europe Market Volume (Metric tons) Forecast by Processing, 2020-2035
  • Table 23: Western Europe Market Value (USD Million) Forecast by Varieties, 2020-2035
  • Table 24: Western Europe Market Volume (Metric tons) Forecast by Varieties, 2020-2035
  • Table 25: Eastern Europe Market Value (USD Million) Forecast by Country, 2020-2035
  • Table 26: Eastern Europe Market Volume (Metric tons) Forecast by Country, 2020-2035
  • Table 27: Eastern Europe Market Value (USD Million) Forecast by Processing, 2020-2035
  • Table 28: Eastern Europe Market Volume (Metric tons) Forecast by Processing, 2020-2035
  • Table 29: Eastern Europe Market Value (USD Million) Forecast by Varieties, 2020-2035
  • Table 30: Eastern Europe Market Volume (Metric tons) Forecast by Varieties, 2020-2035
  • Table 31: East Asia Market Value (USD Million) Forecast by Country, 2020-2035
  • Table 32: East Asia Market Volume (Metric tons) Forecast by Country, 2020-2035
  • Table 33: East Asia Market Value (USD Million) Forecast by Processing, 2020-2035
  • Table 34: East Asia Market Volume (Metric tons) Forecast by Processing, 2020-2035
  • Table 35: East Asia Market Value (USD Million) Forecast by Varieties, 2020-2035
  • Table 36: East Asia Market Volume (Metric tons) Forecast by Varieties, 2020-2035
  • Table 37: South Asia & Pacific Market Value (USD Million) Forecast by Country, 2020-2035
  • Table 38: South Asia & Pacific Market Volume (Metric tons) Forecast by Country, 2020-2035
  • Table 39: South Asia & Pacific Market Value (USD Million) Forecast by Processing, 2020-2035
  • Table 40: South Asia & Pacific Market Volume (Metric tons) Forecast by Processing, 2020-2035
  • Table 41: South Asia & Pacific Market Value (USD Million) Forecast by Varieties, 2020-2035
  • Table 42: South Asia & Pacific Market Volume (Metric tons) Forecast by Varieties, 2020-2035
  • Table 43: Middle East and Africa Market Value (USD Million) Forecast by Country, 2020-2035
  • Table 44: Middle East and Africa Market Volume (Metric tons) Forecast by Country, 2020-2035
  • Table 45: Middle East and Africa Market Value (USD Million) Forecast by Processing, 2020-2035
  • Table 46: Middle East and Africa Market Volume (Metric tons) Forecast by Processing, 2020-2035
  • Table 47: Middle East and Africa Market Value (USD Million) Forecast by Varieties, 2020-2035
  • Table 48: Middle East and Africa Market Volume (Metric tons) Forecast by Varieties, 2020-2035

List of Figures

  • Figure 1: Global Market Volume (Metric tons) Forecast 2020-2035
  • Figure 2: Global Market Pricing Analysis
  • Figure 3: Global Market Value (USD Million) Forecast 2020-2035
  • Figure 4: Global Market Value Share and BPS Analysis by Processing, 2025 and 2035
  • Figure 5: Global Market Y-o-Y Growth Comparison by Processing, 2025-2035
  • Figure 6: Global Market Attractiveness Analysis by Processing
  • Figure 7: Global Market Value Share and BPS Analysis by Varieties, 2025 and 2035
  • Figure 8: Global Market Y-o-Y Growth Comparison by Varieties, 2025-2035
  • Figure 9: Global Market Attractiveness Analysis by Varieties
  • Figure 10: Global Market Value (USD Million) Share and BPS Analysis by Region, 2025 and 2035
  • Figure 11: Global Market Y-o-Y Growth Comparison by Region, 2025-2035
  • Figure 12: Global Market Attractiveness Analysis by Region
  • Figure 13: North America Market Incremental $ Opportunity, 2025-2035
  • Figure 14: Latin America Market Incremental $ Opportunity, 2025-2035
  • Figure 15: Western Europe Market Incremental $ Opportunity, 2025-2035
  • Figure 16: Eastern Europe Market Incremental $ Opportunity, 2025-2035
  • Figure 17: East Asia Market Incremental $ Opportunity, 2025-2035
  • Figure 18: South Asia & Pacific Market Incremental $ Opportunity, 2025-2035
  • Figure 19: Middle East and Africa Market Incremental $ Opportunity, 2025-2035
  • Figure 20: North America Market Value Share and BPS Analysis by Country, 2025 and 2035
  • Figure 21: North America Market Value Share and BPS Analysis by Processing, 2025 and 2035
  • Figure 22: North America Market Y-o-Y Growth Comparison by Processing, 2025-2035
  • Figure 23: North America Market Attractiveness Analysis by Processing
  • Figure 24: North America Market Value Share and BPS Analysis by Varieties, 2025 and 2035
  • Figure 25: North America Market Y-o-Y Growth Comparison by Varieties, 2025-2035
  • Figure 26: North America Market Attractiveness Analysis by Varieties
  • Figure 27: Latin America Market Value Share and BPS Analysis by Country, 2025 and 2035
  • Figure 28: Latin America Market Value Share and BPS Analysis by Processing, 2025 and 2035
  • Figure 29: Latin America Market Y-o-Y Growth Comparison by Processing, 2025-2035
  • Figure 30: Latin America Market Attractiveness Analysis by Processing
  • Figure 31: Latin America Market Value Share and BPS Analysis by Varieties, 2025 and 2035
  • Figure 32: Latin America Market Y-o-Y Growth Comparison by Varieties, 2025-2035
  • Figure 33: Latin America Market Attractiveness Analysis by Varieties
  • Figure 34: Western Europe Market Value Share and BPS Analysis by Country, 2025 and 2035
  • Figure 35: Western Europe Market Value Share and BPS Analysis by Processing, 2025 and 2035
  • Figure 36: Western Europe Market Y-o-Y Growth Comparison by Processing, 2025-2035
  • Figure 37: Western Europe Market Attractiveness Analysis by Processing
  • Figure 38: Western Europe Market Value Share and BPS Analysis by Varieties, 2025 and 2035
  • Figure 39: Western Europe Market Y-o-Y Growth Comparison by Varieties, 2025-2035
  • Figure 40: Western Europe Market Attractiveness Analysis by Varieties
  • Figure 41: Eastern Europe Market Value Share and BPS Analysis by Country, 2025 and 2035
  • Figure 42: Eastern Europe Market Value Share and BPS Analysis by Processing, 2025 and 2035
  • Figure 43: Eastern Europe Market Y-o-Y Growth Comparison by Processing, 2025-2035
  • Figure 44: Eastern Europe Market Attractiveness Analysis by Processing
  • Figure 45: Eastern Europe Market Value Share and BPS Analysis by Varieties, 2025 and 2035
  • Figure 46: Eastern Europe Market Y-o-Y Growth Comparison by Varieties, 2025-2035
  • Figure 47: Eastern Europe Market Attractiveness Analysis by Varieties
  • Figure 48: East Asia Market Value Share and BPS Analysis by Country, 2025 and 2035
  • Figure 49: East Asia Market Value Share and BPS Analysis by Processing, 2025 and 2035
  • Figure 50: East Asia Market Y-o-Y Growth Comparison by Processing, 2025-2035
  • Figure 51: East Asia Market Attractiveness Analysis by Processing
  • Figure 52: East Asia Market Value Share and BPS Analysis by Varieties, 2025 and 2035
  • Figure 53: East Asia Market Y-o-Y Growth Comparison by Varieties, 2025-2035
  • Figure 54: East Asia Market Attractiveness Analysis by Varieties
  • Figure 55: South Asia & Pacific Market Value Share and BPS Analysis by Country, 2025 and 2035
  • Figure 56: South Asia & Pacific Market Value Share and BPS Analysis by Processing, 2025 and 2035
  • Figure 57: South Asia & Pacific Market Y-o-Y Growth Comparison by Processing, 2025-2035
  • Figure 58: South Asia & Pacific Market Attractiveness Analysis by Processing
  • Figure 59: South Asia & Pacific Market Value Share and BPS Analysis by Varieties, 2025 and 2035
  • Figure 60: South Asia & Pacific Market Y-o-Y Growth Comparison by Varieties, 2025-2035
  • Figure 61: South Asia & Pacific Market Attractiveness Analysis by Varieties
  • Figure 62: Middle East and Africa Market Value Share and BPS Analysis by Country, 2025 and 2035
  • Figure 63: Middle East and Africa Market Value Share and BPS Analysis by Processing, 2025 and 2035
  • Figure 64: Middle East and Africa Market Y-o-Y Growth Comparison by Processing, 2025-2035
  • Figure 65: Middle East and Africa Market Attractiveness Analysis by Processing
  • Figure 66: Middle East and Africa Market Value Share and BPS Analysis by Varieties, 2025 and 2035
  • Figure 67: Middle East and Africa Market Y-o-Y Growth Comparison by Varieties, 2025-2035
  • Figure 68: Middle East and Africa Market Attractiveness Analysis by Varieties
  • Figure 69: Global Market - Tier Structure Analysis
  • Figure 70: Global Market - Company Share Analysis

Frequently Asked Questions

What is the estimated market size of the areca nut industry in 2025?

The industry is valued at USD 1,008 million in 2025.

What is the projected industry size of the areca nut industry by 2035?

It is forecasted to reach USD 2,075 million by 2035.

What is the expected CAGR for the areca nut industry between 2025 and 2035?

The industry is anticipated to grow at a CAGR of 7.9% during this period.

Which segment is expected to lead the areca nut market in 2025?

The Indian varieties are projected to lead the market with a 75% share in 2025.

Which region is expected to witness the highest growth in the areca nut market?

Asia Pacific, particularly India, is expected to be the key growth region with a projected growth rate of 8.8%.

Explore Similar Insights

Future Market Insights

Areca Nut Market