Nutraceutical Excipients Market
Could Rising Trend of Preventive Healthcare Throw Nutraceutical Excipients Industry on a High Growth Orbit across the USA, Italy, France, Korea, Japan, the United Kingdom, and 30+ Countries? Find this out with FMI's Bew Report
Nutraceutical Excipients Market by Product Type, End Use, Form & Region | Forecast 2023 to 2033
Nutraceutical Excipients Market Outlook (2023 to 2033)
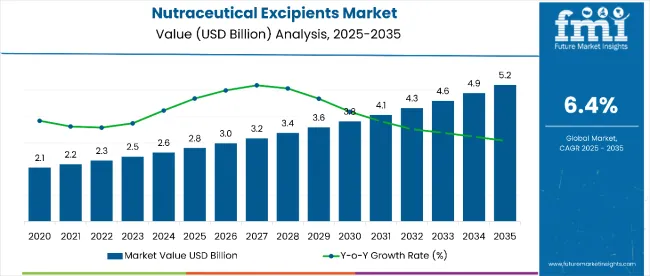
The global nutraceutical excipients market value is expected to reach US$ 2,427.8 million in 2023 and further accelerate at a CAGR of 10.4% between 2023 to 2033. Total nutraceutical excipients sales are likely to total a valuation of US$ 6,539.0 million by 2033.
Increasing production and consumption of nutraceuticals across the globe is a key factor spurring growth in the global nutraceutical excipients market.
Over the years, rising prevalence of various diseases has prompted people to increase their nutritional intake and adopt healthy lifestyles. This in turn has brought markets such as nutraceuticals market and nutraceutical excipients market into the spotlight.
People consume various nutraceutical and dietary supplements to stay healthy, enhance their immune systems, and prevent development or acquisition of diseases. Growing demand for these products will therefore continue to boost the global nutraceutical excipients market during the forecast period.
Various studies are being conducted to explore the potential benefits of nutraceutical and nutraceutical excipients. Both manufacturers and regulators are paying much more attention to research and development these days. Numerous excipient technologies are no longer merely regarded as inactive components.
Nutraceutical excipients’ capacity to improve solubility and bioavailability, which allows for specialized delivery performance, has the potential to increase efficacy. Increasing application in prebiotics and probiotics and the rising prevalence of lifestyle diseases are anticipated to fuel the demand for nutraceutical excipients.
Similarly, growing popularity of preventive healthcare, increasing geriatric population, and easy availability of products through online sales platforms will positively influence nutraceutical excipients industry during the next ten years.
Advancement in nanotechnology, escalating demand for personalized medicine, and increasing usage of multifunctional excipients will play key roles in creating growth opportunities for nutraceutical excipient manufacturers.
Various studies have revealed that personalized nutrition will become more common during the next few years. The accuracy and timing of a precision molecular measurement would be improved. Further, precise dosages of ingredients would be available. It will be simple to access individual profiles of the people.
Excipients are now recognized as being essential to product development and differentiation, especially for patent extensions and competitive advantage in the generic/biosimilars market.
Usage of novel excipients as potential solutions to the formulation of numerous exciting drug candidates that have previously been rejected due to their subpar physicochemical and/or pharmacokinetic properties will boost nutraceutical excipient sales.
Attribute |
Key Insights |
Nutraceutical Excipients Market Estimated Value (2023E) |
US$ 2,427.8 million |
Projected Market Value (2033F) |
US$ 6,539.0 million |
Value-based CAGR (2023 to 2033) |
10.4% |
Top 3 Countries Marketing Share |
20% to 25% |
Let us know your requirement to get
100% FREE customization
How Has the Market Progressed So Far in 2022?
Market Statistics |
Details |
Jan to Jun (H1), 2021 (A) |
10.6% |
Jul to Dec (H2), 2021 (A) |
10.8% |
Jan to Jun (H1), 2022 Projected (P) |
9.7% |
Jan to Jun (H1), 2022 Outlook (O) |
9.4% |
Jul to Dec (H2), 2022 Projected (P) |
9.9% |
Jul to Dec (H2), 2022 Outlook (O) |
10.1% |
Jan to Jun (H1), 2023 Projected (P) |
10.9% |
2018 to 2022 Pharmaceutical Excipients Sales Outlook Compared to Demand Forecast from 2023 to 2033
According to Future Market Insights, global sales of nutraceutical excipients increased at a healthy CAGR of 9.4% during the historical period from 2018 and 2022. For the projection period (2023 to 2033), the global nutraceutical excipients industry is set to expand at a prolific CAGR of 10.4%.
Rising application in prebiotics and probiotics and increasing incidence of various lifestyle diseases worldwide are key factors driving nutraceutical excipients demand.
In recent years, increasing cases of osteoporosis, diabetes, and several other cardiovascular diseases have resulted in high adoption of nutraceutical and dietary supplements. This in turn has created high demand for nutraceutical excipients and the trend is expected to continue during the assessment period.
Similarly, growing popularity of preventive healthcare and rising health consciousness, especially across emerging economies will positively influence nutraceutical excipient sales during the projection period.
Find your sweet spots for generating winning opportunities in this market.
Talk to AnalystAdjacent Nutraceutical Excipients Markets Overview for 2023 and 2033
Nutraceuticals Market:
Attributes |
Nutraceuticals Market |
CAGR (2023 to 2033) |
13.1% |
Market Value (2033) |
US$ 425.2 billion |
Growth Factor |
Growing demand for dietary supplements and functional foods is expected to drive the global nutraceuticals market swiftly. |
Opportunity |
Rising prevalence of lifestyle diseases along with growing health awareness will boost nutraceutical sales during the projection period |
Key Trends |
Rise of preventive healthcare and growing consumption of prebiotics and probiotics are creating lucrative growth opportunities for nutraceutical manufacturers. |
Prebiotic Ingredients Market:
Attributes |
Prebiotic Ingredients Market |
CAGR (2023 to 2033) |
10.5% |
Market Value (2033) |
US$ 19.89 billion |
Growth Factor |
Rising awareness about the importance of nutraceutical products and adoption of healthy lifestyles are providing impetus to the global prebiotic ingredients market |
Opportunity |
Increasing popularity of preventive healthcare, especially across nations such as the USA and Germany will boost prebiotic ingredient sales. |
Key Trends |
Rising usage of prebiotic ingredients in functional foods, clinical nutrition, infant formulas, and several other applications will facilitate market expansion. |
Sugar-based Excipients Market:
Attributes |
Sugar-based Excipients Market |
CAGR (2023 to 2033) |
4.8% |
Market Value (2033) |
US$ 1707.4 million |
Growth Factor |
Increasing usage of sugar-based excipients in pharmaceuticals and nutraceuticals is fostering development of the market |
Opportunity |
Rising production and consumption of generic drugs worldwide will positively influence sugar-based excipient sales. |
Key Trends |
Advancements in orally disintegrating tablets are expected to boost the global sugar-based excipients market during the projection period. |
Country Wise Insights
How is the USA Nutraceutical Excipients Market Shaping?
Rising Popularity of Preventive Healthcare to Boost Nutraceutical Excipient Sales in the USA
The USA is one of the key markets for nutraceutical excipients holding a dominant share of 27.8% of the global market. Rising demand for dietary supplements and growing popularity of preventive healthcare are a few of the factors driving nutraceutical excipient sales across the USA.
In recent years, there has been a dramatic increase in the consumption of dietary supplements such as prebiotics and probiotics across the United States of America. People are consuming these supplements to enhance their immunity and prevent development of diseases. This is powering up nutraceutical excipient sales in the country.
The United States is home to several leading nutraceutical excipients companies and the country’s government is launching various initiatives to aid these companies in developing novel products through research and development.
Focus on nutrition and dietary supplements among consumers has encouraged the USA-based nutraceutical excipient producers based to focus on innovative launches.
The increasing prevalence of lifestyle diseases such as obesity, diabetes, and others has increased the consumption of prebiotics & probiotics in the USA. This in turn is elevating nutraceutical excipients demand and the trend is likely to continue during the projection period.
Regions | North America |
Countries | United States of America |
CAGR | 7.1% |
BPS Analysis | -67 |
Market Value (2033) | US$ 2,032.2 million |
Regions | Europe |
Countries | United Kingdom |
CAGR | 7.2% |
BPS Analysis | 33 |
Market Value (2033) | US$ 255.6 million |
Regions | Asia Pacific |
Countries | China |
CAGR | 7.1% |
BPS Analysis | 312 |
Market Value (2033) | US$ 465.7 million |
Countries | India |
CAGR | 9.8% |
BPS Analysis | 95.8 |
Market Value (2033) | US$ 378.4 million |
Countries | Japan |
CAGR | 5.6% |
BPS Analysis | -325 |
Market Value (2033) | US$ 393.7 million |
How are India and China Contributing to the Expansion of Asia Pacific Nutraceutical Excipients Market?
Rising Consumption of High Nutritional Supplements Fostering Nutraceutical Excipients Sales in China and India
According to Future Market Insights, Asia Pacific nutraceutical excipients market, spearheaded by China and India, is expected to develop rapidly during the forecast period from 2023 and 2033.
Growth in the market is driven by factors such as rising disposable income, increasing middle-class population, and growing demand for nutritional and healthy products. Subsequently, rising health awareness is playing a crucial role in boosting nutraceutical excipient sales.
With rising health concerns and growing prevalence of lifestyle diseases, the intake of nutraceuticals is expected to increase across countries such as China and India. This in turn will fuel nutraceutical excipient sales during the projection period.
Further, growing urbanization and high demand for low-cost nutraceutical excipients will continue to create growth opportunities for nutraceutical excipient manufacturers across China and India.
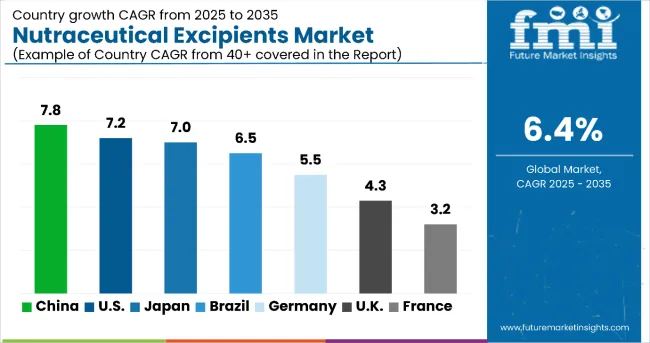
FMI estimates the overall market for nutraceutical excipients in India to accelerate at 9.8% CAGR between 2023 and 2033, reaching a valuation of US$ 378.4 million by 2023.
China’s nutraceutical excipients industry on the other hand is set to expand at 7.1% CAGR during the projection period, totaling a valuation of US$ 465.7 million by the end of 2033.

A unified Market Research Subscription Platform, built for today's disparate research needs.
Category-wise Insights
Which Type for Nutraceutical Excipients will be the Most Preferred?
Demand to Remain High for Binders, Diluents, and Fillers
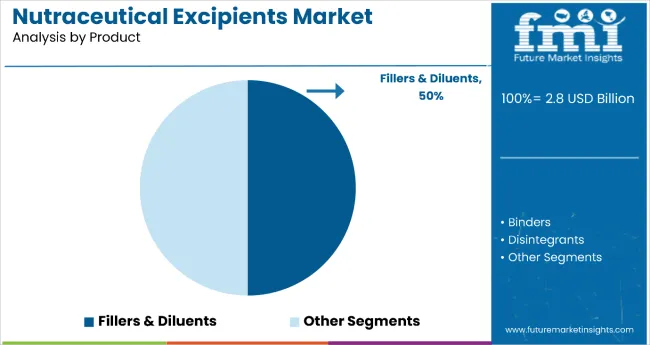
According to Future Market Insights, binder and diluents & fillers segments collectively hold a prominent share of the global nutraceutical excipients industry and they are likely to retain their dominance during the assessment period. This is due to rising adoption of these products in various end use applications.
Binders are capable of holding together the tablet ingredients. They are being increasingly used by dietary supplement manufacturers as these excipients act as adhesives to bind together granules, powders, and other dry ingredients to impart required mechanical strength.
Dilutes and fillers are used to increase the weight, volume, or dosage form in nutraceutical products. Based on compatibility, solubility, and lubricity, there is a huge variety of diluents and fillers.
Another factor contributing to growth is lactose's capping (low moisture content), which has advantages over other diluents in terms of weight granulation and friability. For instance, tribasic calcium phosphate is frequently used as a filler in the nutraceutical excipients industry when making vitamins and minerals.
Which is the Leading End Use Industry for Nutraceutical Excipients?
Prebiotics and Probiotics Likely to Generate Maximum Revenue for Nutraceutical Excipients Companies
Based on end use, the global market for nutraceutical excipients is segmented into protein and amino acids, prebiotics and probiotics, vitamins, and others.
The global market is currently dominated by protein and amino acids segment which holds around 26.70% revenue share. Rising demand for protein supplements due to growing health concerns and proliferation of fitness centers, health clubs, and gymnasiums around the world is driving growth of this segment.
However, the prebiotics and probiotics segment is expected to accelerate at a significant pace during the projection period, generating lucrative growth prospects for market expansion.
The incessantly increasing prevalence of lifestyle diseases across the globe has fuelled demand for dietary supplements, including prebiotics & probiotics. Hence, the rapid adoption of the pre and probiotics concept is aimed at catering to the increasing nutritional needs among consumers.
Consumers are weighing their dietary choices to mitigate the negative health impacts of a sedentary lifestyle. With dietary supplements and extensive consumption of prebiotics & probiotics becoming a need of the hour, the target segment is anticipated to exhibit high growth over the projection period.
Which is the Commonly Used Form of Nutraceutical Excipients?
End Users Prefer Dry Form of Nutraceutical Excipients
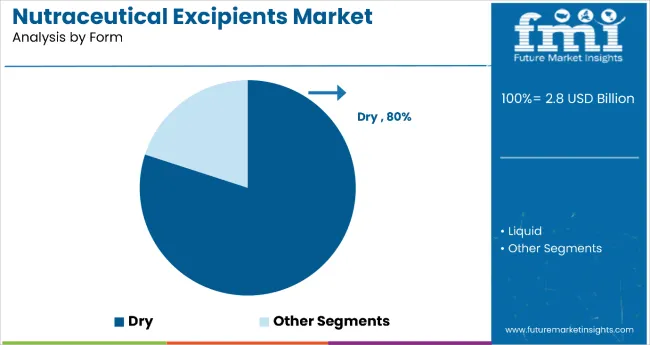
Based on form, the nutraceutical excipients segment is bifurcated into dry nutraceutical excipients and liquid nutraceutical excipients. Among these, the dry form is the most preferred form among manufacturers.
As per the FMI’s report, dry nutraceutical excipients segment account for over 3/5th of the global market share owing to the high demand for nutritional or dietary supplements in the solid state. Subsequently, cost-effective and convenient features of dry nutraceutical excipients are encouraging their adoption.
Also, manufacturing companies are resorting to new techniques and introducing new dietary supplements and nutraceutical excipients in dry form. Increasing demand from diverse end-users for use as dry beverage mixes with additional nutrients will boost the sales of dry nutraceutical excipients over the projection period.
Competitive Landscape
Key nutraceutical excipient manufacturing companies are utilized a variety of strategies including new product launches, research and development activities, partnerships, collaborations, acquisitions, and mergers to improve solidify their position in the market as well as to increase their revenues.
Recent Developments:
- In 2021, two new excipients for nutraceutical tablets were launched by Omya International AG.
- In May 2022, ‘Closer to the Formulation’, a new Center of Excellence, was launched by DFE Pharma, a global leader in pharma and nutraceutical excipient solutions in Hyderabad India.
- In September 2022, Crest Cellulose, an Indian-based excipient manufacturer was acquired by Roquette.
Scope of the Report
Attribute |
Details |
Estimated Market Size (2023) |
US$ 2,427.8 million |
Projected Market Size (20233) |
US$ 6,539.0 million |
Anticipated Growth Rate (2023 to 2033) |
10.4% CAGR |
Forecast Period |
2023 to 2033 |
Historical Data Available for |
2018 to 2022 |
Market Analysis |
US$ Million for Value and MT for Volume |
Key Regions Covered |
North America, Latin America, Europe, East Asia, South Asia, and the Middle East & Africa |
Key Countries Covered |
United States of America, Canada, Brazil, Mexico, Germany, United Kingdom, France, Italy, Spain, Nordic, Russia, Poland, China, India, Thailand, Indonesia, Australia and New Zealand, Japan, GCC Countries, North Africa, South Africa, and others. |
Key Segments Covered |
Product Type, End Use, Form, and Region |
Key Companies Profiled |
|
Report Coverage |
Market Forecast, Company Share Analysis, Competition Intelligence, Drivers Restraints Opportunity Trends Analysis, Market Dynamics and Challenges, and Strategic Growth Initiatives |
Global Nutraceutical Excipients Industry by Category
By Product Type:
- Fillers & Diluents
- Binders
- Disintegrants
- Coating agent
- Flavoring Agents
- Lubricants
By End Use:
- Protein and Amino Acids
- Prebiotics and Probiotics
- Vitamins
- Others
By Form:
- Dry
- Liquid
By Region:
- North America
- Latin America
- Europe
- East Asia
- South Asia
- Oceania
- Middle East & Africa
Frequently Asked Questions
The global nutraceutical excipients market value is estimated to reach US$ 2.4 billion in 2023.
Nutraceutical excipients demand is expected to increase at 10.4% CAGR between 2023 and 2033.
By 2033, the global nutraceutical excipients industry is projected to reach a valuation of US$ 6,539.0 million.
Growing use of protein and amino acids combined with the demand for high-quality nutraceuticals in developing countries will fuel market expansion.
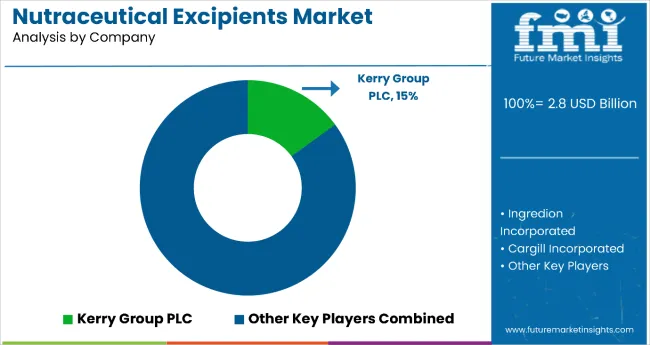
Leading players operating in the global nutraceutical excipients industry are Ingredion Incorporated, Cargill Incorporated, Dow Du Pont Inc., Kerry Group PLC, Roquette Frères SA, and Ashland Global Holdings Inc.
Nutraceutical excipients demand in China will exhibit a CAGR of 7.1% between 2023 and 2033.
Leading players in the global market for nutraceutical excipients are estimated to account for around 20% to 25% of the total market share.
The Europe nutraceutical excipients market is anticipated to expand at 6.8% CAGR over the forecast period.
By form, the dry segment dominates the market while by product type, the fillers & diluents segment is most preferred by end-use companies.
Table of Content
1. Executive Summary | Nutraceutical Excipients Market
1.1. Global Market Outlook
1.2. Demand-side Trends
1.3. Supply-side Trends
1.4. Technology Roadmap Analysis
1.5. Analysis and Recommendations
2. Market Overview
2.1. Market Coverage/Taxonomy
2.2. Market Definition/Scope/Limitations
3. Market Background
3.1. Market Dynamics
3.1.1. Drivers
3.1.2. Restraints
3.1.3. Opportunity
3.1.4. Trends
3.2. Scenario Forecast
3.2.1. Demand in Optimistic Scenario
3.2.2. Demand in Likely Scenario
3.2.3. Demand in Conservative Scenario
3.3. Product launches & Recent Developments
3.4. Product Life Cycle Analysis
3.5. Value Chain Analysis
3.5.1. Supply Side Participants and their Roles
3.5.1.1. Producers
3.5.1.2. Mid-Level Participants (Traders/ Agents/ Brokers)
3.5.1.3. Wholesalers and Distributors
3.5.2. % of Operating Margin Analysis
3.5.3. List of Raw Material Suppliers
3.5.4. List of Existing and Potential Buyer’s
3.6. Global Market - Pricing Analysis
3.6.1. Price Point Assessment by Region
3.6.2. Price Point Assessment by Product Type
3.6.3. Price Forecast till 2033
3.6.4. Factors affecting pricing
3.7. Forecast Factors - Relevance & Impact
3.8. Demand Assessment By Source
3.9. Regulatory Landscape
3.9.1. Packaging & Labelling Regulations
3.9.2. Certifications and Certifying Agency Overview
3.9.3. Import/Export Policies
3.10. Regional Parent Market Outlook
3.11. Production and Consumption Statistics
3.12. Import and Export Statistics
3.13. Consumers Survey Analysis
3.14. Macro-Economic Factors
3.15. Product Claims & Nutritional Information Scan by Buyers
4. Global Analysis 2018 to 2022 and Forecast, 2023 to 2033
4.1. Historical Market Size Value (US$ Million) & Volume (MT) Analysis, 2018 to 2022
4.2. Current and Future Market Size Value (US$ Million) & Volume (MT) Projections, 2023 to 2033
4.2.1. Y-o-Y Growth Trend Analysis
4.2.2. Absolute $ Opportunity Analysis
5. Global Analysis 2018 to 2022 and Forecast 2023 to 2033, By Product Type
5.1. Introduction / Key Findings
5.2. Historical Market Size Value (US$ Million) & Volume (MT) Analysis By Product Type, 2018 to 2022
5.3. Current and Future Market Size Value (US$ Million) & Volume (MT) Analysis and Forecast By Product Type, 2023 to 2033
5.3.1. Fillers and Diluents
5.3.2. Binder
5.3.3. Disintegrants
5.3.4. Coating agent
5.3.5. Flavouring agent
5.3.6. Lubricants
5.4. Y-o-Y Growth Trend Analysis by Product Type, 2018 to 2022
5.5. Absolute $ Opportunity Analysis by Product Type, 2023 to 2033
6. Global Analysis 2018 to 2022 and Forecast 2023 to 2033, By End Use
6.1. Introduction / Key Findings
6.2. Historical Market Size Value (US$ Million) & Volume (MT) Analysis by End Use, 2018 to 2022
6.3. Current and Future Market Size Value (US$ Million) & Volume (MT) Analysis and Forecast By End Use, 2023 to 2033
6.3.1. Protein and Amino Acids
6.3.2. Prebiotics and Probiotics
6.3.3. Vitamins
6.3.4. Others
6.4. Y-o-Y Growth Trend Analysis By End Use, 2018 to 2022
6.5. Absolute $ Opportunity Analysis By End Use, 2023 to 2033
7. Global Analysis 2018 to 2022 and Forecast 2023 to 2033, By Region
7.1. Introduction
7.2. Historical Market Size Value (US$ Million) & Volume (MT) Analysis By Region, 2018 to 2022
7.3. Current Market Size Value (US$ Million) & Volume (MT) Analysis and Forecast By Region, 2023 to 2033
7.3.1. North America
7.3.2. Latin America
7.3.3. Europe
7.3.4. East Asia
7.3.5. South Asia
7.3.6. Oceania
7.3.7. MEA
7.4. Market Attractiveness Analysis By Region
8. North America Analysis 2018 to 2022 and Forecast 2023 to 2033, By Country
8.1. Historical Market Size Value (US$ Million) & Volume (MT) Trend Analysis By Market Taxonomy, 2018 to 2022
8.2. Market Size Value (US$ Million) & Volume (MT) Forecast By Market Taxonomy, 2023 to 2033
8.2.1. By Country
8.2.1.1. USA
8.2.1.2. Canada
8.2.2. By Product Type
8.2.3. By End Use
8.3. Market Attractiveness Analysis
8.3.1. By Country
8.3.2. By Product Type
8.3.3. By End Use
8.4. Key Takeaways
9. Latin America Analysis 2018 to 2022 and Forecast 2023 to 2033, By Country
9.1. Historical Market Size Value (US$ Million) & Volume (MT) Trend Analysis By Market Taxonomy, 2018 to 2022
9.2. Market Size Value (US$ Million) & Volume (MT) Forecast By Market Taxonomy, 2023 to 2033
9.2.1. By Country
9.2.1.1. Brazil
9.2.1.2. Mexico
9.2.1.3. Argentina
9.2.1.4. Rest of Latin America
9.2.2. By Product Type
9.2.3. By End Use
9.3. Market Attractiveness Analysis
9.3.1. By Country
9.3.2. By Product Type
9.3.3. By End Use
9.4. Key Takeaways
10. Europe Analysis 2018 to 2022 and Forecast 2023 to 2033, By Country
10.1. Historical Market Size Value (US$ Million) & Volume (MT) Trend Analysis By Market Taxonomy, 2018 to 2022
10.2. Market Size Value (US$ Million) & Volume (MT) Forecast By Market Taxonomy, 2023 to 2033
10.2.1. By Country
10.2.1.1. Germany
10.2.1.2. United Kingdom
10.2.1.3. France
10.2.1.4. Italy
10.2.1.5. Spain
10.2.1.6. BENELUX
10.2.1.7. Nordic
10.2.1.8. Russia
10.2.1.9. Poland
10.2.1.10. Rest of Europe
10.2.2. By Product Type
10.2.3. By End Use
10.3. Market Attractiveness Analysis
10.3.1. By Country
10.3.2. By Product Type
10.3.3. By End Use
10.4. Key Takeaways
11. East Asia Analysis 2018 to 2022 and Forecast 2023 to 2033, By Country
11.1. Historical Market Size Value (US$ Million) & Volume (MT) Trend Analysis By Market Taxonomy, 2018 to 2022
11.2. Market Size Value (US$ Million) & Volume (MT) Forecast By Market Taxonomy, 2023 to 2033
11.2.1. By Country
11.2.1.1. China
11.2.1.2. Japan
11.2.1.3. South Korea
11.2.2. By Product Type
11.2.3. By End Use
11.3. Market Attractiveness Analysis
11.3.1. By Country
11.3.2. By Product Type
11.3.3. By End Use
11.4. Key Takeaways
12. South Asia Analysis 2018 to 2022 and Forecast 2023 to 2033, By Country
12.1. Historical Market Size Value (US$ Million) & Volume (MT) Trend Analysis By Market Taxonomy, 2018 to 2022
12.2. Market Size Value (US$ Million) & Volume (MT) Forecast By Market Taxonomy, 2023 to 2033
12.2.1. By Country
12.2.1.1. India
12.2.1.2. Thailand
12.2.1.3. Malaysia
12.2.1.4. Indonesia
12.2.1.5. Philippines
12.2.1.6. Singapore
12.2.1.7. Rest of South Asia
12.2.2. By Product Type
12.2.3. By End Use
12.3. Market Attractiveness Analysis
12.3.1. By Country
12.3.2. By Product Type
12.3.3. By End Use
12.4. Key Takeaways
13. Oceania Analysis 2018 to 2022 and Forecast 2023 to 2033, By Country
13.1. Historical Market Size Value (US$ Million) & Volume (MT) Trend Analysis By Market Taxonomy, 2018 to 2022
13.2. Market Size Value (US$ Million) & Volume (MT) Forecast By Market Taxonomy, 2023 to 2033
13.2.1. By Country
13.2.1.1. Australia
13.2.1.2. New Zealand
13.2.2. By Product Type
13.2.3. By End Use
13.3. Market Attractiveness Analysis
13.3.1. By Country
13.3.2. By Product Type
13.3.3. By End Use
13.4. Key Takeaways
14. Middle East & Africa Analysis 2018 to 2022 and Forecast 2023 to 2033, By Country
14.1. Historical Market Size Value (US$ Million) & Volume (MT) Trend Analysis By Market Taxonomy, 2018 to 2022
14.2. Market Size Value (US$ Million) & Volume (MT) Forecast By Market Taxonomy, 2023 to 2033
14.2.1. By Country
14.2.1.1. GCC Countries
14.2.1.2. South Africa
14.2.1.3. Rest of Middle East & Africa
14.2.2. By Product Type
14.2.3. By End Use
14.3. Market Attractiveness Analysis
14.3.1. By Country
14.3.2. By Product Type
14.3.3. By End Use
14.4. Key Takeaways
15. Key Countries Analysis
15.1. USA
15.1.1. Pricing Analysis
15.1.2. Market Share Analysis, 2023
15.1.2.1. By Product Type
15.1.2.2. By End Use
15.2. Canada
15.2.1. Pricing Analysis
15.2.2. Market Share Analysis, 2023
15.2.2.1. By Product Type
15.2.2.2. By End Use
15.3. Brazil
15.3.1. Pricing Analysis
15.3.2. Market Share Analysis, 2023
15.3.2.1. By Product Type
15.3.2.2. By End Use
15.4. Mexico
15.4.1. Pricing Analysis
15.4.2. Market Share Analysis, 2023
15.4.2.1. By Product Type
15.4.2.2. By End Use
15.5. Argentina
15.5.1. Pricing Analysis
15.5.2. Market Share Analysis, 2023
15.5.2.1. By Product Type
15.5.2.2. By End Use
15.6. Chile
15.6.1. Pricing Analysis
15.6.2. Market Share Analysis, 2023
15.6.2.1. By Product Type
15.6.2.2. By End Use
15.7. Peru
15.7.1. Pricing Analysis
15.7.2. Market Share Analysis, 2023
15.7.2.1. By Product Type
15.7.2.2. By End Use
15.8. Germany
15.8.1. Pricing Analysis
15.8.2. Market Share Analysis, 2023
15.8.2.1. By Product Type
15.8.2.2. By End Use
15.9. Italy
15.9.1. Pricing Analysis
15.9.2. Market Share Analysis, 2023
15.9.2.1. By Product Type
15.9.2.2. By End Use
15.10. France
15.10.1. Pricing Analysis
15.10.2. Market Share Analysis, 2023
15.10.2.1. By Product Type
15.10.2.2. By End Use
15.11. Spain
15.11.1. Pricing Analysis
15.11.2. Market Share Analysis, 2023
15.11.2.1. By Product Type
15.11.2.2. By End Use
15.12. United Kingdom
15.12.1. Pricing Analysis
15.12.2. Market Share Analysis, 2023
15.12.2.1. By Product Type
15.12.2.2. By End Use
15.13. Russia
15.13.1. Pricing Analysis
15.13.2. Market Share Analysis, 2023
15.13.2.1. By Product Type
15.13.2.2. By End Use
15.14. Poland
15.14.1. Pricing Analysis
15.14.2. Market Share Analysis, 2023
15.14.2.1. By Product Type
15.14.2.2. By End Use
15.15. BENELUX
15.15.1. Pricing Analysis
15.15.2. Market Share Analysis, 2023
15.15.2.1. By Product Type
15.15.2.2. By End Use
15.16. Nordic Countries
15.16.1. Pricing Analysis
15.16.2. Market Share Analysis, 2023
15.16.2.1. By Product Type
15.16.2.2. By End Use
15.17. China
15.17.1. Pricing Analysis
15.17.2. Market Share Analysis, 2023
15.17.2.1. By Product Type
15.17.2.2. By End Use
15.18. Japan
15.18.1. Pricing Analysis
15.18.2. Market Share Analysis, 2023
15.18.2.1. By Product Type
15.18.2.2. By End Use
15.19. South Korea
15.19.1. Pricing Analysis
15.19.2. Market Share Analysis, 2023
15.19.2.1. By Product Type
15.19.2.2. By End Use
15.20. India
15.20.1. Pricing Analysis
15.20.2. Market Share Analysis, 2023
15.20.2.1. By Product Type
15.20.2.2. By End Use
15.21. Thailand
15.21.1. Pricing Analysis
15.21.2. Market Share Analysis, 2023
15.21.2.1. By Product Type
15.21.2.2. By End Use
15.22. Indonesia
15.22.1. Pricing Analysis
15.22.2. Market Share Analysis, 2023
15.22.2.1. By Product Type
15.22.2.2. By End Use
15.23. Malaysia
15.23.1. Pricing Analysis
15.23.2. Market Share Analysis, 2023
15.23.2.1. By Product Type
15.23.2.2. By End Use
15.24. Singapore
15.24.1. Pricing Analysis
15.24.2. Market Share Analysis, 2023
15.24.2.1. By Product Type
15.24.2.2. By End Use
15.25. Australia
15.25.1. Pricing Analysis
15.25.2. Market Share Analysis, 2023
15.25.2.1. By Product Type
15.25.2.2. By End Use
15.26. New Zealand
15.26.1. Pricing Analysis
15.26.2. Market Share Analysis, 2023
15.26.2.1. By Product Type
15.26.2.2. By End Use
15.27. GCC Countries
15.27.1. Pricing Analysis
15.27.2. Market Share Analysis, 2023
15.27.2.1. By Product Type
15.27.2.2. By End Use
15.28. South Africa
15.28.1. Pricing Analysis
15.28.2. Market Share Analysis, 2023
15.28.2.1. By Product Type
15.28.2.2. By End Use
15.29. North Africa
15.29.1. Pricing Analysis
15.29.2. Market Share Analysis, 2023
15.29.2.1. By Product Type
15.29.2.2. By End Use
15.30. Central Africa
15.30.1. Pricing Analysis
15.30.2. Market Share Analysis, 2023
15.30.2.1. By Product Type
15.30.2.2. By End Use
16. Market Structure Analysis
16.1. Competition Dashboard
16.2. Competition Benchmarking
16.3. Market Share Analysis of Top Players
16.3.1. By Regional
16.3.2. By Product Type
16.3.3. By End Use
17. Competition Analysis
17.1. Competition Deep Dive
17.1.1. Ingredion Incorporated
17.1.1.1. Overview
17.1.1.2. Product Portfolio
17.1.1.3. Profitability by Market Segments (Product Type/End Use/Form/Region)
17.1.1.4. Sales Footprint
17.1.1.5. Strategy Overview
17.1.1.5.1. Marketing Strategy
17.1.1.5.2. Product Strategy
17.1.1.5.3. Channel Strategy
17.1.2. Cargill Incorporated
17.1.2.1. Overview
17.1.2.2. Product Portfolio
17.1.2.3. Profitability by Market Segments (Product Type/End Use/Form/Region)
17.1.2.4. Sales Footprint
17.1.2.5. Strategy Overview
17.1.2.5.1. Marketing Strategy
17.1.2.5.2. Product Strategy
17.1.2.5.3. Channel Strategy
17.1.3. Dow Du Pont Inc.
17.1.3.1. Overview
17.1.3.2. Product Portfolio
17.1.3.3. Profitability by Market Segments (Product Type/End Use/Form/Region)
17.1.3.4. Sales Footprint
17.1.3.5. Strategy Overview
17.1.3.5.1. Marketing Strategy
17.1.3.5.2. Product Strategy
17.1.3.5.3. Channel Strategy
17.1.4. Kerry Group PLC
17.1.4.1. Overview
17.1.4.2. Product Portfolio
17.1.4.3. Profitability by Market Segments (Product Type/End Use/Form/Region)
17.1.4.4. Sales Footprint
17.1.4.5. Strategy Overview
17.1.4.5.1. Marketing Strategy
17.1.4.5.2. Product Strategy
17.1.4.5.3. Channel Strategy
17.1.5. Roquette Frères SA
17.1.5.1. Overview
17.1.5.2. Product Portfolio
17.1.5.3. Profitability by Market Segments (Product Type/End Use/Form/Region)
17.1.5.4. Sales Footprint
17.1.5.5. Strategy Overview
17.1.5.5.1. Marketing Strategy
17.1.5.5.2. Product Strategy
17.1.5.5.3. Channel Strategy
17.1.6. Ashland Global Holdings Inc.
17.1.6.1. Overview
17.1.6.2. Product Portfolio
17.1.6.3. Profitability by Market Segments (Product Type/End Use/Form/Region)
17.1.6.4. Sales Footprint
17.1.6.5. Strategy Overview
17.1.6.5.1. Marketing Strategy
17.1.6.5.2. Product Strategy
17.1.6.5.3. Channel Strategy
17.1.7. BASF SE
17.1.7.1. Overview
17.1.7.2. Product Portfolio
17.1.7.3. Profitability by Market Segments (Product Type/End Use/Form/Region)
17.1.7.4. Sales Footprint
17.1.7.5. Strategy Overview
17.1.7.5.1. Marketing Strategy
17.1.7.5.2. Product Strategy
17.1.7.5.3. Channel Strategy
17.1.8. SPI Pharma Inc.
17.1.8.1. Overview
17.1.8.2. Product Portfolio
17.1.8.3. Profitability by Market Segments (Product Type/End Use/Form/Region)
17.1.8.4. Sales Footprint
17.1.8.5. Strategy Overview
17.1.8.5.1. Marketing Strategy
17.1.8.5.2. Product Strategy
17.1.8.5.3. Channel Strategy
17.1.9. JRS Pharma LP
17.1.9.1. Overview
17.1.9.2. Product Portfolio
17.1.9.3. Profitability by Market Segments (Product Type/End Use/Form/Region)
17.1.9.4. Sales Footprint
17.1.9.5. Strategy Overview
17.1.9.5.1. Marketing Strategy
17.1.9.5.2. Product Strategy
17.1.9.5.3. Channel Strategy
17.1.10. Hilmar Ingredients Inc.
17.1.10.1. Overview
17.1.10.2. Product Portfolio
17.1.10.3. Profitability by Market Segments (Product Type/End Use/Form/Region)
17.1.10.4. Sales Footprint
17.1.10.5. Strategy Overview
17.1.10.5.1. Marketing Strategy
17.1.10.5.2. Product Strategy
17.1.10.5.3. Channel Strategy
17.1.11. Galenova Inc.
17.1.11.1. Overview
17.1.11.2. Product Portfolio
17.1.11.3. Profitability by Market Segments (Product Type/End Use/Form/Region)
17.1.11.4. Sales Footprint
17.1.11.5. Strategy Overview
17.1.11.5.1. Marketing Strategy
17.1.11.5.2. Product Strategy
17.1.11.5.3. Channel Strategy
17.1.12. Hong Jun Bio-based Composite Technology Co., Ltd
17.1.12.1. Overview
17.1.12.2. Product Portfolio
17.1.12.3. Profitability by Market Segments (Product Type/End Use/Form/Region)
17.1.12.4. Sales Footprint
17.1.12.5. Strategy Overview
17.1.12.5.1. Marketing Strategy
17.1.12.5.2. Product Strategy
17.1.12.5.3. Channel Strategy
17.1.13. Danimer Scientific
17.1.13.1. Overview
17.1.13.2. Product Portfolio
17.1.13.3. Profitability by Market Segments (Product Type/End Use/Form/Region)
17.1.13.4. Sales Footprint
17.1.13.5. Strategy Overview
17.1.13.5.1. Marketing Strategy
17.1.13.5.2. Product Strategy
17.1.13.5.3. Channel Strategy
17.1.14. Futerro
17.1.14.1. Overview
17.1.14.2. Product Portfolio
17.1.14.3. Profitability by Market Segments (Product Type/End Use/Form/Region)
17.1.14.4. Sales Footprint
17.1.14.5. Strategy Overview
17.1.14.5.1. Marketing Strategy
17.1.14.5.2. Product Strategy
17.1.14.5.3. Channel Strategy
17.1.15. Other Players (On Additional Requests)
17.1.15.1. Overview
17.1.15.2. Product Portfolio
17.1.15.3. Profitability by Market Segments (Product Type/End Use/Form/Region)
17.1.15.4. Sales Footprint
17.1.15.5. Strategy Overview
17.1.15.5.1. Marketing Strategy
17.1.15.5.2. Product Strategy
17.1.15.5.3. Channel Strategy
18. Assumptions & Acronyms Used
19. Research Methodology
Let us know your requirement to get
100% FREE customization
List of Tables
Table: 1. Global Market Value (US$ Million) Forecast by Region, 2018 to 2033
Table: 2. Global Market Volume (MT) Forecast by Region, 2018 to 2033
Table: 3. Global Market Value (US$ Million) Forecast by Product Type, 2018 to 2033
Table: 4. Global Market Volume (MT) Forecast by Product Type, 2018 to 2033
Table: 5. Global Market Value (US$ Million) Forecast by End Use, 2018 to 2033
Table: 6. Global Market Volume (MT) Forecast by End Use, 2018 to 2033
Table: 7. North America Market Value (US$ Million) Forecast by Country, 2018 to 2033
Table: 8. North America Market Volume (MT) Forecast by Country, 2018 to 2033
Table: 9. North America Market Value (US$ Million) Forecast by Product Type, 2018 2033
Table: 10. North America Market Volume (MT) Forecast by Product Type, 2018 to 2033
Table: 11. North America Market Value (US$ Million) Forecast by End Use, 2018 to 2033
Table: 12. North America Market Volume (MT) Forecast by End Use, 2018 to 2033
Table: 13. Latin America Market Value (US$ Million) Forecast by Country, 2018 to 2033
Table: 14. Latin America Market Volume (MT) Forecast by Country, 2018 to 2033
Table: 15. Latin America Market Value (US$ Million) Forecast by Product Type, 2018 2033
Table: 16. Latin America Market Volume (MT) Forecast by Product Type, 2018 to 2033
Table: 17. Latin America Market Value (US$ Million) Forecast by End Use, 2018 to 2033
Table: 18. Latin America Market Volume (MT) Forecast by End Use, 2018 to 2033
Table: 19. Europe Market Value (US$ Million) Forecast by Country, 2018 to 2033
Table: 20. Europe Market Volume (MT) Forecast by Country, 2018 to 2033
Table: 21. Europe Market Value (US$ Million) Forecast by Product Type, 2018 to 2033
Table: 22. Europe Market Volume (MT) Forecast by Product Type, 2018 to 2033
Table: 23. Europe Market Value (US$ Million) Forecast by End Use, 2018 to 2033
Table: 24. Europe Market Volume (MT) Forecast by End Use, 2018 to 2033
Table: 25. East Asia Market Value (US$ Million) Forecast by Country, 2018 to 2033
Table: 26. East Asia Market Volume (MT) Forecast by Country, 2018 to 2033
Table: 27. East Asia Market Value (US$ Million) Forecast by Product Type, 2018 to 2033
Table: 28. East Asia Market Volume (MT) Forecast by Product Type, 2018 to 2033
Table: 29. East Asia Market Value (US$ Million) Forecast by End Use, 2018 to 2033
Table: 30. East Asia Market Volume (MT) Forecast by End Use, 2018 to 2033
Table: 31. South Asia Market Value (US$ Million) Forecast by Country, 2018 to 2033
Table: 32. South Asia Market Volume (MT) Forecast by Country, 2018 to 2033
Table: 33. South Asia Market Value (US$ Million) Forecast by Product Type, 2018 to 2033
Table: 34. South Asia Market Volume (MT) Forecast by Product Type, 2018 to 2033
Table: 35. South Asia Market Value (US$ Million) Forecast by End Use, 2018 to 2033
Table: 36. South Asia Market Volume (MT) Forecast by End Use, 2018 to 2033
Table: 37. Oceania Market Value (US$ Million) Forecast by Country, 2018 to 2033
Table: 38. Oceania Market Volume (MT) Forecast by Country, 2018 to 2033
Table: 39. Oceania Market Value (US$ Million) Forecast by Product Type, 2018 to 2033
Table: 40. Oceania Market Volume (MT) Forecast by Product Type, 2018 to 2033
Table: 41. Oceania Market Value (US$ Million) Forecast by End Use, 2018 to 2033
Table: 42. Oceania Market Volume (MT) Forecast by End Use, 2018 to 2033
Table: 43. Middle East & Africa Market Value (US$ Million) Forecast by Country, 2018 to 2033
Table: 44. Middle East & Africa Market Volume (MT) Forecast by Country, 2018 to 2033
Table: 45. Middle East & Africa Market Value (US$ Million) Forecast by Product Type, 2018 to 2033
Table: 46. Middle East & Africa Market Volume (MT) Forecast by Product Type, 2018 to 2033
Table: 47. Middle East & Africa Market Value (US$ Million) Forecast by End Use, 2018 to 2033
Table: 48. Middle East & Africa Market Volume (MT) Forecast by End Use, 2018 to 2033
Find your sweet spots for generating winning opportunities in this market.
Talk to AnalystList of Charts
Figure 1: Global Market Value (US$ Million) by Product Type, 2023 to 2033
Figure 2: Global Market Value (US$ Million) by End Use, 2023 to 2033
Figure 3: Global Market Value (US$ Million) by Region, 2023 to 2033
Figure 4: Global Market Value (US$ Million) Analysis by Region, 2018 to 2033
Figure 5: Global Market Volume (MT) Analysis by Region, 2018 to 2033
Figure 6: Global Market Value Share (%) and BPS Analysis by Region, 2023 to 2033
Figure 7: Global Market Y-o-Y Growth (%) Projections by Region, 2023 to 2033
Figure 8: Global Market Value (US$ Million) Analysis by Product Type, 2018 to 2033
Figure 9: Global Market Volume (MT) Analysis by Product Type, 2018 to 2033
Figure 10: Global Market Value Share (%) and BPS Analysis by Product Type, 2023 to 2033
Figure 11: Global Market Y-o-Y Growth (%) Projections by Product Type, 2023 to 2033
Figure 12: Global Market Value (US$ Million) Analysis by End Use, 2018 to 2033
Figure 13: Global Market Volume (MT) Analysis by End Use, 2018 to 2033
Figure 14: Global Market Value Share (%) and BPS Analysis by End Use, 2023 to 2033
Figure 15: Global Market Y-o-Y Growth (%) Projections by End Use, 2023 to 2033
Figure 16: Global Market Attractiveness by Product Type, 2023 to 2033
Figure 17: Global Market Attractiveness by End Use, 2023 to 2033
Figure 18: Global Market Attractiveness by Region, 2023 to 2033
Figure 19: North America Market Value (US$ Million) by Product Type, 2023 to 2033
Figure 20: North America Market Value (US$ Million) by End Use, 2023 to 2033
Figure 21: North America Market Value (US$ Million) by Country, 2023 to 2033
Figure 22: North America Market Value (US$ Million) Analysis by Country, 2018 to 2033
Figure 23: North America Market Volume (MT) Analysis by Country, 2018 to 2033
Figure 24: North America Market Value Share (%) and BPS Analysis by Country, 2023 to 2033
Figure 25: North America Market Y-o-Y Growth (%) Projections by Country, 2023 to 2033
Figure 26: North America Market Value (US$ Million) Analysis by Product Type, 2018 to 2033
Figure 27: North America Market Volume (MT) Analysis by Product Type, 2018 to 2033
Figure 28: North America Market Value Share (%) and BPS Analysis by Product Type, 2023 to 2033
Figure 29: North America Market Y-o-Y Growth (%) Projections by Product Type, 2023 to 2033
Figure 30: North America Market Value (US$ Million) Analysis by End Use, 2018 to 2033
Figure 31: North America Market Volume (MT) Analysis by End Use, 2018 to 2033
Figure 32: North America Market Value Share (%) and BPS Analysis by End Use, 2023 to 2033
Figure 33: North America Market Y-o-Y Growth (%) Projections by End Use, 2023 to 2033
Figure 34: North America Market Attractiveness by Product Type, 2023 to 2033
Figure 35: North America Market Attractiveness by End Use, 2023 to 2033
Figure 36: North America Market Attractiveness by Country, 2023 to 2033
Figure 37: Latin America Market Value (US$ Million) by Product Type, 2023 to 2033
Figure 38: Latin America Market Value (US$ Million) by End Use, 2023 to 2033
Figure 39: Latin America Market Value (US$ Million) by Country, 2023 to 2033
Figure 40: Latin America Market Value (US$ Million) Analysis by Country, 2018 to 2033
Figure 41: Latin America Market Volume (MT) Analysis by Country, 2018 to 2033
Figure 42: Latin America Market Value Share (%) and BPS Analysis by Country, 2023 to 2033
Figure 43: Latin America Market Y-o-Y Growth (%) Projections by Country, 2023 to 2033
Figure 44: Latin America Market Value (US$ Million) Analysis by Product Type, 2018 to 2033
Figure 45: Latin America Market Volume (MT) Analysis by Product Type, 2018 to 2033
Figure 46: Latin America Market Value Share (%) and BPS Analysis by Product Type, 2023 to 2033
Figure 47: Latin America Market Y-o-Y Growth (%) Projections by Product Type, 2023 to 2033
Figure 48: Latin America Market Value (US$ Million) Analysis by End Use, 2018 to 2033
Figure 49: Latin America Market Volume (MT) Analysis by End Use, 2018 to 2033
Figure 50: Latin America Market Value Share (%) and BPS Analysis by End Use, 2023 to 2033
Figure 51: Latin America Market Y-o-Y Growth (%) Projections by End Use, 2023 to 2033
Figure 52: Latin America Market Attractiveness by Product Type, 2023 to 2033
Figure 53: Latin America Market Attractiveness by End Use, 2023 to 2033
Figure 54: Latin America Market Attractiveness by Country, 2023 to 2033
Figure 55: Europe Market Value (US$ Million) by Product Type, 2023 to 2033
Figure 56: Europe Market Value (US$ Million) by End Use, 2023 to 2033
Figure 57: Europe Market Value (US$ Million) by Country, 2023 to 2033
Figure 58: Europe Market Value (US$ Million) Analysis by Country, 2018 to 2033
Figure 59: Europe Market Volume (MT) Analysis by Country, 2018 to 2033
Figure 60: Europe Market Value Share (%) and BPS Analysis by Country, 2023 to 2033
Figure 61: Europe Market Y-o-Y Growth (%) Projections by Country, 2023 to 2033
Figure 62: Europe Market Value (US$ Million) Analysis by Product Type, 2018 to 2033
Figure 63: Europe Market Volume (MT) Analysis by Product Type, 2018 to 2033
Figure 64: Europe Market Value Share (%) and BPS Analysis by Product Type, 2023 to 2033
Figure 65: Europe Market Y-o-Y Growth (%) Projections by Product Type, 2023 to 2033
Figure 66: Europe Market Value (US$ Million) Analysis by End Use, 2018 to 2033
Figure 67: Europe Market Volume (MT) Analysis by End Use, 2018 to 2033
Figure 68: Europe Market Value Share (%) and BPS Analysis by End Use, 2023 to 2033
Figure 69: Europe Market Y-o-Y Growth (%) Projections by End Use, 2023 to 2033
Figure 70: Europe Market Attractiveness by Product Type, 2023 to 2033
Figure 71: Europe Market Attractiveness by End Use, 2023 to 2033
Figure 72: Europe Market Attractiveness by Country, 2023 to 2033
Figure 73: East Asia Market Value (US$ Million) by Product Type, 2023 to 2033
Figure 74: East Asia Market Value (US$ Million) by End Use, 2023 to 2033
Figure 75: East Asia Market Value (US$ Million) by Country, 2023 to 2033
Figure 76: East Asia Market Value (US$ Million) Analysis by Country, 2018 to 2033
Figure 77: East Asia Market Volume (MT) Analysis by Country, 2018 to 2033
Figure 78: East Asia Market Value Share (%) and BPS Analysis by Country, 2023 to 2033
Figure 79: East Asia Market Y-o-Y Growth (%) Projections by Country, 2023 to 2033
Figure 80: East Asia Market Value (US$ Million) Analysis by Product Type, 2018 to 2033
Figure 81: East Asia Market Volume (MT) Analysis by Product Type, 2018 to 2033
Figure 82: East Asia Market Value Share (%) and BPS Analysis by Product Type, 2023 to 2033
Figure 83: East Asia Market Y-o-Y Growth (%) Projections by Product Type, 2023 to 2033
Figure 84: East Asia Market Value (US$ Million) Analysis by End Use, 2018 to 2033
Figure 85: East Asia Market Volume (MT) Analysis by End Use, 2018 to 2033
Figure 86: East Asia Market Value Share (%) and BPS Analysis by End Use, 2023 to 2033
Figure 87: East Asia Market Y-o-Y Growth (%) Projections by End Use, 2023 to 2033
Figure 88: East Asia Market Attractiveness by Product Type, 2023 to 2033
Figure 89: East Asia Market Attractiveness by End Use, 2023 to 2033
Figure 90: East Asia Market Attractiveness by Country, 2023 to 2033
Figure 91: South Asia Market Value (US$ Million) by Product Type, 2023 to 2033
Figure 92: South Asia Market Value (US$ Million) by End Use, 2023 to 2033
Figure 93: South Asia Market Value (US$ Million) by Country, 2023 to 2033
Figure 94: South Asia Market Value (US$ Million) Analysis by Country, 2018 to 2033
Figure 95: South Asia Market Volume (MT) Analysis by Country, 2018 to 2033
Figure 96: South Asia Market Value Share (%) and BPS Analysis by Country, 2023 to 2033
Figure 97: South Asia Market Y-o-Y Growth (%) Projections by Country, 2023 to 2033
Figure 98: South Asia Market Value (US$ Million) Analysis by Product Type, 2018 to 2033
Figure 99: South Asia Market Volume (MT) Analysis by Product Type, 2018 to 2033
Figure 100: South Asia Market Value Share (%) and BPS Analysis by Product Type, 2023 to 2033
Figure 101: South Asia Market Y-o-Y Growth (%) Projections by Product Type, 2023 to 2033
Figure 102: South Asia Market Value (US$ Million) Analysis by End Use, 2018 to 2033
Figure 103: South Asia Market Volume (MT) Analysis by End Use, 2018 to 2033
Figure 104: South Asia Market Value Share (%) and BPS Analysis by End Use, 2023 to 2033
Figure 105: South Asia Market Y-o-Y Growth (%) Projections by End Use, 2023 to 2033
Figure 106: South Asia Market Attractiveness by Product Type, 2023 to 2033
Figure 107: South Asia Market Attractiveness by End Use, 2023 to 2033
Figure 108: South Asia Market Attractiveness by Country, 2023 to 2033
Figure 109: Oceania Market Value (US$ Million) by Product Type, 2023 to 2033
Figure 110: Oceania Market Value (US$ Million) by End Use, 2023 to 2033
Figure 111: Oceania Market Value (US$ Million) by Country, 2023 to 2033
Figure 112: Oceania Market Value (US$ Million) Analysis by Country, 2018 to 2033
Figure 113: Oceania Market Volume (MT) Analysis by Country, 2018 to 2033
Figure 114: Oceania Market Value Share (%) and BPS Analysis by Country, 2023 to 2033
Figure 115: Oceania Market Y-o-Y Growth (%) Projections by Country, 2023 to 2033
Figure 116: Oceania Market Value (US$ Million) Analysis by Product Type, 2018 to 2033
Figure 117: Oceania Market Volume (MT) Analysis by Product Type, 2018 to 2033
Figure 118: Oceania Market Value Share (%) and BPS Analysis by Product Type, 2023 to 2033
Figure 119: Oceania Market Y-o-Y Growth (%) Projections by Product Type, 2023 to 2033
Figure 120: Oceania Market Value (US$ Million) Analysis by End Use, 2018 to 2033
Figure 121: Oceania Market Volume (MT) Analysis by End Use, 2018 to 2033
Figure 122: Oceania Market Value Share (%) and BPS Analysis by End Use, 2023 to 2033
Figure 123: Oceania Market Y-o-Y Growth (%) Projections by End Use, 2023 to 2033
Figure 124: Oceania Market Attractiveness by Product Type, 2023 to 2033
Figure 125: Oceania Market Attractiveness by End Use, 2023 to 2033
Figure 126: Oceania Market Attractiveness by Country, 2023 to 2033
Figure 127: Middle East & Africa Market Value (US$ Million) by Product Type, 2023 to 2033
Figure 128: Middle East & Africa Market Value (US$ Million) by End Use, 2023 to 2033
Figure 129: Middle East & Africa Market Value (US$ Million) by Country, 2023 to 2033
Figure 130: Middle East & Africa Market Value (US$ Million) Analysis by Country, 2018 to 2033
Figure 131: Middle East & Africa Market Volume (MT) Analysis by Country, 2018 to 2033
Figure 132: Middle East & Africa Market Value Share (%) and BPS Analysis by Country, 2023 to 2033
Figure 133: Middle East & Africa Market Y-o-Y Growth (%) Projections by Country, 2023 to 2033
Figure 134: Middle East & Africa Market Value (US$ Million) Analysis by Product Type, 2018 to 2033
Figure 135: Middle East & Africa Market Volume (MT) Analysis by Product Type, 2018 to 2033
Figure 136: Middle East & Africa Market Value Share (%) and BPS Analysis by Product Type, 2023 to 2033
Figure 137: Middle East & Africa Market Y-o-Y Growth (%) Projections by Product Type, 2023 to 2033
Figure 138: Middle East & Africa Market Value (US$ Million) Analysis by End Use, 2018 to 2033
Figure 139: Middle East & Africa Market Volume (MT) Analysis by End Use, 2018 to 2033
Figure 140: Middle East & Africa Market Value Share (%) and BPS Analysis by End Use, 2023 to 2033
Figure 141: Middle East & Africa Market Y-o-Y Growth (%) Projections by End Use, 2023 to 2033
Figure 142: Middle East & Africa Market Attractiveness by Product Type, 2023 to 2033
Figure 143: Middle East & Africa Market Attractiveness by End Use, 2023 to 2033
Figure 144: Middle East & Africa Market Attractiveness by Country, 2023 to 2033
Need specific information?
Request CustomizationExplore Food and Beverage Insights
View Reports