Nutraceutical CDMO Market Size and Share Forecast Outlook 2025 to 2035

The Nutraceutical CDMO Market is estimated to be valued at USD 37731.7 million in 2025 and is projected to reach USD 65064.8 million by 2035, registering a compound annual growth rate (CAGR) of 5.5% over the forecast period.
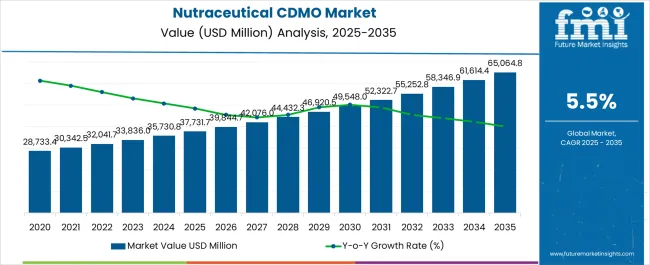
Quick Stats for Nutraceutical CDMO Market

  • Nutraceutical CDMO Market Industry Value (2025): USD 37731.7 million
  • Nutraceutical CDMO Market Forecast Value (2035): USD 65064.8 million
  • Nutraceutical CDMO Market Forecast CAGR: 5.5%
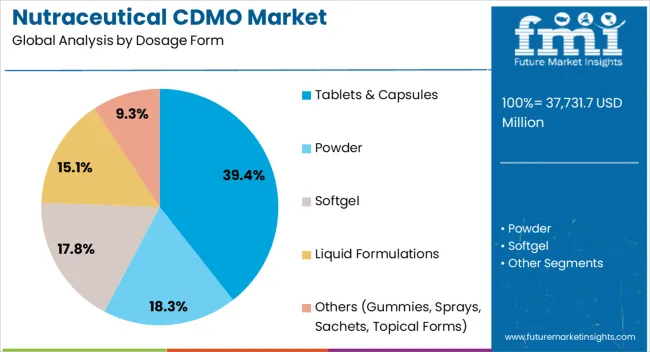
  • Leading Segment in Nutraceutical CDMO Market in 2025: Tablets & Capsules (39.4%)
  • Key Growth Region in Nutraceutical CDMO Market: North America, Asia-Pacific, Europe
  • Top Key Players in Nutraceutical CDMO Market: Catalent, Lonza, Aenova Group, Akums Drugs And Pharmaceutical Ltd., BASF SE, Sirio Pharma, Pharmavite LLC, Nature's Products, Inc., PLT Health Solutions, Glanbia Nutritionals, Recipharm AB, B&D Nutritional Ingredients, NutraScience Labs, Vitakem Nutraceutical Inc., Softigel (A Division Of Procaps Group), Iprona AG, Nutrilo GmbH, Atlantic Essential Products, Inc., ProTec Nutra Ltd., Nutraceuticals International Group

Nutraceutical Cdmo Market Market Value Analysis

Metric Value
Nutraceutical CDMO Market Estimated Value in (2025 E) USD 37731.7 million
Nutraceutical CDMO Market Forecast Value in (2035 F) USD 65064.8 million
Forecast CAGR (2025 to 2035) 5.5%

Rationale for Segmental Growth in the Nutraceutical CDMO Market

The nutraceutical CDMO market is gaining traction due to the rising demand for outsourced development and manufacturing services in the health and wellness sector. Companies are increasingly turning to CDMOs for cost optimization, scalability, and regulatory compliance support, enabling faster time-to-market for nutraceutical products.

Market growth is further reinforced by the complexity of formulation technologies, the need for high-quality packaging solutions, and the expanding portfolio of delivery formats catering to diverse consumer preferences. Current trends indicate robust activity from mid-sized and emerging nutraceutical brands, which leverage CDMO expertise to bridge gaps in technical capacity and global distribution.

With consumer demand for functional foods, dietary supplements, and personalized nutrition products steadily rising, CDMOs are expected to expand service offerings. The future outlook is shaped by strategic partnerships, advanced process automation, and regulatory harmonization across key markets, positioning the industry for sustainable growth.
Segmental Analysis

Insights into the Tablets & Capsules Segment

Nutraceutical Cdmo Market Analysis By Dosage Form

The tablets and capsules segment dominates the dosage form category with approximately 39.4% share, supported by consumer preference for familiar and convenient formats. These dosage forms ensure precise dosing, extended shelf life, and ease of consumption, making them a preferred choice for nutraceutical brands.

CDMOs benefit from established manufacturing infrastructure and advanced encapsulation technologies, which allow them to deliver high-quality, compliant products efficiently. Demand is further supported by innovations in controlled-release formulations and vegetarian capsule options, aligning with evolving consumer preferences.

The segment’s leadership is also reinforced by its scalability, enabling both small and large batch production. With consistent adoption across global nutraceutical markets, tablets and capsules are expected to retain their leading position in the forecast period.
Insights into the Manufacturing and Packaging Segment

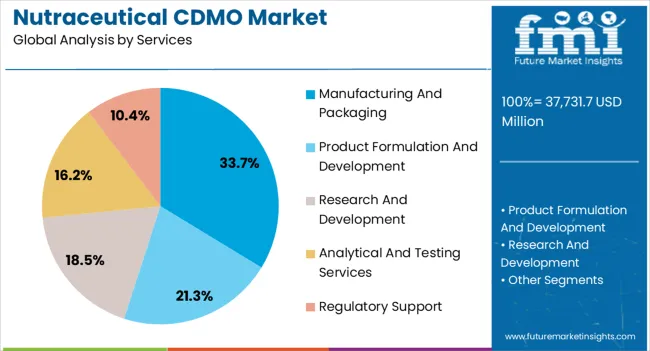
Nutraceutical Cdmo Market Analysis By Services

The manufacturing and packaging segment leads the services category, holding approximately 33.7% share. This segment’s prominence is underpinned by the outsourcing needs of nutraceutical brands that lack in-house infrastructure or regulatory expertise.

CDMOs provide end-to-end solutions encompassing formulation, scale-up, and compliant packaging, ensuring faster commercialization of products. Packaging has gained strategic importance due to consumer demand for convenience, sustainability, and extended product shelf life.

By offering integrated services, CDMOs streamline supply chains, minimize operational risks, and enhance product differentiation in competitive markets. With rising pressure to meet international regulatory standards and achieve cost efficiency, demand for manufacturing and packaging services is expected to strengthen further, sustaining this segment’s leadership.
Insights into the Mid-Sized Companies Segment

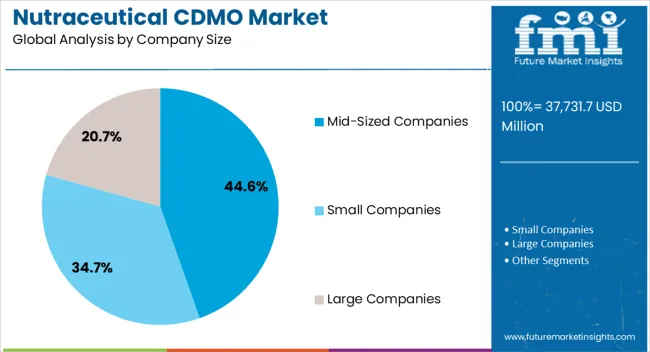
Nutraceutical Cdmo Market Analysis By Company Size

The mid-sized companies segment accounts for approximately 44.6% share in the company size category, highlighting their pivotal role in the nutraceutical CDMO market. These companies often rely on CDMOs to compensate for limited in-house capabilities while focusing resources on branding, marketing, and customer engagement.

Their agility allows for quicker adoption of innovative formulations and novel delivery systems, creating consistent demand for specialized CDMO services. Mid-sized firms also benefit from flexible manufacturing partnerships that reduce capital expenditure and mitigate compliance risks.

The segment’s dominance is reinforced by its dynamic growth, particularly in emerging markets where demand for dietary supplements and fortified foods is expanding. With increasing competition and the need for differentiation, mid-sized companies are projected to remain key drivers of CDMO market demand.

Key Factors Driving Growth in the Nutraceutical CDMO Market

  • Burgeoning demand for nutraceutical products, including functional foods, dietary supplements, and beverages
  • Rising popularity of nutraceutical contract manufacturing services globally
  • Increasing research and development activities
  • Growing need for nutraceutical encapsulation services globally
  • The ability of CDMOs to help nutraceutical companies ensure compliance with quality and safety standards.
  • Growing awareness about the benefits of outsourcing manufacturing to CDMOs
  • Rise in collaborations and partnerships between nutraceutical giants and CDMOs
  • Increasing number of contract development and manufacturing organizations for nutraceuticals
  • Escalating demand for functional food contract manufacturing services and expansion of dietary supplement CDMOs in developing regions
  • Multiple advantages of outsourced nutraceutical production

Nutraceutical CDMO Market Trends and Analysis

  • Growing trend of outsourcing services in the nutraceutical industry
  • Adoption of novel technologies like robotic process automation and AI in manufacturing and product development
  • Rising popularity of personalized nutrition
  • Surging demand for clean-label products

Comparison of Historical and Future Outlooks of the Nutraceutical CDMO Market

The global market for nutraceutical CDMOs recorded a CAGR of 4.6% from 2020 to 2025. Total market valuation reached around USD 33,466.0 million at the end of 2025. Over the assessment period, the target market is projected to exhibit a CAGR of 5.6%.

Historical CAGR (2020 to 2025) 4.6%
Forecast CAGR (2025 to 2035) 5.6%

The global nutraceutical market is witnessing steady growth, fueled by increasing health awareness and a growing preference for preventive healthcare. Consumers today are more proactive in managing their well-being, seeking dietary supplements and functional foods to address specific health concerns. This shift in consumer behavior is a key driver shaping the trajectory of the global nutraceutical CDMO industry.

Nutraceutical CDMOs have emerged as critical facilitators in this vibrant market, responding to consumer expectations by offering a spectrum of innovative and high-quality products. These organizations leverage their technical expertise and purpose-filled facilities to develop formulations that resonate with the health-conscious consumer demographic.

One notable aspect of the consumer-driven demand is the growing interest in personalized nutrition. Consumers are increasingly seeking tailored solutions that cater to their unique health needs. Nutraceutical CDMOs are responding to this trend by providing customization options, allowing companies to create products that align with specific consumer preferences.

The nutraceutical industry is subject to increased regulations, and compliance is paramount. Nutraceutical CDMOs, equipped with manufacturing expertise and a deep understanding of regulatory requirements, are becoming increasingly attractive partners for brands looking to outsource production. The trend toward outsourcing is expected to rise as companies seek to navigate complex regulatory landscapes efficiently.

A rising focus on reducing overall nutraceutical product development costs is expected to boost sales in the market. Subsequently, the growing demand for dietary supplement CDMO services will foster growth.

Insights into Lucrative Opportunities Propelling Nutraceutical CDMO Demand

According to the Journal of Clinical Sleep Medicine, with about 30% of United States adults experiencing insomnia, there is a pronounced demand for effective sleep support solutions. Nutraceutical CDMOs can leverage their formulation expertise and manufacturing capabilities to develop innovative sleep aid products. This includes the production of sleep-inducing supplements, herbal formulations, and other solutions designed to improve sleep quality.

The growing rates of anxiety, depression, and heightened awareness of stress management present an opportunity for CDMOs to contribute to the development of mood and mental health support products. By incorporating scientifically-backed ingredients, CDMOs can formulate supplements that address specific mood-related concerns, providing consumers with effective and safe options for mental well-being.

Nutraceutical CDMOs have the flexibility to tailor formulations to specific health needs within the sleep, mood, and brain health segments. This customization can include the incorporation of herbal extracts, vitamins, minerals, and other bioactive compounds known for their therapeutic effects. The ability to create tailored solutions enhances the market appeal of these products.

The opportunity for nutraceutical CDMOs lies in addressing the burgeoning demand for sleep, mood, and brain health solutions. To benefit from this, CDMOs are focusing on providing tailored formulations, investing in research and development, and collaborating with brands at the forefront of these segments.

CDMOs are becoming key enablers in providing effective, high-quality nutraceuticals that cater to the unique health needs of consumers. As the sales of nutraceutical products continue to rise globally, so will the demand for nutraceutical contract development and manufacturing services.

Overview of Restrictive Factors Limiting Growth in the Nutraceutical CDMO Market

One significant restriction affecting the nutraceutical CDMO market is the increasingly stringent regulatory landscape governing the production and marketing of nutraceutical products. Regulatory requirements, both at national and international levels, have become more complex, impacting the operations of CDMOs and influencing the overall market dynamics.

According to a report by the Global Organization for EPA and DHA Omega-3s (GOED), the regulatory environment for nutraceuticals has seen notable changes. For instance, in the United States, the Food and Drug Administration (FDA) has been focusing on implementing the Dietary Supplement Health and Education Act (DSHEA), ensuring the safety and quality of dietary supplements.

The European Food Safety Authority (EFSA) has been actively involved in evaluating health claims related to nutraceutical products, adding an additional layer of scrutiny. The need for compliance with stringent regulatory standards translates into increased compliance costs for nutraceutical CDMOs.

Investments in quality control, documentation, and adherence to Good Manufacturing Practices (GMP) become essential, impacting the overall operational expenses. The regulatory approval process for new formulations or ingredients can be time-consuming. Delays in obtaining approvals may hinder the speed-to-market advantage that CDMOs could otherwise offer to their clients, affecting the overall efficiency of product development.

Analysis of Top Countries Manufacturing, Certifying, and Utilizing Nutraceutical CDMO Services

The section highlights growth projections across prominent countries. China and Japan are predicted to register higher CAGRs of 7.4% and 3.4%, respectively, through 2035. This is due to the growing popularity of nutraceutical products in these nations. Similarly, the nutraceutical CDMO market in India and their emerging nations is expected to progress rapidly.

Market Growth Outlook by Key Countries

Country Value CAGR
United States 1.8%
China 7.4%
Japan 3.4%
Germany 1.7%
Spain 2.8%

Growing Demand for Functional Foods Boosting the United States Market

The United States currently dominates the global nutraceutical CDMO industry with a share of around 32.6%. Over the forecast period, the United States nutraceutical CDMO market is expected to exhibit a CAGR of 1.8%.

The United has one of the leading markets for nutraceuticals globally. Rising health awareness and a growing aging population are creating a high demand for dietary supplements and functional foods in the United States. This, in turn, will boost the target market.

The presence of cutting-edge research facilities and a robust ecosystem for product development drives the demand for specialized services offered by nutraceutical CDMOs. The regulatory framework, including the Dietary Supplement Health and Education Act (DSHEA), provides a structured environment for the nutraceutical industry. This clarity contributes to the growth of the nutraceutical CDMO market by fostering compliance and ensuring product quality.

Escalating Popularity of Nutraceutical Products Driving Demand in China

In 2025, China held a significant value share of 7.9% in the global nutraceutical CDMO market. Over the assessment period, demand for CDMO services in China is poised to grow with a CAGR of 7.4%.

China's rising middle class and increasing health and wellness awareness have fueled a growing demand for nutraceutical products. Similarly, the population's interest in preventive healthcare and dietary supplements has led to a thriving nutraceutical market. This is expected to drive the need for CDMOs to support the development and manufacturing of nutraceutical products.

The country’s government has shown support for the nutraceutical industry through favorable policies and regulations. The emphasis on health and wellness aligns with the government's broader public health initiatives, contributing to the growth of the nutraceutical CDMO market.

China is a key player in global manufacturing, and its nutraceutical CDMOs benefit from advanced manufacturing capabilities. The availability of cost-effective manufacturing services attracts both domestic and international companies looking for efficient production solutions.

Growing Emphasis on Research and Innovation Fostering Growth in Germany

Germany accounted for an 8.5% value share of the global market in 2025 and is expected to grow with a CAGR of 1.7% during the forecast period. This is due to the increasing consumption of functional foods and rising emphasis on research and innovation.

Germany is known for its commitment to quality and high manufacturing standards. Nutraceutical CDMOs in Germany often adhere to stringent quality control measures, attracting clients who prioritize product quality and safety.

The Germany market is characterized by sophisticated consumers who value premium and scientifically-backed nutraceutical products. CDMOs offering advanced formulation and production capabilities align well with the demands of this discerning market.

Germany has a strong emphasis on research and innovation in the healthcare sector. Nutraceutical CDMOs benefit from access to cutting-edge research and technology, contributing to their ability to offer innovative solutions to clients.

Nutraceutical CDMO Industry Analysis by Top Investment Segments

The section below highlights key segments' estimated market shares and CAGRs, including dosage form, services, and company size. This information can be vital for companies to frame their strategies accordingly.

  • Holding a share of 42.1%, the tablets & capsules segment leads the global nutraceutical CDMO industry.
  • The manufacturing and packaging segment holds a dominant market share of 33.1% and is set to progress at 4.7% CAGR through 2035.
  • The mid-sized companies segment accounted for a market share of 46.2% in 2025.

Tablets and Capsules to Generate Significant Revenue in the Market

Market Growth Outlook by Dosage Form

Dosage Form Value CAGR
Tablets & Capsules 3.5%
Powder 5.3%
Softgel 6.9%
Liquid Formulations 7.3%
Others (Gummies, Sprays, Sachets, Topical Forms) 8.7%

The tablets and capsules segment held a prominent market revenue share of 42.1% in 2025. Over the forecast period, the target segment is projected to advance with a CAGR of 3.5%. This is attributed to the rising popularity and consumption of nutraceutical tablets and capsules.

Tablets and capsules are popular dosage forms among consumers due to their convenience, ease of use, and familiarity. Many consumers find these solid oral dosage forms more convenient to incorporate into their daily routines than other formats like powders or liquid supplements.

Tablets and capsules are well-suited for high-volume manufacturing, making them cost-effective for both manufacturers and consumers. Hence, the target segment is expected to generate significant revenue in the global nutraceutical CDMO industry through 2035.

Demand Remains High for Manufacturing and Packaging Services

Market Growth Outlook by Services

Services Value CAGR
Product Formulation and Development 5.3%
Manufacturing and Packaging 4.7%
Research and Development 6.1%
Analytical and Testing Services 6.9%
Regulatory Support 7.3%

As per the latest analysis, demand remains high for nutraceutical manufacturing and packaging services in the market. The target segment held a market share of 33.1% in 2025. In the assessment period, it will likely grow with a CAGR of 4.7%.

Outsourcing manufacturing and packaging functions can be cost-effective for nutraceutical companies. CDMOs often have economies of scale, advanced equipment, and expertise in optimizing production processes, leading to cost savings for clients.

CDMOs specializing in manufacturing services often have extensive expertise in formulation development. This expertise allows them to create custom formulations that meet the specific requirements and preferences of nutraceutical brands, contributing to product differentiation and market competitiveness.

Mid-sized Companies to Rule the Global Market by 2035

Market Growth Outlook by Key Company Size

Company Size Value CAGR
Small Companies 5.8%
Mid-sized Companies 4.7%
Large Companies 7.3%

The mid-sized companies segment accounted for a dominant industry share of nutraceutical CDMOs in 2025. Over the forecast period, it is poised to exhibit a CAGR of 4.7%.

Mid-sized CDMOs have the capability to offer personalized and customized services to their clients. Unlike larger CDMOs, they can provide a more hands-on and collaborative approach, working closely with clients to develop formulations, optimize processes, and meet specific requirements.

Mid-sized CDMOs are often characterized by a level of flexibility and agility that allows them to adapt quickly to changing market demands. As a result, the mid-sized companies category is expected to retain its market dominance through 2035.
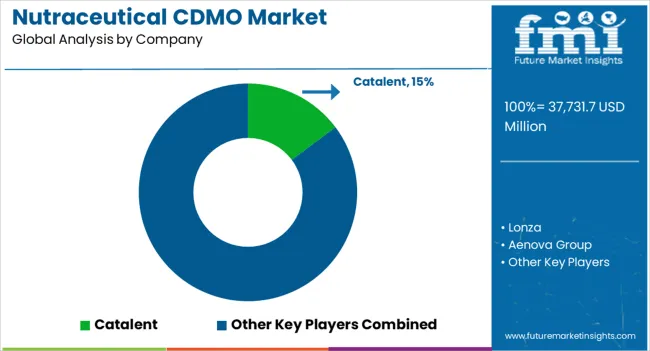
Competitive Landscape of the Nutraceutical CDMO Market

Nutraceutical Cdmo Market Analysis By Company

Collaborations and acquisitions are common strategies employed by companies in the nutraceutical CDMO market to enhance their capabilities, expand their service offerings, and stay competitive in the dynamic landscape of advanced therapeutics. They are also integrating advanced technologies to improve their productivity.

Recent Developments in the Nutraceutical CDMO Market

  • In May 2025, Biofarma Group, a global CDMO, acquired US Pharma Lab, a leading and fast-growing company in the United States focused on the development, production, and distribution of nutraceuticals, including probiotics, vitamins, and minerals, supplements, and premium food ingredients.
  • In August 2025, Health Wright Products, a contract manufacturer of products in capsules, was acquired by IFF (International Flavors & Fragrances Inc.). Health Wright Products' formulation and finished format abilities will allow IFF to develop new and innovative products.

Scope and Coverage of the Nutraceutical CDMO Industry Report

Attribute Details
Estimated Market Size (2025) USD 37731.7 million
Projected Market Value (2035) USD 65064.8 million
Expected Growth Rate (2025 to 2035) 5.5% CAGR
Forecast Period 2025 to 2035
Historical Data Available for 2020 to 2025
Market Analysis USD Million for Value
Key Regions Covered North America; Latin America; East Asia; South Asia & Pacific; Western Europe; Eastern Europe; Middle East & Africa
Key Countries Covered United States, Canada, Mexico, Brazil, Chile, China, Japan, South Korea, Germany, France, Spain, Italy, BENELUX, Nordic Countries, United Kingdom, BENELUX, Poland, Hungary, Romania, India, ASEAN Countries, Australia & New Zealand, Saudi Arabia, South Africa, Türkiye, Other African Union
Key Market Segments Covered Dosage Form, Services, Company Size, and Region
Key Companies Profiled Catalent; Lonza; Aenova Group; Akums Drugs and Pharmaceutical Ltd.; BASF SE; Sirio Pharma; Pharmavite LLC; Nature's Products, Inc.; PLT Health Solutions; Glanbia Nutritionals; Recipharm AB; B&D Nutritional Ingredients; NutraScience Labs; Vitakem Nutraceutical Inc.; Softigel (A division of Procaps Group); Iprona AG; Nutrilo GmbH; Atlantic Essential Products, Inc.; ProTec Nutra Ltd.; Nutraceuticals International Group
Report Coverage Market Forecast, Competition Intelligence, Drivers, Restraints, Trends, Opportunities, Market Dynamics and Challenges, Strategic Growth Initiatives

Top Segments Studied in the Nutraceutical CDMO Industry Research

By Dosage Form:

  • Tablets & Capsules
  • Powder
  • Softgel
  • Liquid Formulations
  • Others (Gummies, Sprays, Sachets, Topical Forms)

By Services:

  • Product Formulation and Development
  • Manufacturing and Packaging
  • Research and Development
  • Analytical and Testing Services
  • Regulatory Support

By Company Size:

  • Small Companies
  • Mid-sized Companies
  • Large Companies

By Region:

  • North America
  • Latin America
  • East Asia
  • South Asia & Pacific
  • Western Europe
  • Eastern Europe
  • Middle East & Africa

Frequently Asked Questions

How big is the nutraceutical CDMO market in 2025?

The global nutraceutical CDMO market is estimated to be valued at USD 37,731.7 million in 2025.

What will be the size of nutraceutical CDMO market in 2035?

The market size for the nutraceutical CDMO market is projected to reach USD 65,064.8 million by 2035.

How much will be the nutraceutical CDMO market growth between 2025 and 2035?

The nutraceutical CDMO market is expected to grow at a 5.5% CAGR between 2025 and 2035.

What are the key product types in the nutraceutical CDMO market?

The key product types in nutraceutical CDMO market are tablets & capsules, powder, softgel, liquid formulations and others (gummies, sprays, sachets, topical forms).

Which services segment to contribute significant share in the nutraceutical CDMO market in 2025?

In terms of services, manufacturing and packaging segment to command 33.7% share in the nutraceutical CDMO market in 2025.

Table of Content

  1. Executive Summary
    • Global Market Outlook
    • Demand-side Trends
    • Supply-side Trends
    • Technology Roadmap Analysis
    • Analysis and Recommendations
  2. Market Overview
    • Market Coverage / Taxonomy
    • Market Definition / Scope / Limitations
  3. Market Background
    • Market Dynamics
      • Drivers
      • Restraints
      • Opportunity
      • Trends
    • Scenario Forecast
      • Demand in Optimistic Scenario
      • Demand in Likely Scenario
      • Demand in Conservative Scenario
    • Opportunity Map Analysis
    • Product Life Cycle Analysis
    • Supply Chain Analysis
    • Investment Feasibility Matrix
    • Value Chain Analysis
    • PESTLE and Porter’s Analysis
    • Regulatory Landscape
    • Regional Parent Market Outlook
    • Production and Consumption Statistics
    • Import and Export Statistics
  4. Global Market Analysis 2020 to 2024 and Forecast, 2025 to 2035
    • Historical Market Size Value (USD Million) Analysis, 2020 to 2024
    • Current and Future Market Size Value (USD Million) Projections, 2025 to 2035
      • Y-o-Y Growth Trend Analysis
      • Absolute $ Opportunity Analysis
  5. Global Market Pricing Analysis 2020 to 2024 and Forecast 2025 to 2035
  6. Global Market Analysis 2020 to 2024 and Forecast 2025 to 2035, By Dosage Form
    • Introduction / Key Findings
    • Historical Market Size Value (USD Million) Analysis By Dosage Form , 2020 to 2024
    • Current and Future Market Size Value (USD Million) Analysis and Forecast By Dosage Form , 2025 to 2035
      • Tablets & Capsules
      • Powder
      • Softgel
      • Liquid Formulations
      • Others (Gummies, Sprays, Sachets, Topical Forms)
    • Y-o-Y Growth Trend Analysis By Dosage Form , 2020 to 2024
    • Absolute $ Opportunity Analysis By Dosage Form , 2025 to 2035
  7. Global Market Analysis 2020 to 2024 and Forecast 2025 to 2035, By Services
    • Introduction / Key Findings
    • Historical Market Size Value (USD Million) Analysis By Services, 2020 to 2024
    • Current and Future Market Size Value (USD Million) Analysis and Forecast By Services, 2025 to 2035
      • Manufacturing And Packaging
      • Product Formulation And Development
      • Research And Development
      • Analytical And Testing Services
      • Regulatory Support
    • Y-o-Y Growth Trend Analysis By Services, 2020 to 2024
    • Absolute $ Opportunity Analysis By Services, 2025 to 2035
  8. Global Market Analysis 2020 to 2024 and Forecast 2025 to 2035, By Company Size
    • Introduction / Key Findings
    • Historical Market Size Value (USD Million) Analysis By Company Size, 2020 to 2024
    • Current and Future Market Size Value (USD Million) Analysis and Forecast By Company Size, 2025 to 2035
      • Mid-Sized Companies
      • Small Companies
      • Large Companies
    • Y-o-Y Growth Trend Analysis By Company Size, 2020 to 2024
    • Absolute $ Opportunity Analysis By Company Size, 2025 to 2035
  9. Global Market Analysis 2020 to 2024 and Forecast 2025 to 2035, By Region
    • Introduction
    • Historical Market Size Value (USD Million) Analysis By Region, 2020 to 2024
    • Current Market Size Value (USD Million) Analysis and Forecast By Region, 2025 to 2035
      • North America
      • Latin America
      • Western Europe
      • Eastern Europe
      • East Asia
      • South Asia and Pacific
      • Middle East & Africa
    • Market Attractiveness Analysis By Region
  10. North America Market Analysis 2020 to 2024 and Forecast 2025 to 2035, By Country
    • Historical Market Size Value (USD Million) Trend Analysis By Market Taxonomy, 2020 to 2024
    • Market Size Value (USD Million) Forecast By Market Taxonomy, 2025 to 2035
      • By Country
        • USA
        • Canada
        • Mexico
      • By Dosage Form
      • By Services
      • By Company Size
    • Market Attractiveness Analysis
      • By Country
      • By Dosage Form
      • By Services
      • By Company Size
    • Key Takeaways
  11. Latin America Market Analysis 2020 to 2024 and Forecast 2025 to 2035, By Country
    • Historical Market Size Value (USD Million) Trend Analysis By Market Taxonomy, 2020 to 2024
    • Market Size Value (USD Million) Forecast By Market Taxonomy, 2025 to 2035
      • By Country
        • Brazil
        • Chile
        • Rest of Latin America
      • By Dosage Form
      • By Services
      • By Company Size
    • Market Attractiveness Analysis
      • By Country
      • By Dosage Form
      • By Services
      • By Company Size
    • Key Takeaways
  12. Western Europe Market Analysis 2020 to 2024 and Forecast 2025 to 2035, By Country
    • Historical Market Size Value (USD Million) Trend Analysis By Market Taxonomy, 2020 to 2024
    • Market Size Value (USD Million) Forecast By Market Taxonomy, 2025 to 2035
      • By Country
        • Germany
        • UK
        • Italy
        • Spain
        • France
        • Nordic
        • BENELUX
        • Rest of Western Europe
      • By Dosage Form
      • By Services
      • By Company Size
    • Market Attractiveness Analysis
      • By Country
      • By Dosage Form
      • By Services
      • By Company Size
    • Key Takeaways
  13. Eastern Europe Market Analysis 2020 to 2024 and Forecast 2025 to 2035, By Country
    • Historical Market Size Value (USD Million) Trend Analysis By Market Taxonomy, 2020 to 2024
    • Market Size Value (USD Million) Forecast By Market Taxonomy, 2025 to 2035
      • By Country
        • Russia
        • Poland
        • Hungary
        • Balkan & Baltic
        • Rest of Eastern Europe
      • By Dosage Form
      • By Services
      • By Company Size
    • Market Attractiveness Analysis
      • By Country
      • By Dosage Form
      • By Services
      • By Company Size
    • Key Takeaways
  14. East Asia Market Analysis 2020 to 2024 and Forecast 2025 to 2035, By Country
    • Historical Market Size Value (USD Million) Trend Analysis By Market Taxonomy, 2020 to 2024
    • Market Size Value (USD Million) Forecast By Market Taxonomy, 2025 to 2035
      • By Country
        • China
        • Japan
        • South Korea
      • By Dosage Form
      • By Services
      • By Company Size
    • Market Attractiveness Analysis
      • By Country
      • By Dosage Form
      • By Services
      • By Company Size
    • Key Takeaways
  15. South Asia and Pacific Market Analysis 2020 to 2024 and Forecast 2025 to 2035, By Country
    • Historical Market Size Value (USD Million) Trend Analysis By Market Taxonomy, 2020 to 2024
    • Market Size Value (USD Million) Forecast By Market Taxonomy, 2025 to 2035
      • By Country
        • India
        • ASEAN
        • Australia & New Zealand
        • Rest of South Asia and Pacific
      • By Dosage Form
      • By Services
      • By Company Size
    • Market Attractiveness Analysis
      • By Country
      • By Dosage Form
      • By Services
      • By Company Size
    • Key Takeaways
  16. Middle East & Africa Market Analysis 2020 to 2024 and Forecast 2025 to 2035, By Country
    • Historical Market Size Value (USD Million) Trend Analysis By Market Taxonomy, 2020 to 2024
    • Market Size Value (USD Million) Forecast By Market Taxonomy, 2025 to 2035
      • By Country
        • Kingdom of Saudi Arabia
        • Other GCC Countries
        • Turkiye
        • South Africa
        • Other African Union
        • Rest of Middle East & Africa
      • By Dosage Form
      • By Services
      • By Company Size
    • Market Attractiveness Analysis
      • By Country
      • By Dosage Form
      • By Services
      • By Company Size
    • Key Takeaways
  17. Key Countries Market Analysis
    • USA
      • Pricing Analysis
      • Market Share Analysis, 2024
        • By Dosage Form
        • By Services
        • By Company Size
    • Canada
      • Pricing Analysis
      • Market Share Analysis, 2024
        • By Dosage Form
        • By Services
        • By Company Size
    • Mexico
      • Pricing Analysis
      • Market Share Analysis, 2024
        • By Dosage Form
        • By Services
        • By Company Size
    • Brazil
      • Pricing Analysis
      • Market Share Analysis, 2024
        • By Dosage Form
        • By Services
        • By Company Size
    • Chile
      • Pricing Analysis
      • Market Share Analysis, 2024
        • By Dosage Form
        • By Services
        • By Company Size
    • Germany
      • Pricing Analysis
      • Market Share Analysis, 2024
        • By Dosage Form
        • By Services
        • By Company Size
    • UK
      • Pricing Analysis
      • Market Share Analysis, 2024
        • By Dosage Form
        • By Services
        • By Company Size
    • Italy
      • Pricing Analysis
      • Market Share Analysis, 2024
        • By Dosage Form
        • By Services
        • By Company Size
    • Spain
      • Pricing Analysis
      • Market Share Analysis, 2024
        • By Dosage Form
        • By Services
        • By Company Size
    • France
      • Pricing Analysis
      • Market Share Analysis, 2024
        • By Dosage Form
        • By Services
        • By Company Size
    • India
      • Pricing Analysis
      • Market Share Analysis, 2024
        • By Dosage Form
        • By Services
        • By Company Size
    • ASEAN
      • Pricing Analysis
      • Market Share Analysis, 2024
        • By Dosage Form
        • By Services
        • By Company Size
    • Australia & New Zealand
      • Pricing Analysis
      • Market Share Analysis, 2024
        • By Dosage Form
        • By Services
        • By Company Size
    • China
      • Pricing Analysis
      • Market Share Analysis, 2024
        • By Dosage Form
        • By Services
        • By Company Size
    • Japan
      • Pricing Analysis
      • Market Share Analysis, 2024
        • By Dosage Form
        • By Services
        • By Company Size
    • South Korea
      • Pricing Analysis
      • Market Share Analysis, 2024
        • By Dosage Form
        • By Services
        • By Company Size
    • Russia
      • Pricing Analysis
      • Market Share Analysis, 2024
        • By Dosage Form
        • By Services
        • By Company Size
    • Poland
      • Pricing Analysis
      • Market Share Analysis, 2024
        • By Dosage Form
        • By Services
        • By Company Size
    • Hungary
      • Pricing Analysis
      • Market Share Analysis, 2024
        • By Dosage Form
        • By Services
        • By Company Size
    • Kingdom of Saudi Arabia
      • Pricing Analysis
      • Market Share Analysis, 2024
        • By Dosage Form
        • By Services
        • By Company Size
    • Turkiye
      • Pricing Analysis
      • Market Share Analysis, 2024
        • By Dosage Form
        • By Services
        • By Company Size
    • South Africa
      • Pricing Analysis
      • Market Share Analysis, 2024
        • By Dosage Form
        • By Services
        • By Company Size
  18. Market Structure Analysis
    • Competition Dashboard
    • Competition Benchmarking
    • Market Share Analysis of Top Players
      • By Regional
      • By Dosage Form
      • By Services
      • By Company Size
  19. Competition Analysis
    • Competition Deep Dive
      • Catalent
        • Overview
        • Product Portfolio
        • Profitability by Market Segments (Product/Age /Sales Channel/Region)
        • Sales Footprint
        • Strategy Overview
          • Marketing Strategy
          • Product Strategy
          • Channel Strategy
      • Lonza
      • Aenova Group
      • Akums Drugs And Pharmaceutical Ltd.
      • BASF SE
      • Sirio Pharma
      • Pharmavite LLC
      • Nature's Products, Inc.
      • PLT Health Solutions
      • Glanbia Nutritionals
      • Recipharm AB
      • B&D Nutritional Ingredients
      • NutraScience Labs
      • Vitakem Nutraceutical Inc.
      • Softigel (A Division Of Procaps Group)
      • Iprona AG
      • Nutrilo GmbH
      • Atlantic Essential Products, Inc.
      • ProTec Nutra Ltd.
      • Nutraceuticals International Group
  20. Assumptions & Acronyms Used
  21. Research Methodology

List of Tables

  • Table 1: Global Market Value (USD Million) Forecast by Region, 2020-2035
  • Table 2: Global Market Value (USD Million) Forecast by Dosage Form , 2020-2035
  • Table 3: Global Market Value (USD Million) Forecast by Services, 2020-2035
  • Table 4: Global Market Value (USD Million) Forecast by Company Size, 2020-2035
  • Table 5: North America Market Value (USD Million) Forecast by Country, 2020-2035
  • Table 6: North America Market Value (USD Million) Forecast by Dosage Form , 2020-2035
  • Table 7: North America Market Value (USD Million) Forecast by Services, 2020-2035
  • Table 8: North America Market Value (USD Million) Forecast by Company Size, 2020-2035
  • Table 9: Latin America Market Value (USD Million) Forecast by Country, 2020-2035
  • Table 10: Latin America Market Value (USD Million) Forecast by Dosage Form , 2020-2035
  • Table 11: Latin America Market Value (USD Million) Forecast by Services, 2020-2035
  • Table 12: Latin America Market Value (USD Million) Forecast by Company Size, 2020-2035
  • Table 13: Western Europe Market Value (USD Million) Forecast by Country, 2020-2035
  • Table 14: Western Europe Market Value (USD Million) Forecast by Dosage Form , 2020-2035
  • Table 15: Western Europe Market Value (USD Million) Forecast by Services, 2020-2035
  • Table 16: Western Europe Market Value (USD Million) Forecast by Company Size, 2020-2035
  • Table 17: Eastern Europe Market Value (USD Million) Forecast by Country, 2020-2035
  • Table 18: Eastern Europe Market Value (USD Million) Forecast by Dosage Form , 2020-2035
  • Table 19: Eastern Europe Market Value (USD Million) Forecast by Services, 2020-2035
  • Table 20: Eastern Europe Market Value (USD Million) Forecast by Company Size, 2020-2035
  • Table 21: East Asia Market Value (USD Million) Forecast by Country, 2020-2035
  • Table 22: East Asia Market Value (USD Million) Forecast by Dosage Form , 2020-2035
  • Table 23: East Asia Market Value (USD Million) Forecast by Services, 2020-2035
  • Table 24: East Asia Market Value (USD Million) Forecast by Company Size, 2020-2035
  • Table 25: South Asia and Pacific Market Value (USD Million) Forecast by Country, 2020-2035
  • Table 26: South Asia and Pacific Market Value (USD Million) Forecast by Dosage Form , 2020-2035
  • Table 27: South Asia and Pacific Market Value (USD Million) Forecast by Services, 2020-2035
  • Table 28: South Asia and Pacific Market Value (USD Million) Forecast by Company Size, 2020-2035
  • Table 29: Middle East & Africa Market Value (USD Million) Forecast by Country, 2020-2035
  • Table 30: Middle East & Africa Market Value (USD Million) Forecast by Dosage Form , 2020-2035
  • Table 31: Middle East & Africa Market Value (USD Million) Forecast by Services, 2020-2035
  • Table 32: Middle East & Africa Market Value (USD Million) Forecast by Company Size, 2020-2035

List of Figures

  • Figure 1: Global Market Pricing Analysis
  • Figure 2: Global Market Value (USD Million) Forecast 2020-2035
  • Figure 3: Global Market Value Share and BPS Analysis by Dosage Form , 2025 and 2035
  • Figure 4: Global Market Y-o-Y Growth Comparison by Dosage Form , 2025-2035
  • Figure 5: Global Market Attractiveness Analysis by Dosage Form
  • Figure 6: Global Market Value Share and BPS Analysis by Services, 2025 and 2035
  • Figure 7: Global Market Y-o-Y Growth Comparison by Services, 2025-2035
  • Figure 8: Global Market Attractiveness Analysis by Services
  • Figure 9: Global Market Value Share and BPS Analysis by Company Size, 2025 and 2035
  • Figure 10: Global Market Y-o-Y Growth Comparison by Company Size, 2025-2035
  • Figure 11: Global Market Attractiveness Analysis by Company Size
  • Figure 12: Global Market Value (USD Million) Share and BPS Analysis by Region, 2025 and 2035
  • Figure 13: Global Market Y-o-Y Growth Comparison by Region, 2025-2035
  • Figure 14: Global Market Attractiveness Analysis by Region
  • Figure 15: North America Market Incremental Dollar Opportunity, 2025-2035
  • Figure 16: Latin America Market Incremental Dollar Opportunity, 2025-2035
  • Figure 17: Western Europe Market Incremental Dollar Opportunity, 2025-2035
  • Figure 18: Eastern Europe Market Incremental Dollar Opportunity, 2025-2035
  • Figure 19: East Asia Market Incremental Dollar Opportunity, 2025-2035
  • Figure 20: South Asia and Pacific Market Incremental Dollar Opportunity, 2025-2035
  • Figure 21: Middle East & Africa Market Incremental Dollar Opportunity, 2025-2035
  • Figure 22: North America Market Value Share and BPS Analysis by Country, 2025 and 2035
  • Figure 23: North America Market Value Share and BPS Analysis by Dosage Form , 2025 and 2035
  • Figure 24: North America Market Y-o-Y Growth Comparison by Dosage Form , 2025-2035
  • Figure 25: North America Market Attractiveness Analysis by Dosage Form
  • Figure 26: North America Market Value Share and BPS Analysis by Services, 2025 and 2035
  • Figure 27: North America Market Y-o-Y Growth Comparison by Services, 2025-2035
  • Figure 28: North America Market Attractiveness Analysis by Services
  • Figure 29: North America Market Value Share and BPS Analysis by Company Size, 2025 and 2035
  • Figure 30: North America Market Y-o-Y Growth Comparison by Company Size, 2025-2035
  • Figure 31: North America Market Attractiveness Analysis by Company Size
  • Figure 32: Latin America Market Value Share and BPS Analysis by Country, 2025 and 2035
  • Figure 33: Latin America Market Value Share and BPS Analysis by Dosage Form , 2025 and 2035
  • Figure 34: Latin America Market Y-o-Y Growth Comparison by Dosage Form , 2025-2035
  • Figure 35: Latin America Market Attractiveness Analysis by Dosage Form
  • Figure 36: Latin America Market Value Share and BPS Analysis by Services, 2025 and 2035
  • Figure 37: Latin America Market Y-o-Y Growth Comparison by Services, 2025-2035
  • Figure 38: Latin America Market Attractiveness Analysis by Services
  • Figure 39: Latin America Market Value Share and BPS Analysis by Company Size, 2025 and 2035
  • Figure 40: Latin America Market Y-o-Y Growth Comparison by Company Size, 2025-2035
  • Figure 41: Latin America Market Attractiveness Analysis by Company Size
  • Figure 42: Western Europe Market Value Share and BPS Analysis by Country, 2025 and 2035
  • Figure 43: Western Europe Market Value Share and BPS Analysis by Dosage Form , 2025 and 2035
  • Figure 44: Western Europe Market Y-o-Y Growth Comparison by Dosage Form , 2025-2035
  • Figure 45: Western Europe Market Attractiveness Analysis by Dosage Form
  • Figure 46: Western Europe Market Value Share and BPS Analysis by Services, 2025 and 2035
  • Figure 47: Western Europe Market Y-o-Y Growth Comparison by Services, 2025-2035
  • Figure 48: Western Europe Market Attractiveness Analysis by Services
  • Figure 49: Western Europe Market Value Share and BPS Analysis by Company Size, 2025 and 2035
  • Figure 50: Western Europe Market Y-o-Y Growth Comparison by Company Size, 2025-2035
  • Figure 51: Western Europe Market Attractiveness Analysis by Company Size
  • Figure 52: Eastern Europe Market Value Share and BPS Analysis by Country, 2025 and 2035
  • Figure 53: Eastern Europe Market Value Share and BPS Analysis by Dosage Form , 2025 and 2035
  • Figure 54: Eastern Europe Market Y-o-Y Growth Comparison by Dosage Form , 2025-2035
  • Figure 55: Eastern Europe Market Attractiveness Analysis by Dosage Form
  • Figure 56: Eastern Europe Market Value Share and BPS Analysis by Services, 2025 and 2035
  • Figure 57: Eastern Europe Market Y-o-Y Growth Comparison by Services, 2025-2035
  • Figure 58: Eastern Europe Market Attractiveness Analysis by Services
  • Figure 59: Eastern Europe Market Value Share and BPS Analysis by Company Size, 2025 and 2035
  • Figure 60: Eastern Europe Market Y-o-Y Growth Comparison by Company Size, 2025-2035
  • Figure 61: Eastern Europe Market Attractiveness Analysis by Company Size
  • Figure 62: East Asia Market Value Share and BPS Analysis by Country, 2025 and 2035
  • Figure 63: East Asia Market Value Share and BPS Analysis by Dosage Form , 2025 and 2035
  • Figure 64: East Asia Market Y-o-Y Growth Comparison by Dosage Form , 2025-2035
  • Figure 65: East Asia Market Attractiveness Analysis by Dosage Form
  • Figure 66: East Asia Market Value Share and BPS Analysis by Services, 2025 and 2035
  • Figure 67: East Asia Market Y-o-Y Growth Comparison by Services, 2025-2035
  • Figure 68: East Asia Market Attractiveness Analysis by Services
  • Figure 69: East Asia Market Value Share and BPS Analysis by Company Size, 2025 and 2035
  • Figure 70: East Asia Market Y-o-Y Growth Comparison by Company Size, 2025-2035
  • Figure 71: East Asia Market Attractiveness Analysis by Company Size
  • Figure 72: South Asia and Pacific Market Value Share and BPS Analysis by Country, 2025 and 2035
  • Figure 73: South Asia and Pacific Market Value Share and BPS Analysis by Dosage Form , 2025 and 2035
  • Figure 74: South Asia and Pacific Market Y-o-Y Growth Comparison by Dosage Form , 2025-2035
  • Figure 75: South Asia and Pacific Market Attractiveness Analysis by Dosage Form
  • Figure 76: South Asia and Pacific Market Value Share and BPS Analysis by Services, 2025 and 2035
  • Figure 77: South Asia and Pacific Market Y-o-Y Growth Comparison by Services, 2025-2035
  • Figure 78: South Asia and Pacific Market Attractiveness Analysis by Services
  • Figure 79: South Asia and Pacific Market Value Share and BPS Analysis by Company Size, 2025 and 2035
  • Figure 80: South Asia and Pacific Market Y-o-Y Growth Comparison by Company Size, 2025-2035
  • Figure 81: South Asia and Pacific Market Attractiveness Analysis by Company Size
  • Figure 82: Middle East & Africa Market Value Share and BPS Analysis by Country, 2025 and 2035
  • Figure 83: Middle East & Africa Market Value Share and BPS Analysis by Dosage Form , 2025 and 2035
  • Figure 84: Middle East & Africa Market Y-o-Y Growth Comparison by Dosage Form , 2025-2035
  • Figure 85: Middle East & Africa Market Attractiveness Analysis by Dosage Form
  • Figure 86: Middle East & Africa Market Value Share and BPS Analysis by Services, 2025 and 2035
  • Figure 87: Middle East & Africa Market Y-o-Y Growth Comparison by Services, 2025-2035
  • Figure 88: Middle East & Africa Market Attractiveness Analysis by Services
  • Figure 89: Middle East & Africa Market Value Share and BPS Analysis by Company Size, 2025 and 2035
  • Figure 90: Middle East & Africa Market Y-o-Y Growth Comparison by Company Size, 2025-2035
  • Figure 91: Middle East & Africa Market Attractiveness Analysis by Company Size
  • Figure 92: Global Market - Tier Structure Analysis
  • Figure 93: Global Market - Company Share Analysis
Dashboard
Dashboard
Dashboard
Dashboard
Dashboard
Dashboard

Full Research Suite comprises of:

Market outlook & trends analysis

Market outlook & trends analysis

Interviews & case studies

Interviews & case studies

Strategic recommendations

Strategic recommendations

Vendor profiles & capabilities analysis

Vendor profiles & capabilities analysis

5-year forecasts

5-year forecasts

8 regions and 60+ country-level data splits

8 regions and 60+ country-level data splits

Market segment data splits

Market segment data splits

12 months of continuous data updates

12 months of continuous data updates

DELIVERED AS:

PDF EXCEL ONLINE

Full Research Suite


$5000

$7500

$10000

Buy Report Now
Similar Industry Reports

Similar Industry Reports

Nutraceutical Packaging Market

Nutraceutical Packaging Market Size and Share Forecast Outlook 2025 to 2035

Nutraceutical Contract Manufacturing Services Market

Nutraceutical Contract Manufacturing Services Market Size and Share Forecast Outlook 2025 to 2035

Nutraceutical Excipients Market

Nutraceutical Excipients Market Analysis - Size, Share, and Forecast Outlook 2025 to 2035

Nutraceutical Gummies Market

Nutraceutical Gummies Market Analysis - Size, Share, and Forecast 2025 to 2035

Nutraceutical Actives Market

Nutraceutical Actives Market Analysis - Size, Share, and Forecast Outlook 2025 to 2035

Nutraceutical Rigid Packaging Market

Nutraceutical Rigid Packaging Market Analysis - Size, Share, and Forecast Outlook 2025 to 2035

Nutraceuticals Market

Nutraceuticals Market Size, Growth, and Forecast for 2025 to 2035

Nutraceutical Ingredients Market

Nutraceutical Ingredients Market Analysis by Product, Form, Application and Region through 2035

Nutraceutical Packaging Market Share Analysis

Key Companies & Market Share in Nutraceutical Packaging Sector

Nutraceutical Flexible Packaging Market

Nutraceutical Flexible Packaging Market

Halal Nutraceuticals and Vaccines Market

Halal Nutraceuticals and Vaccines Market Growth - Trends & Forecast 2025 to 2035

Marine Nutraceutical Market

Marine Nutraceutical Market Size and Share Forecast Outlook 2025 to 2035

Herbal Nutraceuticals Market

Herbal Nutraceuticals Market Size and Share Forecast Outlook 2025 to 2035

Asia Pacific Nutraceutical Market

Asia Pacific Nutraceutical Market Size and Share Forecast Outlook 2025 to 2035

Middle East and North Africa Nutraceuticals Market

MENA Nutraceuticals Market Trends – Dietary Supplements & Functional Foods

CMO/CDMO Industry Analysis in Brazil

CMO/CDMO Industry Analysis in Brazil Size and Share Forecast Outlook 2025 to 2035

CMO/CDMO Market
CMO/CDMO Market

CMO/CDMO Market Analysis - Size, Share, and Forecast 2025 to 2035

Cosmetic CDMO Market

Global Cosmetic CDMO Market Analysis – Size, Share & Forecast 2024-2034

Inhalation CDMO Market

Inhalation CDMO Market Analysis - Size, Share, and Forecast Outlook 2025 to 2035

Immunoassay CDMO Market

Immunoassay CDMO Market Analysis – Size, Trends & Industry Outlook 2025-2035

Future Market Insights

Nutraceutical CDMO Market

Chat With MaRIA

Chat With

MaRIA

Hi There, I am MaRIA, Your Market Research Intelligence Assistant. How may I help you?