Inhalation CDMO Market Size, Share, and Forecast Outlook 2025 to 2035

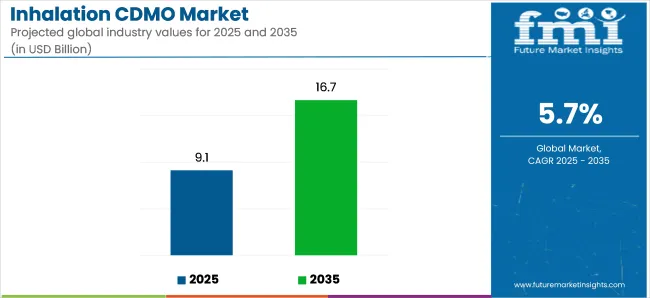
The global inhalation contract development and manufacturing organization (CDMO) market is projected to grow from USD 9.13 billion in 2025 to USD 16.68 billion by 2035, reflecting a compound annual growth rate (CAGR) of 5.7% during the forecast period. This growth is driven by the increasing prevalence of respiratory diseases, advancements in inhalation drug delivery technologies, and the rising demand for outsourced manufacturing services in the pharmaceutical industry.

Recent developments in the inhalation CDMO market highlight significant advancements in drug delivery systems and manufacturing processes. Companies are focusing on enhancing the efficiency and performance of inhalation products, aiming to meet the growing requirements of modern therapies. Innovations in dry powder inhalers (DPIs), metered-dose inhalers (MDIs), and nebulizers are improving drug delivery to the lungs, offering better patient compliance and therapeutic outcomes.

A notable trend in the market is the integration of digital technologies in inhalation devices. The incorporation of sensors and connectivity features in inhalers is enabling real-time monitoring of medication usage, providing valuable data for healthcare providers to optimize treatment plans. This digital transformation is enhancing the overall patient experience and contributing to the growth of the inhalation CDMO market.
Inhalation Cdmo Market
Attributes Key Insights
Estimated Market Size (2025E) USD 9.13 billion
Forecast Market Value (2035F) USD 16.68 billion
Value-based CAGR (2025 to 2035) 5.7%

On July 24, 2024, Catalent expanded its collaboration with De Motu Cordis (DMC) to support the development of DMC‑IH1, an inhaled dry powder epinephrine (DPI) designed for emergency anaphylaxis treatment-as per Catalent’s announcement via Contract Pharma . The extended deal builds on an existing relationship initiated in November 2022, now encompassing large-scale drug product manufacturing and DPI assembly through Catalent’s Boston, Morrisville, and San Diego sites.

DMC CEO Peter O’Neill stated, “We are excited to build on our partnership…to further advance DMC‑IH1,” highlighting Catalent’s role in commercial preparation. This collaboration marks a significant step in inhalation CDMO services, supporting life-saving DPI development through end-to-end capabilities.

The market's growth is also supported by favorable regulatory environments and increasing investments in research and development. Governments and regulatory agencies are providing support for the development of inhalation therapies, recognizing their potential in treating respiratory conditions. Additionally, pharmaceutical companies are investing in the development of new inhalation products, further driving the demand for specialized manufacturing services offered by inhalation CDMOs.

As the inhalation CDMO market continues to evolve, ongoing research and development efforts are expected to lead to the introduction of more specialized and efficient products. These advancements will cater to the diverse needs of healthcare providers and patients, further driving the market's growth and enhancing the quality of care for individuals with respiratory diseases.

Analyzing Inhalation CDMO Market by Top Investment Segments

The global inhalation CDMO (Contract Development and Manufacturing Organization) market is set for significant growth from 2025 to 2035. Key segments contributing to this growth include the commercial scale of operation and formulation development services. These segments are driven by the increasing demand for inhalation therapies. Leading companies like Lonza Group, Catalent, and Recipharm are expanding their capabilities to provide high-quality, scalable inhalation production and development services.

Commercial Segment to Lead the Market with High Demand for Scalable Production

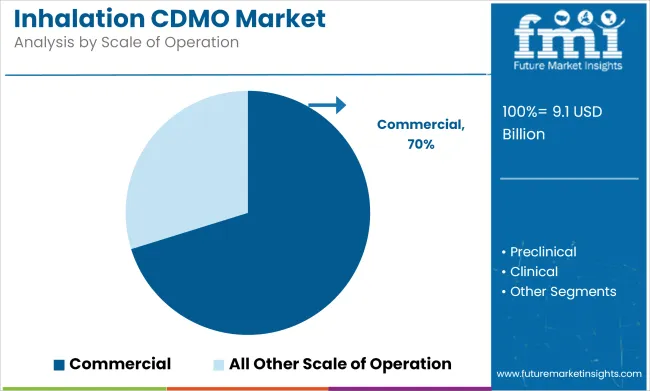
The commercial segment is expected to account for 70.2% of the inhalation CDMO market share in 2025. This growth is driven by the rising demand for large-scale production of inhalation products, which include dry powder inhalers (DPIs), metered dose inhalers (MDIs), and nebulized solutions. As the number of patients with respiratory diseases continues to rise globally, pharmaceutical companies are increasingly turning to CDMOs for efficient, cost-effective, and scalable manufacturing solutions to meet market demand.
Inhalation Cdmo Market Analysis By Scale Of Operation

Key players such as Lonza Group and WuXi AppTec are leading the charge by offering integrated solutions that cover the entire product lifecycle, from drug development to commercial production.

As inhalation therapies, particularly those for chronic diseases, continue to expand in the global healthcare market, the demand for large-scale manufacturing capabilities will drive the commercial segment's growth. Furthermore, regulatory advancements and the increasing adoption of biologics and biosimilars in inhalation products are expected to further support the expansion of this segment.

Formulation Development Segment Poised for Growth with Increasing Focus on Specialized Therapies

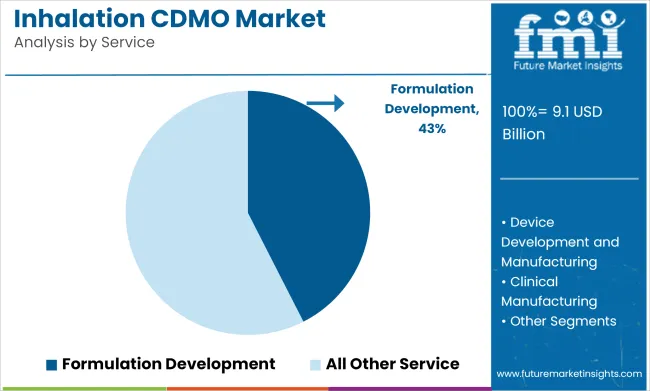
Formulation development is projected to hold 42.5% of the services market share in 2025. This segment is gaining traction as more pharmaceutical companies seek expertise in developing specialized inhalation formulations tailored to the unique delivery requirements of respiratory drugs. Formulation development services encompass the design, testing, and optimization of inhalation drug products, ensuring that they are both effective and deliver the desired therapeutic effects when administered through inhalation devices.
Inhalation Cdmo Market Analysis By Service

The demand for formulation development is driven by the growing complexity of respiratory treatments, particularly for biologics and novel therapies targeting conditions like asthma, COPD, and cystic fibrosis. Companies like Catalent and Recipharm are at the forefront of offering advanced formulation development services that ensure proper drug delivery and patient compliance.

As the inhalation drug market expands and the need for specialized, high-performance formulations increases, the formulation development segment is expected to see continued growth. This trend is particularly evident in the development of complex inhalable biologics and personalized inhalation therapies.

Insights into Lucrative Opportunities Driving Demand for Inhalation CDMO Services

  • The trend toward personalized medicine and targeted therapies is poised to reshape the landscape of inhalation drug development, concurrently driving demand for (CDMO) services.
  • As pharmaceutical research pivots toward tailoring treatments to individual patient profiles, the demand for inhalation drugs customized to specific populations escalates.
  • The rising life expectancy rate is expected to boost the growth of the respiratory inhaler device market due to the high prevalence of COPD among the older population.
  • As healthcare systems become more digitalized, inhaler devices facilitate more efficient communication between patients and healthcare providers. This connectivity fosters a collaborative approach to managing respiratory health, empowering patients to take an active role in their treatment.

Restrictive Factors Limiting Growth in the Inhalation CDMO Market

  • The progression of inhalation drug delivery systems, marked by the integration of advanced technologies, introduces a substantial financial burden for contract development and manufacturing organizations.
  • The inhalation CDMO market confronts a significant hurdle in the form of stringent regulatory requirements and dynamic compliance standards.
  • It can be difficult and expensive to keep up with the latest developments and implement them into industrial processes.
  • Spending on pharmaceuticals and healthcare can be impacted by economic downturns or uncertainties, which could result in a decline in the market for inhalation goods.

Analysis of Top Countries Manufacturing, Certifying, and Utilizing Inhalation CDMO Services

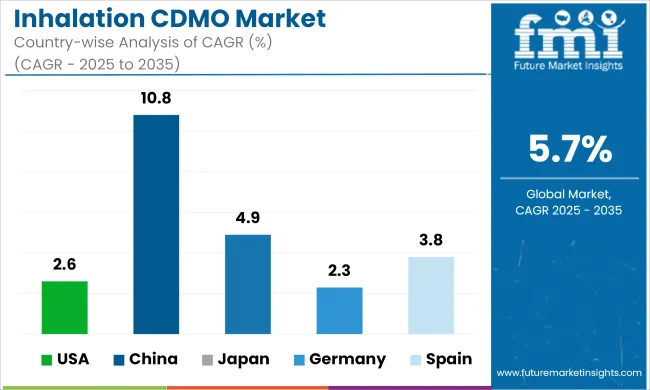
The table below shows the estimated growth rates of the top five countries. China, Japan, and Spain are set to record higher CAGRs of 10.8%, 4.9%, and 3.8%, respectively, through 2035.
Inhalation Cdmo Market Cagr Analysis By Country
Countries Value CAGR (2025 to 2035)
United States 2.6%
China 10.8%
Japan 4.9%
Germany 2.3%
Spain 3.8%

Growing Prevalence of Respiratory Disorders Boosting the United States Market

The United States dominated the global market and held a 33.1% market share in 2024. The United States is expected to exhibit a CAGR of 2.6% throughout the forecast period, driven by factors like:

The high prevalence of respiratory disorders such as asthma and COPD in the United States is a significant driver for the inhalation CDMO market. The demand for innovative inhalation therapies is surging, ultimately driving the growth of CDMOs in the United States.

Rising Demand for Pharmaceuticals to Aid Demand in China

In 2024, China held a dominant share of 7.7% in East Asia’s market. The market is expected to surge with a CAGR of 10.8% from 2025 to 2035. Some of the key drivers/trends include:

China faces a rising prevalence of respiratory disorders, including air pollution-related issues and an increasing number of smokers. This creates a substantial demand for advanced inhalation therapies, presenting an opportunity for CDMOs to cater to the growing healthcare needs in China.

China's pharmaceutical market is rapidly expanding, driven by a rising aging population, increased healthcare awareness, and high disposable income. This growth creates opportunities for CDMOs to collaborate with local and international pharmaceutical companies seeking inhalation drug development services.

Expansion of Pharmaceutical Industry Fueling Demand in Germany

Germany is expected to surge at a CAGR of 2.3% during the forecast period. This can be attributed to factors like:

Germany is a pharmaceutical hub with a strong emphasis on research and development activities. The country's well-established pharmaceutical industry demands specialized CDMOs, particularly those offering inhalation drug development expertise.

Germany's central location in Europe is a strategic base for companies that serve Europe’s pharmaceutical market. Inhalation CDMOs can leverage this location to establish a presence and cater to the diverse needs of the pharmaceutical industry.

Favorable Government Policies and Support to Boost Growth in Japan

Japan is set to surge at a CAGR of 4.9% between 2025 and 2035. Factors driving the market growth include:

In Japan, there is a high frequency of respiratory conditions such as asthma and chronic obstructive pulmonary disease (COPD), which drives up demand for inhalation treatments. As a result, inhalation CDMOs now have the chance to work with pharmaceutical firms to develop and produce respiratory medicinal products.

Japan has a solid pharmaceutical regulation system in place. Operating in Japan, inhalation CDMOs must navigate and abide by the rules established by the Pharmaceuticals and Medical Devices Agency (PMDA). Comprehending and obeying these rules is essential to developing and effectively launching new products in the market.

Japan is renowned for its technological breakthroughs. The country’s inventive research and development in inhalation medication delivery methods and technologies can benefit inhalation CDMOs operating nationwide. Being at the forefront of these developments enables companies to provide their clients with state-of-the-art solutions.

Changing Consumer Preference to Fuel Demand in Spain

Over the forecast period, demand for inhalation CDMO in Spain is expected to rise at a CAGR of 3.8%. This growth projection can be attributed to several key factors:

Spain is a vital country in the global pharmaceuticals market. Spain-based inhalation CDMOs can expand their offerings to serve clients abroad or collaborate with multinational pharmaceutical firms. Incorporating this integration with the global market can yield supplementary growth prospects.

The aging population of Spain is driving up demand for healthcare services and pushing the inhalation CDMO market. The elderly are more likely to suffer from respiratory disorders, which makes effective inhalation therapy necessary. By creating specialized respiratory therapies, inhalation CDMOs can help satisfy these healthcare demands.

For inhalation CDMOs, it is crucial to consider Spain’s market trends and cultural preferences. Inhalable medicine products can succeed more in Spain’s market if their formulations and delivery methods are customized to suit regional tastes and medical standards.

Competitive Landscape of the Inhalation CDMO Market

Collaborations and acquisitions are common growth strategies that leading companies employ in the inhalation CDMO market. They aim to enhance their capabilities, expand their service offerings, and stay competitive in the dynamic landscape.
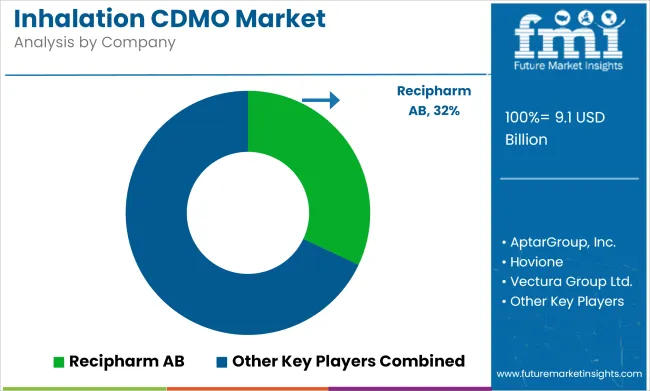
Inhalation Cdmo Market Analysis By Company

For instance

  • In March 2023, Stevanato and Recipharm collaborated to improve soft mist inhalers.
  • In December 2022, Recipharm announced extension of commercial manufacturing to support RedHill Biopharma's Talicia® to 2026.
  • In September 2022, Stevanato Group and Gerresheimer AG collaborated to develop an innovative ready-to-use vial platform for the pharmaceutical industry.

Report Scope Table - Inhalation CDMO Market

Report Attributes Details
Current Total Market Size (2025) USD 9.13 billion
Projected Market Size (2035) USD 16.68 billion
CAGR (2025 to 2035) 5.7%
Base Year for Estimation 2024
Historical Period 2020 to 2024
Projections Period 2025 to 2035
Quantitative Units USD billion for dollar sales
Services Analyzed (Segment 1) Formulation Development, Device Development and Manufacturing, Clinical Manufacturing, Scale-up and Tech Transfer, Quality Control and Quality Assurance, Technology and Innovation, Regulatory Assistance, Analytical Services
Products Analyzed (Segment 2) API, API Substrate, Large Molecule, Small Molecule, Inhalation Platform (Dry Powder Inhaler (DPIs), Metered Dose Inhaler (MDIs), Soft Mist Inhaler)
Company Sizes Analyzed (Segment 3) Large, Medium, Small
Scales of Operation Analyzed (Segment 4) Preclinical, Clinical, Commercial
Regions Covered North America, Latin America, East Asia, South Asia & Pacific, Western Europe, Eastern Europe, Middle East and Africa
Countries Covered United States, Canada, Mexico, Brazil, Argentina, Germany, France, United Kingdom, Italy, Spain, Netherlands, China, India, Japan, South Korea, ANZ, GCC Countries, South Africa
Key Players influencing the Inhalation CDMO Market Recipharm AB, AptarGroup, Inc., Hovione, Vectura Group Ltd., Nemera, Kindeva, H&T Presspart, Sanner GmbH, Stevanato Group, Medspray, ICONOVO AB, Lonza, Gerresheimer AG, Catalent, Patheon N.V. (Thermo Fisher Scientific, Inc.), Lubrizol Life Science, Enteris BioPharma, Cambrex Corporation, INKE, Piramal Pharma Limited, Lupin
Additional Attributes dollar sales, CAGR trends, service segmentation, product type demand, company size distribution, scale of operation trends, competitor dollar sales & market share, regional growth patterns

Top Segments Studied in the Inhalation CDMO Market Report

By Service:

  • Formulation Development
  • Device Development and Manufacturing
  • Clinical Manufacturing
  • Scale-up and Tech Transfer
  • Quality Control and Quality Assurance
  • Technology and Innovation
  • Regulatory Assistance
  • Analytical Services

By Product:

  • API
    • API Substrate
    • Large Molecule
    • Small Molecule
  • Inhalation Platform
    • Dry Powder Inhaler (DPIs)
    • Metered Dose Inhaler (MDIs)
    • Soft Mist Inhaler

By Company Size:

  • Large
  • Medium
  • Small

By Scale of Operation:

  • Preclinical
  • Clinical
  • Commercial

By Region:

  • North America
  • Latin America
  • East Asia
  • South Asia and Pacific
  • Western Europe
  • Eastern Europe
  • Middle East and Africa

Table of Content

  1. Executive Summary
  2. Market Overview
  3. Key Market Trends
  4. Value-Added Insights
  5. Market Background
  6. Global Market Demand (in Value or Size in USD million) Analysis 2020 to 2024 and Forecast, 2025 to 2035
  7. Global Market Analysis 2020 to 2024 and Forecast 2025 to 2035, By Services
    • Formulation Development
    • Device Development and Manufacturing
    • Clinical Manufacturing
    • Scale-up and Tech Transfer
    • Quality Control and Quality Assurance
    • Technology and Innovation
    • Regulatory Assistance
    • Analytical Services
  8. Global Market Analysis 2020 to 2024 and Forecast 2025 to 2035, By Product
    • API
      • API Substrate
      • Large Molecule
      • Small Molecule
    • Inhalation Platform
      • Dry Powder Inhalers (DPIs)
      • Metered Dose Inhalers (MDIs)
      • Soft Mist Inhaler
  9. Global Market Analysis 2020 to 2024 and Forecast 2025 to 2035, By Company Size
    • Large
    • Medium
    • Small
  10. Global Market Analysis 2020 to 2024 and Forecast 2025 to 2035, By Scale of Operation
    • Preclinical
    • Clinical
    • Commercial
  11. Global Market Analysis 2020 to 2024 and Forecast 2025 to 2035, By Region
    • North America
    • Latin America
    • East Asia
    • South Asia & Pacific
    • Western Europe
    • Eastern Europe
    • Middle East and Africa
  12. North America Market Analysis 2020 to 2024 and Forecast 2025 to 2035
  13. Latin America Market Analysis 2020 to 2024 and Forecast 2025 to 2035
  14. East Asia Market Analysis 2020 to 2024 and Forecast 2025 to 2035
  15. South Asia and Pacific Market Analysis 2020 to 2024 and Forecast 2025 to 2035
  16. Western Europe Market Analysis 2020 to 2024 and Forecast 2025 to 2035
  17. Eastern Europe Market Analysis 2020 to 2024 and Forecast 2025 to 2035
  18. Middle East and Africa Market Analysis 2020 to 2024 and Forecast 2025 to 2035
  19. Competition Analysis
    • Recipharm AB
    • AptarGroup, Inc.
    • Hovione
    • Vectura Group Ltd.
    • Nemera
    • Kindeva
    • H&T Presspart
    • Sanner GmbH
    • Stevanato Group
    • Medspray
    • ICONOVO AB
    • Lonza
    • Gerresheimer AG
    • Catalent
    • Patheon N.V. (Thermo Fisher Scientific, Inc.)
    • Lubrizol Life Science
    • Enteris BioPharma
    • Cambrex Corporation
    • INKE
    • Piramal Pharma Limited
    • Lupin
  20. Assumptions and Acronyms Used
  21. Research Methodology

List of Tables

  • Table 1: Global Market Value (US$ million) Analysis 2020 to 2024 and Forecast 2025 to 2035, By Services
  • Table 2: Global Market Value (US$ million) Analysis 2020 to 2024 and Forecast 2025 to 2035, By Product
  • Table 3: Global Market Value (US$ million) Analysis 2020 to 2024 and Forecast 2025 to 2035, By Company Size
  • Table 4: Global Market Value (US$ million) Analysis 2020 to 2024 and Forecast 2025 to 2035, By Scale of Operation
  • Table 5: Global Market Size (US$ million) Analysis 2020 to 2024 and Forecast 2025 to 2035, By Region
  • Table 6: North America Market Value (US$ million) Analysis 2020 to 2024 and Forecast 2025 to 2035, By Country
  • Table 7: North America Market Value (US$ million) Analysis 2020 to 2024 and Forecast 2025 to 2035, By Services
  • Table 8: North America Market Value (US$ million) Analysis 2020 to 2024 and Forecast 2025 to 2035, By Product
  • Table 9: North America Market Value (US$ million) Analysis 2020 to 2024 and Forecast 2025 to 2035, By Company Size
  • Table 10: North America Market Value (US$ million) Analysis 2020 to 2024 and Forecast 2025 to 2035, By Scale of Operation
  • Table 11: United States Market Value (US$ million) Analysis 2020 to 2024 and Forecast 2025 to 2035, By Services
  • Table 12: United States Market Value (US$ million) Analysis 2020 to 2024 and Forecast 2025 to 2035, By Product
  • Table 13: United States Market Value (US$ million) Analysis 2020 to 2024 and Forecast 2025 to 2035, By Company Size
  • Table 14: United States Market Value (US$ million) Analysis 2020 to 2024 and Forecast 2025 to 2035, By Scale of Operation
  • Table 15: Canada Market Value (US$ million) Analysis 2020 to 2024 and Forecast 2025 to 2035, By Services
  • Table 16: Canada Market Value (US$ million) Analysis 2020 to 2024 and Forecast 2025 to 2035, By Product
  • Table 17: Canada Market Value (US$ million) Analysis 2020 to 2024 and Forecast 2025 to 2035, By Company Size
  • Table 18: Canada Market Value (US$ million) Analysis 2020 to 2024 and Forecast 2025 to 2035, By Scale of Operation
  • Table 19: Mexico Market Value (US$ million) Analysis 2020 to 2024 and Forecast 2025 to 2035, By Services
  • Table 20: Mexico Market Value (US$ million) Analysis 2020 to 2024 and Forecast 2025 to 2035, By Product
  • Table 21: Mexico Market Value (US$ million) Analysis 2020 to 2024 and Forecast 2025 to 2035, By Company Size
  • Table 22: Mexico Market Value (US$ million) Analysis 2020 to 2024 and Forecast 2025 to 2035, By Scale of Operation
  • Table 23: Latin America Market Value (US$ million) Analysis 2020 to 2024 and Forecast 2025 to 2035, By Country
  • Table 24: Latin America Market Value (US$ million) Analysis 2020 to 2024 and Forecast 2025 to 2035, By Services
  • Table 25: Latin America Market Value (US$ million) Analysis 2020 to 2024 and Forecast 2025 to 2035, By Product
  • Table 26: Latin America Market Value (US$ million) Analysis 2020 to 2024 and Forecast 2025 to 2035, By Company Size
  • Table 27: Latin America Market Value (US$ million) Analysis 2020 to 2024 and Forecast 2025 to 2035, By Scale of Operation
  • Table 28: Brazil Market Value (US$ million) Analysis 2020 to 2024 and Forecast 2025 to 2035, By Services
  • Table 29: Brazil Market Value (US$ million) Analysis 2020 to 2024 and Forecast 2025 to 2035, By Product
  • Table 30: Brazil Market Value (US$ million) Analysis 2020 to 2024 and Forecast 2025 to 2035, By Company Size
  • Table 31: Brazil Market Value (US$ million) Analysis 2020 to 2024 and Forecast 2025 to 2035, By Scale of Operation
  • Table 32: Chile Market Value (US$ million) Analysis 2020 to 2024 and Forecast 2025 to 2035, By Services
  • Table 33: Chile Market Value (US$ million) Analysis 2020 to 2024 and Forecast 2025 to 2035, By Product
  • Table 34: Chile Market Value (US$ million) Analysis 2020 to 2024 and Forecast 2025 to 2035, By Company Size
  • Table 35: Chile Market Value (US$ million) Analysis 2020 to 2024 and Forecast 2025 to 2035, By Scale of Operation
  • Table 36: East Asia Market Value (US$ million) Analysis 2020 to 2024 and Forecast 2025 to 2035, By Country
  • Table 37: East Asia Market Value (US$ million) Analysis 2020 to 2024 and Forecast 2025 to 2035, By Services
  • Table 38: East Asia Market Value (US$ million) Analysis 2020 to 2024 and Forecast 2025 to 2035, By Product
  • Table 39: East Asia Market Value (US$ million) Analysis 2020 to 2024 and Forecast 2025 to 2035, By Company Size
  • Table 40: East Asia Market Value (US$ million) Analysis 2020 to 2024 and Forecast 2025 to 2035, By Scale of Operation
  • Table 41: China Market Value (US$ million) Analysis 2020 to 2024 and Forecast 2025 to 2035, By Services
  • Table 42: China Market Value (US$ million) Analysis 2020 to 2024 and Forecast 2025 to 2035, By Product
  • Table 43: China Market Value (US$ million) Analysis 2020 to 2024 and Forecast 2025 to 2035, By Company Size
  • Table 44: China Market Value (US$ million) Analysis 2020 to 2024 and Forecast 2025 to 2035, By Scale of Operation
  • Table 45: Japan Market Value (US$ million) Analysis 2020 to 2024 and Forecast 2025 to 2035, By Services
  • Table 46: Japan Market Value (US$ million) Analysis 2020 to 2024 and Forecast 2025 to 2035, By Product
  • Table 47: Japan Market Value (US$ million) Analysis 2020 to 2024 and Forecast 2025 to 2035, By Company Size
  • Table 48: Japan Market Value (US$ million) Analysis 2020 to 2024 and Forecast 2025 to 2035, By Scale of Operation
  • Table 49: South Korea Market Value (US$ million) Analysis 2020 to 2024 and Forecast 2025 to 2035, By Services
  • Table 50: South Korea Market Value (US$ million) Analysis 2020 to 2024 and Forecast 2025 to 2035, By Product
  • Table 51: South Korea Market Value (US$ million) Analysis 2020 to 2024 and Forecast 2025 to 2035, By Company Size
  • Table 52: South Korea Market Value (US$ million) Analysis 2020 to 2024 and Forecast 2025 to 2035, By Scale of Operation
  • Table 53: South Asia & Pacific Market Value (US$ million) Analysis 2020 to 2024 and Forecast 2025 to 2035, By Country
  • Table 54: South Asia & Pacific Market Value (US$ million) Analysis 2020 to 2024 and Forecast 2025 to 2035, By Services
  • Table 55: South Asia & Pacific Market Value (US$ million) Analysis 2020 to 2024 and Forecast 2025 to 2035, By Product
  • Table 56: South Asia & Pacific Market Value (US$ million) Analysis 2020 to 2024 and Forecast 2025 to 2035, By Company Size
  • Table 57: South Asia & Pacific Market Value (US$ million) Analysis 2020 to 2024 and Forecast 2025 to 2035, By Scale of Operation
  • Table 58: India Market Value (US$ million) Analysis 2020 to 2024 and Forecast 2025 to 2035, By Services
  • Table 59: India Market Value (US$ million) Analysis 2020 to 2024 and Forecast 2025 to 2035, By Product
  • Table 60: India Market Value (US$ million) Analysis 2020 to 2024 and Forecast 2025 to 2035, By Company Size
  • Table 61: India Market Value (US$ million) Analysis 2020 to 2024 and Forecast 2025 to 2035, By Scale of Operation
  • Table 62: ASEAN Countries Market Value (US$ million) Analysis 2020 to 2024 and Forecast 2025 to 2035, By Services
  • Table 63: ASEAN Countries Market Value (US$ million) Analysis 2020 to 2024 and Forecast 2025 to 2035, By Product
  • Table 64: ASEAN Countries Market Value (US$ million) Analysis 2020 to 2024 and Forecast 2025 to 2035, By Company Size
  • Table 65: ASEAN Countries Market Value (US$ million) Analysis 2020 to 2024 and Forecast 2025 to 2035, By Scale of Operation
  • Table 66: Australia & New Zealand Market Value (US$ million) Analysis 2020 to 2024 and Forecast 2025 to 2035, By Services
  • Table 67: Australia & New Zealand Market Value (US$ million) Analysis 2020 to 2024 and Forecast 2025 to 2035, By Product
  • Table 68: Australia & New Zealand Market Value (US$ million) Analysis 2020 to 2024 and Forecast 2025 to 2035, By Company Size
  • Table 69: Australia & New Zealand Market Value (US$ million) Analysis 2020 to 2024 and Forecast 2025 to 2035, By Scale of Operation
  • Table 70: Western Europe Market Value (US$ million) Analysis 2020 to 2024 and Forecast 2025 to 2035, By Country
  • Table 71: Western Europe Market Value (US$ million) Analysis 2020 to 2024 and Forecast 2025 to 2035, By Services
  • Table 72: Western Europe Respiratory Inhaler Devices Volume (Units) Analysis 2020 to 2024 and Forecast 2025 to 2035, By Services
  • Table 73: Western Europe Market Value (US$ million) Analysis 2020 to 2024 and Forecast 2025 to 2035, By Product
  • Table 74: Western Europe Market Value (US$ million) Analysis 2020 to 2024 and Forecast 2025 to 2035, By Company Size
  • Table 75: Western Europe Market Value (US$ million) Analysis 2020 to 2024 and Forecast 2025 to 2035, By Scale of Operation
  • Table 76: Germany Market Value (US$ million) Analysis 2020 to 2024 and Forecast 2025 to 2035, By Services
  • Table 77: Germany Market Value (US$ million) Analysis 2020 to 2024 and Forecast 2025 to 2035, By Product
  • Table 78: Germany Market Value (US$ million) Analysis 2020 to 2024 and Forecast 2025 to 2035, By Company Size
  • Table 79: Germany Market Value (US$ million) Analysis 2020 to 2024 and Forecast 2025 to 2035, By Scale of Operation
  • Table 80: Italy Market Value (US$ million) Analysis 2020 to 2024 and Forecast 2025 to 2035, By Services
  • Table 81: Italy Market Value (US$ million) Analysis 2020 to 2024 and Forecast 2025 to 2035, By Product
  • Table 82: Italy Market Value (US$ million) Analysis 2020 to 2024 and Forecast 2025 to 2035, By Company Size
  • Table 83: Italy Market Value (US$ million) Analysis 2020 to 2024 and Forecast 2025 to 2035, By Scale of Operation
  • Table 84: France Market Value (US$ million) Analysis 2020 to 2024 and Forecast 2025 to 2035, By Services
  • Table 85: France Market Value (US$ million) Analysis 2020 to 2024 and Forecast 2025 to 2035, By Product
  • Table 86: France Market Value (US$ million) Analysis 2020 to 2024 and Forecast 2025 to 2035, By Company Size
  • Table 87: France Market Value (US$ million) Analysis 2020 to 2024 and Forecast 2025 to 2035, By Scale of Operation
  • Table 88: United Kingdom Market Value (US$ million) Analysis 2020 to 2024 and Forecast 2025 to 2035, By Services
  • Table 89: United Kingdom Market Value (US$ million) Analysis 2020 to 2024 and Forecast 2025 to 2035, By Product
  • Table 90: United Kingdom Market Value (US$ million) Analysis 2020 to 2024 and Forecast 2025 to 2035, By Company Size
  • Table 91: United Kingdom Market Value (US$ million) Analysis 2020 to 2024 and Forecast 2025 to 2035, By Scale of Operation
  • Table 92: Spain Market Value (US$ million) Analysis 2020 to 2024 and Forecast 2025 to 2035, By Services
  • Table 93: Spain Market Value (US$ million) Analysis 2020 to 2024 and Forecast 2025 to 2035, By Product
  • Table 94: Spain Market Value (US$ million) Analysis 2020 to 2024 and Forecast 2025 to 2035, By Company Size
  • Table 95: Spain Market Value (US$ million) Analysis 2020 to 2024 and Forecast 2025 to 2035, By Scale of Operation
  • Table 96: BENELUX Market Value (US$ million) Analysis 2020 to 2024 and Forecast 2025 to 2035, By Services
  • Table 97: BENELUX Market Value (US$ million) Analysis 2020 to 2024 and Forecast 2025 to 2035, By Product
  • Table 98: BENELUX Market Value (US$ million) Analysis 2020 to 2024 and Forecast 2025 to 2035, By Company Size
  • Table 99: BENELUX Market Value (US$ million) Analysis 2020 to 2024 and Forecast 2025 to 2035, By Scale of Operation
  • Table 100: Nordic Countries Market Value (US$ million) Analysis 2020 to 2024 and Forecast 2025 to 2035, By Services
  • Table 101: Nordic Countries Market Value (US$ million) Analysis 2020 to 2024 and Forecast 2025 to 2035, By Product
  • Table 102: Nordic Countries Market Value (US$ million) Analysis 2020 to 2024 and Forecast 2025 to 2035, By Company Size
  • Table 103: Nordic Countries Market Value (US$ million) Analysis 2020 to 2024 and Forecast 2025 to 2035, By Scale of Operation
  • Table 104: Eastern Europe Market Value (US$ million) Analysis 2020 to 2024 and Forecast 2025 to 2035, By Country
  • Table 105: Eastern Europe Market Value (US$ million) Analysis 2020 to 2024 and Forecast 2025 to 2035, By Services
  • Table 106: Eastern Europe Market Value (US$ million) Analysis 2020 to 2024 and Forecast 2025 to 2035, By Product
  • Table 107: Eastern Europe Market Value (US$ million) Analysis 2020 to 2024 and Forecast 2025 to 2035, By Company Size
  • Table 108: Eastern Europe Market Value (US$ million) Analysis 2020 to 2024 and Forecast 2025 to 2035, By Scale of Operation
  • Table 109: Russia Market Value (US$ million) Analysis 2020 to 2024 and Forecast 2025 to 2035, By Services
  • Table 110: Russia Market Value (US$ million) Analysis 2020 to 2024 and Forecast 2025 to 2035, By Product
  • Table 111: Russia Market Value (US$ million) Analysis 2020 to 2024 and Forecast 2025 to 2035, By Company Size
  • Table 112: Russia Market Value (US$ million) Analysis 2020 to 2024 and Forecast 2025 to 2035, By Scale of Operation
  • Table 113: Hungary Market Value (US$ million) Analysis 2020 to 2024 and Forecast 2025 to 2035, By Services
  • Table 114: Hungary Market Value (US$ million) Analysis 2020 to 2024 and Forecast 2025 to 2035, By Product
  • Table 115: Hungary Market Value (US$ million) Analysis 2020 to 2024 and Forecast 2025 to 2035, By Company Size
  • Table 116: Hungary Market Value (US$ million) Analysis 2020 to 2024 and Forecast 2025 to 2035, By Scale of Operation
  • Table 117: Poland Market Value (US$ million) Analysis 2020 to 2024 and Forecast 2025 to 2035, By Services
  • Table 118: Poland Market Value (US$ million) Analysis 2020 to 2024 and Forecast 2025 to 2035, By Product
  • Table 119: Poland Market Value (US$ million) Analysis 2020 to 2024 and Forecast 2025 to 2035, By Company Size
  • Table 120: Poland Market Value (US$ million) Analysis 2020 to 2024 and Forecast 2025 to 2035, By Scale of Operation
  • Table 121: Middle East & Africa Market Value (US$ million) Analysis 2020 to 2024 and Forecast 2025 to 2035, By Country
  • Table 122: Middle East & Africa Market Value (US$ million) Analysis 2020 to 2024 and Forecast 2025 to 2035, By Services
  • Table 123: Middle East & Africa Market Value (US$ million) Analysis 2020 to 2024 and Forecast 2025 to 2035, By Product
  • Table 124: Middle East & Africa Market Value (US$ million) Analysis 2020 to 2024 and Forecast 2025 to 2035, By Company Size
  • Table 125: Middle East & Africa Market Value (US$ million) Analysis 2020 to 2024 and Forecast 2025 to 2035, By Scale of Operation
  • Table 126: Saudi Arabia Market Value (US$ million) Analysis 2020 to 2024 and Forecast 2025 to 2035, By Services
  • Table 127: Saudi Arabia Market Value (US$ million) Analysis 2020 to 2024 and Forecast 2025 to 2035, By Product
  • Table 128: Saudi Arabia Market Value (US$ million) Analysis 2020 to 2024 and Forecast 2025 to 2035, By Company Size
  • Table 129: Saudi Arabia Market Value (US$ million) Analysis 2020 to 2024 and Forecast 2025 to 2035, By Scale of Operation
  • Table 130: Turkiye Market Value (US$ million) Analysis 2020 to 2024 and Forecast 2025 to 2035, By Services
  • Table 131: Turkiye Market Value (US$ million) Analysis 2020 to 2024 and Forecast 2025 to 2035, By Product
  • Table 132: Turkiye Market Value (US$ million) Analysis 2020 to 2024 and Forecast 2025 to 2035, By Company Size
  • Table 133: Turkiye Market Value (US$ million) Analysis 2020 to 2024 and Forecast 2025 to 2035, By Scale of Operation
  • Table 134: South Africa Market Value (US$ million) Analysis 2020 to 2024 and Forecast 2025 to 2035, By Services
  • Table 135: South Africa Market Value (US$ million) Analysis 2020 to 2024 and Forecast 2025 to 2035, By Product
  • Table 136: South Africa Market Value (US$ million) Analysis 2020 to 2024 and Forecast 2025 to 2035, By Company Size
  • Table 137: South Africa Market Value (US$ million) Analysis 2020 to 2024 and Forecast 2025 to 2035, By Scale of Operation
  • Table 138: Other African Union Market Value (US$ million) Analysis 2020 to 2024 and Forecast 2025 to 2035, By Services
  • Table 139: Other African Union Market Value (US$ million) Analysis 2020 to 2024 and Forecast 2025 to 2035, By Product
  • Table 140: Other African Union Market Value (US$ million) Analysis 2020 to 2024 and Forecast 2025 to 2035, By Company Size
  • Table 141: Other African Union Market Value (US$ million) Analysis 2020 to 2024 and Forecast 2025 to 2035, By Scale of Operation

List of Figures

  • Figure 1: Global Market Value Share By Services 2023 (A)
  • Figure 2: Global Market Value Share By Product 2023 (A)
  • Figure 3: Global Market Value Share By Company Size 2023 (A)
  • Figure 4: Global Market Value Share By Scale of Operation 2023 (A)
  • Figure 5: Global Market Value Share By Country 2023 (A)
  • Figure 6: Global Market Value Analysis (US$ million), 2020 to 2024
  • Figure 7: Global Market Value Forecast (US$ million), 2025 to 2035
  • Figure 8: Global Market Absolute $ Opportunity, 2025 to 2035
  • Figure 9: Global Market Share Analysis (%), By Services, 2024 (E) to 2034 (F)
  • Figure 10: Global Market Y-o-Y Analysis (%), By Services, 2025 to 2035
  • Figure 11: Global Market Attractiveness Analysis, By Services
  • Figure 12: Global Market Share Analysis (%), By Product, 2024 (E) to 2034 (F)
  • Figure 13: Global Market Y-o-Y Analysis (%), By Product, 2025 to 2035
  • Figure 14: Global Market Attractiveness Analysis, By Product
  • Figure 15: Global Market Share Analysis (%), By Company Size, 2024 (E) to 2034 (F)
  • Figure 16: Global Market Y-o-Y Analysis (%), By Company Size, 2025 to 2035
  • Figure 17: Global Market Attractiveness Analysis, By Company Size
  • Figure 18: Global Market Share Analysis (%), By Scale of Operation, 2024 (E) to 2034 (F)
  • Figure 19: Global Market Y-o-Y Analysis (%), By Scale of Operation, 2025 to 2035
  • Figure 20: Global Market Attractiveness Analysis, By Scale of Operation
  • Figure 21: Global Market Share Analysis (%), By Region, 2024 (E) to 2034 (F)
  • Figure 22: Global Market Y-o-Y Analysis (%), By Region, 2025 to 2035
  • Figure 23: Global Market Attractiveness Analysis By Region, 2025 to 2035
  • Figure 24: North America Market Value Share By Services 2023 (A)
  • Figure 25: North America Market Value Share By Product 2023 (A)
  • Figure 26: North America Market Value Share By Company Size 2023 (A)
  • Figure 27: North America Market Value Share By Scale of Operation 2023 (A)
  • Figure 28: North America Market Value Share By Country 2023 (A)
  • Figure 29: North America Market Value (US$ million) Analysis, 2020 to 2024
  • Figure 30: North America Market Forecast & Y-o-Y growth, 2025 to 2035
  • Figure 31: North America Market Attractiveness Analysis By Services, 2025 to 2035
  • Figure 32: North America Market Attractiveness Analysis By Product, 2025 to 2035
  • Figure 33: North America Market Attractiveness Analysis By Company Size, 2025 to 2035
  • Figure 34: North America Market Attractiveness Analysis By Scale of Operation, 2025 to 2035
  • Figure 35: North America Market Attractiveness Analysis By Country, 2025 to 2035
  • Figure 36: Latin America Market Value Share By Services 2023 (A)
  • Figure 37: Latin America Market Value Share By Product 2023 (A)
  • Figure 38: Latin America Market Value Share By Company Size 2023 (A)
  • Figure 39: Latin America Market Value Share By Scale of Operation 2023 (A)
  • Figure 40: Latin America Market Value Share By Country 2023 (A)
  • Figure 41: Latin America Market Value (US$ million) Analysis, 2020 to 2024
  • Figure 42: Latin America Market Forecast & Y-o-Y growth, 2025 to 2035
  • Figure 43: Latin America Market Attractiveness Analysis By Services, 2025 to 2035
  • Figure 44: Latin America Market Attractiveness Analysis By Product, 2025 to 2035
  • Figure 45: Latin America Market Attractiveness Analysis By Company Size, 2025 to 2035
  • Figure 46: Latin America Market Attractiveness Analysis By Scale of Operation, 2025 to 2035
  • Figure 47: Latin America Market Attractiveness Analysis By Country, 2025 to 2035
  • Figure 48: East Asia Market Value Share By Services 2023 (A)
  • Figure 49: East Asia Market Value Share By Product 2023 (A)
  • Figure 50: East Asia Market Value Share By Company Size 2023 (A)
  • Figure 51: East Asia Market Value Share By Scale of Operation 2023 (A)
  • Figure 52: East Asia Market Value Share By Country 2023 (A)
  • Figure 53: East Asia Market Value (US$ million) Analysis, 2020 to 2024
  • Figure 54: East Asia Market Forecast & Y-o-Y growth, 2025 to 2035
  • Figure 55: East Asia Market Attractiveness Analysis By Services, 2025 to 2035
  • Figure 56: East Asia Market Attractiveness Analysis By Product, 2025 to 2035
  • Figure 57: East Asia Market Attractiveness Analysis By Company Size, 2025 to 2035
  • Figure 58: East Asia Market Attractiveness Analysis By Scale of Operation, 2025 to 2035
  • Figure 59: East Asia Market Attractiveness Analysis By Country, 2025 to 2035
  • Figure 60: South Asia & Pacific Market Value Share By Services 2023 (A)
  • Figure 61: South Asia & Pacific Market Value Share By Product 2023 (A)
  • Figure 62: South Asia & Pacific Market Value Share By Company Size 2023 (A)
  • Figure 63: South Asia & Pacific Market Value Share By Scale of Operation 2023 (A)
  • Figure 64: South Asia & Pacific Market Value Share By Country 2023 (A)
  • Figure 65: South Asia & Pacific Market Value (US$ million) Analysis, 2020 to 2024
  • Figure 66: South Asia & Pacific Market Forecast & Y-o-Y growth, 2025 to 2035
  • Figure 67: South Asia & Pacific Market Attractiveness Analysis By Services, 2025 to 2035
  • Figure 68: South Asia & Pacific Market Attractiveness Analysis By Product, 2025 to 2035
  • Figure 69: South Asia & Pacific Market Attractiveness Analysis By Company Size, 2025 to 2035
  • Figure 70: South Asia & Pacific Market Attractiveness Analysis By Scale of Operation, 2025 to 2035
  • Figure 71: South Asia & Pacific Market Attractiveness Analysis By Country, 2025 to 2035
  • Figure 72: Western Europe Market Value Share By Services 2023 (A)
  • Figure 73: Western Europe Market Value Share By Product 2023 (A)
  • Figure 74: Western Europe Market Value Share By Company Size 2023 (A)
  • Figure 75: Western Europe Market Value Share By Scale of Operation 2023 (A)
  • Figure 76: Western Europe Market Value Share By Country 2023 (A)
  • Figure 77: Western Europe Market Value (US$ million) Analysis, 2020 to 2024
  • Figure 78: Western Europe Market Forecast & Y-o-Y growth, 2025 to 2035
  • Figure 79: Western Europe Market Attractiveness Analysis By Services, 2025 to 2035
  • Figure 80: Western Europe Market Attractiveness Analysis By Product, 2025 to 2035
  • Figure 81: Western Europe Market Attractiveness Analysis By Company Size, 2025 to 2035
  • Figure 82: Western Europe Market Attractiveness Analysis By Scale of Operation, 2025 to 2035
  • Figure 83: Western Europe Market Attractiveness Analysis By Country, 2025 to 2035
  • Figure 84: Eastern Europe Market Value Share By Services 2023 (A)
  • Figure 85: Eastern Europe Market Value Share By Product 2023 (A)
  • Figure 86: Eastern Europe Market Value Share By Company Size 2023 (A)
  • Figure 87: Eastern Europe Market Value Share By Scale of Operation 2023 (A)
  • Figure 88: Eastern Europe Market Value Share By Country 2023 (A)
  • Figure 89: Eastern Europe Market Value (US$ million) Analysis, 2020 to 2024
  • Figure 90: Eastern Europe Market Forecast & Y-o-Y growth, 2025 to 2035
  • Figure 91: Eastern Europe Market Attractiveness Analysis By Services, 2025 to 2035
  • Figure 92: Eastern Europe Market Attractiveness Analysis By Product, 2025 to 2035
  • Figure 93: Eastern Europe Market Attractiveness Analysis By Company Size, 2025 to 2035
  • Figure 94: Eastern Europe Market Attractiveness Analysis By Scale of Operation, 2025 to 2035
  • Figure 95: Eastern Europe Market Attractiveness Analysis By Country, 2025 to 2035
  • Figure 96: Middle East & Africa Market Value Share By Services 2023 (A)
  • Figure 97: Middle East & Africa Market Value Share By Product 2023 (A)
  • Figure 98: Middle East & Africa Market Value Share By Company Size 2023 (A)
  • Figure 99: Middle East & Africa Market Value Share By Scale of Operation 2023 (A)
  • Figure 100: Middle East & Africa Market Value Share By Country 2023 (A)
  • Figure 101: Middle East & Africa Market Value (US$ million) Analysis, 2020 to 2024
  • Figure 102: Middle East & Africa Market Forecast & Y-o-Y growth, 2025 to 2035
  • Figure 103: Middle East & Africa Market Attractiveness Analysis By Services, 2025 to 2035
  • Figure 104: Middle East & Africa Market Attractiveness Analysis By Product, 2025 to 2035
  • Figure 105: Middle East & Africa Market Attractiveness Analysis By Company Size, 2025 to 2035
  • Figure 106: Middle East & Africa Market Attractiveness Analysis By Scale of Operation, 2025 to 2035
  • Figure 107: Middle East & Africa Market Attractiveness Analysis By Country, 2025 to 2035

Frequently Asked Questions

How big is the inhalation CDMO market?

The global market was valued at USD 8.90 billion in 2024.

What is the global market’s projected value for 2035?

The market is set to reach a valuation of USD 16.68 billion by 2035.

What was the last 4 years’ CAGR for the global market?

Demand for inhalation CDMO increased at a 5.7% CAGR from 2020 to 2024.

What will be the market size of CDMO by 2025?

The global market is projected to reach USD 9.13 billion by 2025.

What is the United States market outlook?

The United States accounted for a 33.1% share of the global market in 2024.

What is Germany’s market outlook?

Germany held around 2.3% market share in 2024.

Explore Similar Insights

Future Market Insights

Inhalation CDMO Market