Reports

- Global Locations -

Headquarters

Future Market Insights, Inc.

Christiana Corporate, 200
Continental Drive, Suite 401,
Newark, Delaware - 19713,
United States

T: +1-845-579-5705

Americas

Future Market Insights, Inc.

616 Corporate Way, Suite 2-9018,
Valley Cottage, NY 10989, United States

T: +1-347-918-3531

MEA

Future Market Insights

1602-6 Jumeirah Bay X2 Tower, Plot No: JLT-PH2-X2A,
Jumeirah Lakes Towers, Dubai,
United Arab Emirates

Europe

Future Market Insights

3rd Floor, 207 Regent Street,
W1B 3HH London
United Kingdom

T: + 44 (0) 20 8123 9659
D: +44 (0) 20 3287 4268

Asia Pacific

Future Market Insights

IndiaLand Global Tech Park, Unit UG-1, Behind Grand HighStreet, Phase 1, Hinjawadi, MH, Pune – 411057, India

Brazil CMO/CDMO Business Outlook from 2023 to 2033

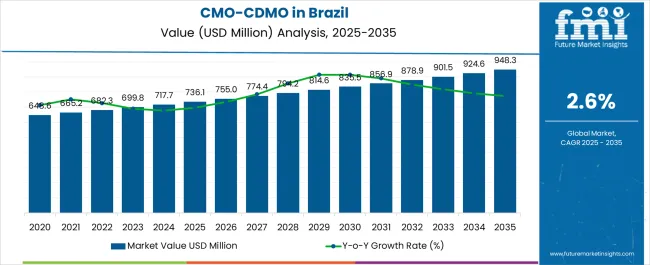
The Brazil CMO/CDMO ecosystem is expected to surge at a CAGR of 2.7% in the forecast period 2023 to 2033. Its value is projected to increase from US$ 697.93 million in 2023 to US$ 907.67 million by 2033. The Brazil CMO/CDMO business was valued at US$ 679.10 million at the end of 2022 and is anticipated to exhibit a y-o-y growth of 2.8 % in 2023.

Attributes Key Insights
Brazil CMO/CDMO Business Size (2022A) US$ 679.10 million
Brazil CMO/CDMO Business Estimated Revenue (2023E) US$ 697.93 million
Brazil CMO/CDMO Business Projected Revenue (2033F) US$ 907.67 million
Value-based CAGR (2023 to 2033) 2.7%

Brazil is projected to be one of the most prominent pharmaceutical sectors in Latin America. The surging aging population, rising healthcare costs, and increased public knowledge of healthcare have all contributed to a steady increase in the demand for pharmaceuticals in Brazil.

The government of Brazil has implemented stringent rules to promote regional pharmaceutical production. This includes policies, including tax breaks and privileges for domestically produced goods.

The Brazil CMO/CDMO business has placed a substantial emphasis on the manufacturing of biologics and biosimilars. These sophisticated treatments frequently call for specialist production skills.

For contract manufacturing organizations (CMOs) and contract development and manufacturing organizations (CDMOs) operating in Brazil, compliance with international quality standards, such as Good Manufacturing Practices (GMP), is essential. Both domestic and international sales depend on compliance with regulatory regulations.

Biotech and pharmaceutical companies in Brazil are increasingly using CMOs and CDMOs to handle their manufacturing requirements. The necessity for flexible production capacity, access to specialist knowledge, and cost-effectiveness are a handful of the driving forces behind this outsourcing trend.

CMO/CDMO companies are set to offer manufacturing services to the biotechnology, pharmaceutical, and other industries, as well as help with the production of medical equipment. CMOs are also expected to provide their resources, knowledge, and facilities to make goods for their customers.

The CMO and CDMO sector has seen rapid expansion in recent years. The pharmaceutical and biotechnology industries have seen a rise in the outsourcing of production and development services owing to the advantages of cost savings, flexibility, and access to specialized knowledge.

Don't pay for what you don't need

Customize your report by selecting specific countries or regions and save 30%!

2018 to 2022 Brazil CMO/CDMO Space Analysis Vs. 2023 to 2033 Forecast

The Brazil CMO/CDMO business recorded a decent CAGR of 2.0% in the historical period from 2018 to 2022. The value for the CMO/CDMO business in Brazil was around 1.2% of the total US$ 56,660.60 million of the global CMO/CDMO business.

The growing pharmaceutical sector is the main factor spurring the Brazil CMO/CDMO business landscape. Increasing approval of manufacturing facilities is set to drive growth.

The total production capacity in Brazil rises as more manufacturing facilities are approved. The increased demand for outsourcing services would enable CMOs and CDMOs to take on additional clients and projects.

The approval of multiple manufacturing facilities, such as those for sterile injectables, biologics, or specialized formulations, can increase the variety of services provided by CMOs and CDMOs. Due to this variety, pharmaceutical companies can select partners who meet their particular requirements.

  • For instance, in August 2023, Granules India Limited achieved approval from the Brazilian Health Regulatory Agency (ANVISA) for its Bonthapally facility, located in Bonthapally Village, in recognition of its compliance with Good Manufacturing Practices guidelines.

Manufacturing facilities would become more competitive in the global business landscape as they receive approval. CMOs/CDMOs that can show compliance with international regulatory standards would draw clients from other nations looking for dependable manufacturing partners in addition to Brazil.

The Brazil CMO/CDMO ecosystem has begun to place a lot of emphasis on the manufacturing of biologics and biosimilars. The complexity of these products frequently necessitates specialized production capabilities, and this business category has seen tremendous expansion.

The government of Brazil has also started several programs to encourage expansion in the biotechnology and pharmaceutical sectors. These include tax breaks, research grants, and other forms of assistance to promote industrial investment and innovation.

CMOs and CDMOs in Brazil have started to focus more on research & development services and offering their experience in technological development. They are also aiming to understand analytical testing and process optimization in addition to typical manufacturing services

Trends, Opportunities, and Challenges in Brazil CMO/CDMO Space

The table below provides the latest trends observed in the Brazil CMO/CDMO space, growth obstacles, and upcoming opportunities. Business strategies for pushing CMO/CDMO sales in Brazil would enable stakeholders to invest in the right area and gain profit.

Attributes Key Factors
Latest Trends
  • Pharmaceutical and biotechnology companies are progressively outsourcing their manufacturing requirements to CMOs and CDMOs. This trend is driven by aspects such as cost efficiency, access to expert knowledge, and the need for flexible manufacturing capabilities.
  • Biologics and biosimilar manufacturing is a rising segment in the Brazil CMO/CDMO business. This is due to the growing demand for these compound therapies, which often need specialized manufacturing abilities.
  • Regulatory acquiescence and adherence to global quality standards remain important aspects for both CMOs and CDMOs. Companies have focused on upholding high-quality manufacturing processes to meet worldwide regulatory requirements.
  • CMOs and CDMOs are capitalizing on advanced technology and automation to increase efficiency, reduce costs, and improve the quality of the manufacturing process. This includes the adoption of advanced manufacturing systems and equipment.
  • Environmental sustainability has become a significant consideration in the CMO/CDMO space. Businesses are adopting environmentally friendly methods and technologies to diminish their impact on the environment and align with global sustainable development goals.
Upcoming Opportunities
  • High-quality manufacturing by CMO/CDMOs can create a lucrative opportunity in the Brazil CMO/CDMO business. Pharmaceutical companies in Brazil can gain from luring foreign customers looking for partners with a reputation for top-notch production.
  • Customers from all around the world support CMOs/CDMOs that can reliably create pharmaceuticals that adhere to global quality standards, such as Good Manufacturing Practices (GMP), thereby creating new opportunities in Brazil.
  • In a competitive sector, superior manufacturing sets CMOs/CDMOs in particular. The assurance of product quality and safety is valued by companies searching for outsourcing partners, and they are willing to pay more for such services.
  • Pharmaceutical companies that outsource manufacturing aim to reduce risks related to supply chain interruptions, product quality, and regulatory compliance. Reducing these risks involves collaborating with CMOs/CDMOs recognized for high-quality production.
  • Specializing in specific therapeutic areas is the reason for boosting the CMO/CDMO demand in Brazil over the forecast period. Utilizing their experience and expertise, specialized CMOs/CDMOs can accelerate the drug development process. This is expected to result in shorter development cycles, which can hasten the time it takes for pharmaceutical businesses to sell their drugs.
Challenges
  • The Brazil CMO/CDMO business faces a significant restraint in the form of quality assurance, compliance challenges, and supply chain vulnerabilities. The regulatory environment in Brazil frequently necessitates significant documentation through records of production operations and quality control procedures. It can be time- and resource-consuming to ensure accurate and detailed documentation.
  • It is possible that smaller CMOs/CDMOs in Brazil will run into resource issues while attempting to build and maintain effective quality assurance and compliance procedures. Their capacity to compete with bigger, more seasoned players can be limited as a result.
  • Regular compliance inspections by regulatory bodies can hinder productivity and take resources away from it. Findings of non-compliance can result in fines, such as halts in production.
  • Dependence on imported raw materials and active pharmaceutical ingredients (APIs) can put CMOs and CDMOs at risk for supply interruptions brought on by factors, including trade restrictions, transportation problems, or shifts in the dynamics of the world's supply chain.
Sabyasachi Ghosh
Sabyasachi Ghosh

Principal Consultant

Talk to Analyst

Find your sweet spots for generating winning opportunities in this market.

Comparative View of Adjacent Brazil CMO/CDMO Businesses

The section covers a comparative view of three businesses similar to the global Brazil CMO/CDMO business. As per estimations, the small molecule innovator CDMO space would lead out of the three businesses.

The Brazil CMO/CDMO business is set to reach a valuation of US$ 697.93 million by 2023. The small molecule innovator, CDMO, and CMO/CDMO businesses are projected to reach US$ 48.09 billion and US$ 22.5 billion, respectively, in 2023.

Key Trends in the Brazil CMO/CDMO Business Landscape:

CAGR (2023 to 2033) 2.7%
Estimated Value (2023) US$ 697.93 million
Growth Factor CMOs and CDMOs are collaborating strategically with biotech start-ups, pharmaceutical corporations, and academic institutions. These partnerships are set to help create and produce pharmaceutical goods by utilizing their combined knowledge, resources, and capabilities.
Key Trend The CMO/CDMO ecosystem is trending toward consolidation, with larger organizations purchasing smaller, specialized businesses to expand their service portfolios and geographic reach.

Factors Pushing CMO/CDMO Demand :

CAGR (2023 to 2033) 5.7%
Estimated Value (2023) US$ 22.5 billion
Growth Factor Through acquisitions and acquisitions, the Business has experienced a high level of consolidation. To increase their service offerings and geographic reach, larger CDMOs are purchasing smaller, specialized businesses.
Key Trend Due to their potential to completely change the way healthcare is provided, the development and production of ATMPs, such as gene therapies, cell therapies, and tissue-engineered products, have received particular attention.

Opportunities in the Small Molecule Innovator CDMO Space:

CAGR (2023 to 2033) 6.4%
Estimated Value (2023) US$ 48.09 billion
Growth Factor To improve data integrity, traceability, and transparency throughout the manufacturing process, innovative CDMOs are investing in digital technology and data management systems.
Key Trend Adopting green chemistry concepts and sustainable manufacturing techniques is becoming more and more important. This entails limiting waste, conserving energy, and utilizing more eco-friendly solvents.

Region-wise Insights

The table below shows the share of the top 5 countries for the review period from 2023 to 2033. South and North Brazil are expected to remain dominant by exhibiting CAGRs of 4.5% and 4.9%, respectively. The Central-west and Northeast Brazil are projected to follow with CAGRs of 3.8% and 3.1%, respectively.

Growth Outlook by Key Region

Regions Value CAGR
Southeast Brazil 2.3%
Northeast Brazil 3.1%
Central-west Brazil 3.8%
South Brazil 4.5%
North Brazil 4.9%

Increasing Research and Development in Southeast Brazil to Drive Demand

Growth in Southeast Brazil’s pharmaceutical sector is expanding steadily. Due to population expansion and improved access to healthcare, there is an increase in local demand for pharmaceuticals and other medical products.

The Southeast area of Brazil is benefiting from initiatives the government has put in place to encourage pharmaceutical business expansion. This includes financial incentives and tax breaks for businesses setting up shop in the region.

Southeast Brazil dominated the CMO/CDMO business and generated a 68.6% share in 2022. It is projected to continue experiencing high growth throughout the forecast period.

The economic center of Brazil is in the southeast, which is home to important cities, such as Sao Paulo and Rio de Janeiro. It is a popular site for CMOs and CDMOs to serve these clients because of its significant industrial base and the large number of pharmaceutical and biotech companies that call it home.

Prestigious universities and research institutions in Southeast Brazil offer a skilled labor pool and chances for collaboration between CMOs/CDMOs and academia on research & development projects. Also, several CMOs/CDMOs based in Southeast Brazil have expanded their operations globally, enabling them to serve clients both domestically and internationally.

Increasing Focus on Biotechnology to Surge Demand in Northeast Brazil

A handful of states in Northeast Brazil, such as Pernambuco, have taken special initiatives to draw in investments in the fields of biotechnology and life sciences. This has caused a cluster of biotech businesses to expand, opening doors for CMOs and CDMOs that focus on biologics.

Biotechnology and pharmaceutical research and development have received more attention in the region. This involves the development of formulations, analytical testing, and process optimization, areas in which CMOs and CDMOs can be particularly skilled.

Northeast Brazil dominates the Brazil CMO/CDMO business and held a 19.8% share in 2022. It is projected to continue experiencing high growth throughout the forecast period. Northeast Brazil has special environmental features or natural resources that make biopharmaceutical research and development possible.

Northeast Brazil is also the perfect location for companies focused on biotech and their manufacturing partners backed by these resources. Also, the region is home to eminent research facilities and academic hubs with a focus on biotechnology and pharmaceuticals.

They can promote cooperation between these institutions and CMOs/CDMOs. Such collaborations are frequently necessary to expand research and development initiatives.

Rising Investments in Infrastructure Fuel Sales in Central-west Brazil

Central-west Brazil held about a 5.1% share of the Brazil CMO/CDMO business in 2022. It is projected to increase during the forecast period.

Central-west Brazil's center geographic location offers a logistical advantage, enabling effective pharmaceutical product distribution to multiple regions across Brazil and adjacent nations. For CMOs and CDMOs aiming to serve a large space, this can be a crucial draw.

Investments in infrastructure, including transportation networks and industrial parks, can further enhance the region's attractiveness for pharmaceutical manufacturing and supply chain operations. The government supports domestic medicinal product production.

CMOs and CDMOs in the region would have the chance to serve the home ecosystem and export goods. Several colleges and research facilities in Central-west Brazil offer a pool of qualified workers in fields related to pharmaceutical development and manufacturing. CMOs and CDMOs can benefit from this in terms of hiring new personnel.

Get the data you need at a Fraction of the cost

Personalize your report by choosing insights you need
and save 40%!

Category-wise Insights

The table below signifies leading sub-categories under product, expression, and company size categories in the Brazil CMO/CDMO business. Stand-alone services are expected to dominate the ecosystem for Brazil CMO/CDMO at a CAGR of 3.4% by 2033. Under the company size category, the mid-sized segment is projected to lead the Brazil CMO/CDMO space with a CAGR of 2.3% by 2033.

Growth Outlook by Key Segments

Segment Value CAGR
Stand-alone Services (Services) 3.4%
API Substrate (Product) 1.9%
Mid-sized (Company Size) 2.3%
Mammalian (Expression System) 2.7%
Commercial (Scale of Operation) 2.9%

Stand-alone Services are to be Preferred Amid High Cost-cutting Needs

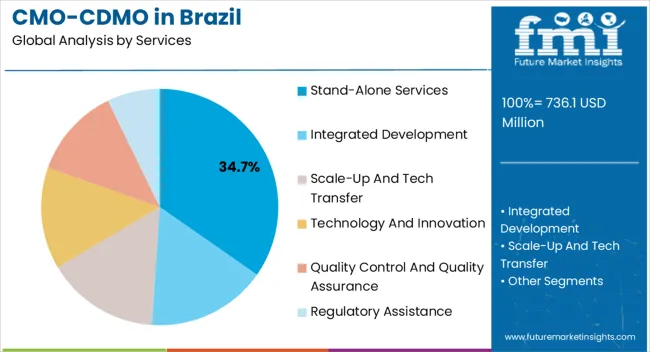
Stand-alone services under the service category held a share of 42.5% in 2022. It is expected to remain at the forefront over the forecast period.

Stand-alone services focus on specific aspects of drug development and manufacturing, such as formulation development, analytical testing, or sterile manufacturing. This specialization can attract companies seeking expertise in a particular area.

Companies decide to use stand-alone services to cut costs by outsourcing only a portion of the production or development of drugs while maintaining control over the remaining portions. This factor is anticipated to lead the stand-alone service segment in the Brazil CMO/CDMO business.

API Substrates are the Most Popular Type of Product

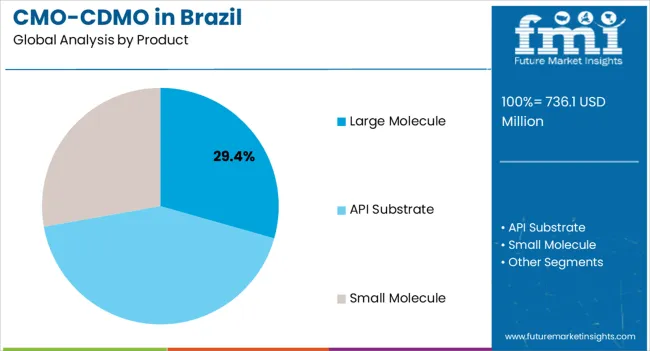
API substrate under the product category held a considerable share of 41.4% in 2022. The main components of pharmaceutical formulations are APIs.

APIs, often referred to as the dynamic components of medications, underlie their therapeutic effectiveness. The process of crafting APIs holds a pivotal role in the production of pharmaceuticals, marking a critical step in the journey of creating therapeutic solutions.

Pharmaceutical companies find it more affordable to outsource API production. The volume and efficiency of CMOs and CDMOs would allow them to create APIs more cheaply than in-house labs.

Mammalian Expression Systems to be Chosen Primarily by Suppliers

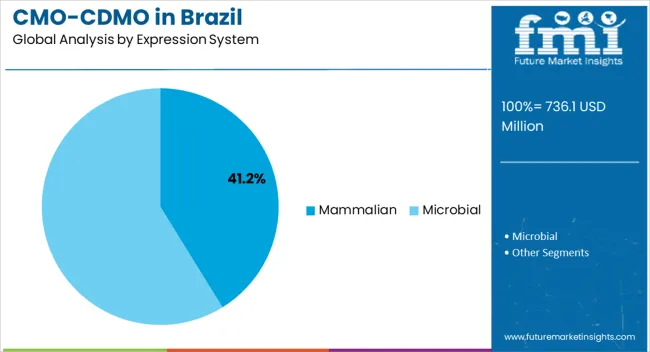
For the manufacturing of biologics, such as monoclonal antibodies, recombinant proteins, and vaccines, mammalian expression systems are frequently chosen. Due to their success in treating a wide range of ailments, biologics have grown in terms of popularity in the operating of the pharmaceutical sector.

Mammalian expression systems are set to be necessary for the manufacturing of several advanced and sophisticated medicines, including cell and gene therapies. These treatments are projected to make up a rapidly expanding area for pharmaceuticals. This factor is expected to stimulate the mammalian segment over the forecast timeline.
Competitive Landscape

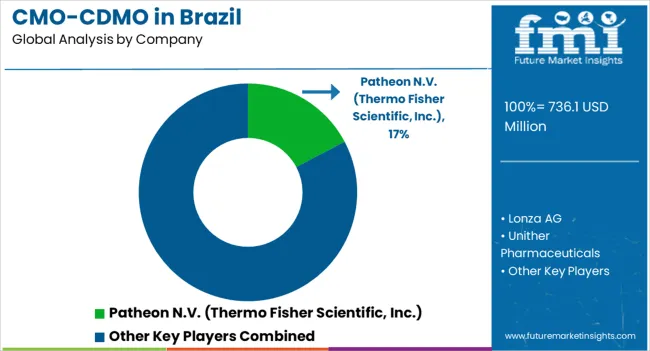
Geographic expansions are a priority for leading CMO/CDMO companies in Brazil as they work to create new product lines and expand their global consumer base. Expansion and acquisition among key companies or brands is the leading strategy of manufacturers such as Catalent and Fragon.

They aim to enhance their presence in the business landscape and compete with other players during the forecast period. Following are a handful of recent developments:

For instance,

  • In May 2021, Lonza inaugurated a new laboratory, marking a significant step in the Swiss Contract Development and Manufacturing Organization's (CDMO) strategy to bolster its presence in North America. It also plans to advance its Early Development Services (EDS) segment.
  • In February 2022, Pharma Nobis, LLC completed its acquisition of Fagron’s contract manufacturing business and manufacturing facility.
  • In August 2022, Catalent made an announcement regarding its acquisition of Metrics Contract Services. Metrics Contract Services is a specialized Contract Development and Manufacturing Organization (CDMO) known for its 333,000-square-foot facility located in Greenville.

Report Scope

Attribute Details
Brazil CMO-CDMO Revenue (2022) US$ 679.10 million
Projected Brazil CMO-CDMO Revenue (2033) US$ 907.67 million
Value-based CAGR (2023 to 2033) 2.7%
Forecast Period 2023 to 2033
Historical Data Available for 2018 to 2022
Business Analysis Value (US$ million)
Key Regions Covered North Brazil, Northeast Brazil, Central-west Brazil, Southeast Brazil, and South Brazil
Key Segments Covered
  • Services
  • Product
  • Expression System
  • Company Size
  • Scale of Operation
  • Region
  • Key Companies Profiled
  • Lonza AG
  • Unither Pharmaceuticals
  • Catalent Inc.
  • Fagron
  • Eurofarma
  • Pfizer CentreOne
  • Patheon N.V. (Thermo Fisher Scientific, Inc.)
  • NUVISAN
  • Societal CDMO
  • Bio-Manguinhos
  • Biotimize
  • Pierre Fabre group
  • Ajinomoto Co., Inc.

Brazil CMO/CDMO Industry Outlook by Category

By Services:

  • Stand-alone Services
    • Cell Line Development
    • Development and Bio Manufacturing
    • Analytical Services
    • Fill Finish
    • Packaging
    • Clinical Supply Services
  • Integrated Development
  • Scale-up and Tech Transfer
  • Technology and Innovation
  • Quality Control and Quality Assurance
  • Regulatory Assistance

By Product:

  • API Substrate
  • Large Molecule
    • Monoclonal Antibodies
    • Antibody Fragments
    • Recombinant Therapeutic Proteins
    • Viral Vector
    • Cell and Gene Therapy
    • Vaccine
    • Peptides
    • Antibody Drug Conjugates (ADCs)
  • Small Molecule

By Expression System:

  • Mammalian
  • Microbial
    • Bacteria
    • Yeast

By Company Size:

  • Small
  • Mid-sized
  • Large
  • Very Large

By Scale of Operation:

  • Preclinical
  • Clinical
    • Phase I
    • Phase II
    • Phase III
  • Commercial

By Region:

  • North Brazil
  • Northeast Brazil
  • Central-west Brazil
  • Southeast Brazil
  • South Brazil

Frequently Asked Questions

How large was the Brazil CMO/CDMO ecosystem in 2022?

Brazil was valued at around US$ 679.10 million in 2022.

What is the Brazil CMO/CDMO ecosystem projected value for 2033?

Brazil is set to reach a valuation of around US$ 907.67 million by 2033.

Which product segment is set to lead the Brazil CMO/CDMO business?

The API substrate segment held around 41.4% share in 2022.

What was the historical CAGR for the Brazil CMO/CDMO space?

Brazil's CMO/CDMO space increased at a 2.0% CAGR from 2018 to 2022.

What value is the Brazil CMO/CDMO business estimated to reach by 2023?

The Brazil CMO/CDMO business is set to reach US$ 697.93 million by 2023.

What is the Southeast Brazil CMO/CDMO space outlook?

Southeast Brazil CMO/CDMO business held a 68.6% share in 2022.

Which are the leading companies in Brazil's CMO/CDMO business?

Lonza AG and Unither Pharmaceuticals are the key exporters of CMO/CDMO in Brazil.

Table of Content

1. Executive Summary

    1.1. Outlook

    1.2. Demand Side Trends

    1.3. Supply-Side Trends

    1.4. Analysis and Recommendations

2. Overview

    2.1. Coverage / Taxonomy

    2.2. Definition / Scope / Limitations

    2.3. Inclusions and Exclusions

3. Key Trends

    3.1. Key Trends

4. Value Added Insights

    4.1. Service Adoption Analysis/Usage Analysis

    4.2. Overview of CRO and CDMO Services

    4.3. Role of Contract Service Providers

    4.4. Overview of CDMO with a Wide Array of Dosage Form Capabilities

    4.5. Regulatory Scenario

    4.6. Latest Deals

    4.7. PESTLE Analysis

    4.8. Porter’s Analysis

    4.9. Pharma Services Supply Chain Analysis

    4.10. Value Chain Analysis

5. Background

    5.1. Macro-Economic Factors

        5.1.1. GDP Growth Outlook

        5.1.2. Research and Development Funding by Region

        5.1.3. Research and Development Funding by Country

        5.1.4. Pharmaceutical Spending, By Country

        5.1.5. Global CMO-CDMO Sales

    5.2. Forecast Factors - Relevance and Impact

        5.2.1. Historic Growth of Key Players

        5.2.2. Consolidation Activities

        5.2.3. Increasing Research and Development Activities

        5.2.4. Increased Funding and Support from Government

        5.2.5. CMO/CDMO Services Adoption Rates

        5.2.6. Increasing Number of Diagnostics Testing and Development

        5.2.7. Regulatory Imposition

        5.2.8. Increase in Number of Clinicians and Specialists

    5.3. Dynamics

        5.3.1. Drivers

        5.3.2. Restraints

        5.3.3. Opportunity Analysis

6. Demand Value or Size (US$ million) Analysis 2018 to 2022 and Forecast, 2023 to 2033

    6.1. Historical Value (US$ million) Analysis, 2018 to 2022

    6.2. Current and Future Value (US$ million) Projections, 2023 to 2033

        6.2.1. Y-o-Y Growth Trend Analysis

        6.2.2. Absolute $ Opportunity Analysis

7. Sales Analysis 2018 to 2022 and Forecast 2023 to 2033, By Services

    7.1. Introduction / Key Findings

    7.2. Historical Size (US$ million) Analysis By Services, 2018 to 2022

    7.3. Current and Future Size (US$ million) Analysis and Forecast By Services, 2023 to 2033

        7.3.1. Stand-Alone Services

            7.3.1.1. Cell Line Development

            7.3.1.2. Development and Bio Manufacturing

            7.3.1.3. Analytical Services

            7.3.1.4. Fill Finish

            7.3.1.5. Packaging

            7.3.1.6. Clinical Supply Services

        7.3.2. Integrated Development

        7.3.3. Scale-up and Tech Transfer

        7.3.4. Technology and Innovation

        7.3.5. Quality Control and Quality Assurance

        7.3.6. Regulatory Assistance

    7.4. Attractiveness Analysis By Services

8. Sales Analysis 2018 to 2022 and Forecast 2023 to 2033, By Product

    8.1. Introduction / Key Findings

    8.2. Historical Size (US$ million) By Product, 2018 to 2022

    8.3. Current and Future Size (US$ million) Analysis and Forecast By Product, 2023 to 2033

        8.3.1. API Substrate

        8.3.2. Large Molecule

            8.3.2.1. Monoclonal Antibodies

            8.3.2.2. Antibody Fragments

            8.3.2.3. Recombinant Therapeutic Proteins

            8.3.2.4. Viral Vector

            8.3.2.5. Cell and Gene Therapy

            8.3.2.6. Vaccine

            8.3.2.7. Peptides

            8.3.2.8. Antibody Drug Conjugates (ADCs)

        8.3.3. Small Molecule

    8.4. Attractiveness Analysis By Product

9. Sales Analysis 2018 to 2022 and Forecast 2023 to 2033, By Expression System

    9.1. Introduction / Key Findings

    9.2. Historical Size (US$ million) By Expression System, 2018 to 2022

    9.3. Current and Future Size (US$ million) Analysis and Forecast By Expression System, 2023 to 2033

        9.3.1. Mammalian

        9.3.2. Microbial

            9.3.2.1. Bacteria

            9.3.2.2. Yeast

    9.4. Attractiveness Analysis By Expression System

10. Sales Analysis 2018 to 2022 and Forecast 2023 to 2033, By Company Size

    10.1. Introduction / Key Findings

    10.2. Historical Size (US$ million) By Company Size, 2018 to 2022

    10.3. Current and Future Size (US$ million) Analysis and Forecast By Company Size, 2023 to 2033

        10.3.1. Small

        10.3.2. Mid-sized

        10.3.3. Large

        10.3.4. Very Large

    10.4. Attractiveness Analysis By Company Size

11. Sales Analysis 2018 to 2022 and Forecast 2023 to 2033, By Scale of Operation

    11.1. Introduction / Key Findings

    11.2. Historical Size (US$ million) By Scale of Operation, 2018 to 2022

    11.3. Current and Future Size (US$ million) Analysis and Forecast By Scale of Operation, 2023 to 2033

        11.3.1. Preclinical

        11.3.2. Clinical

            11.3.2.1. Phase I

            11.3.2.2. Phase II

            11.3.2.3. Phase III

        11.3.3. Commercial

    11.4. Attractiveness Analysis By Scale of Operation

12. Sales Analysis 2018 to 2022 and Forecast 2023 to 2033, By Region

    12.1. Introduction

    12.2. Historical Size (US$ million) Trend Analysis by Region, 2018 to 2022

    12.3. Current and Future Size (US$ million) Analysis and Forecast by Region, 2023 to 2033

        12.3.1. North

        12.3.2. Northeast

        12.3.3. Central-west

        12.3.4. Southeast

        12.3.5. South

    12.4. Attractiveness Analysis By Region

13. Business: Cross Section Analysis-Product Vs Services 

    13.1. Historical Size (US$ million) Trend Analysis by Product Vs Services, 2018 to 2022

    13.2. Current and Future Size (US$ million) Analysis and Forecast by Product Vs Services, 2023 to 2033

        13.2.1. API Substrate

            13.2.1.1. Stand-Alone Services

            13.2.1.2. Integrated Development

            13.2.1.3. Scale-Up and Tech Transfer

            13.2.1.4. Technology and Innovation

            13.2.1.5. Quality Control and Quality Assurance

            13.2.1.6. Regulatory Assistance

        13.2.2. Large Molecule

            13.2.2.1. Stand-Alone Services

            13.2.2.2. Integrated Development

            13.2.2.3. Scale-Up and Tech Transfer

            13.2.2.4. Technology and Innovation

            13.2.2.5. Quality Control and Quality Assurance

            13.2.2.6. Regulatory Assistance

        13.2.3. Small Molecule

            13.2.3.1. Stand-Alone Services

            13.2.3.2. Integrated Development

            13.2.3.3. Scale-Up and Tech Transfer

            13.2.3.4. Technology and Innovation

            13.2.3.5. Quality Control and Quality Assurance

            13.2.3.6. Regulatory Assistance

14. North Sales Analysis 2018 to 2022 and Forecast 2023 to 2033

    14.1. Introduction

    14.2. Historical Size (US$ million) Analysis Trend Analysis by Taxonomy, 2018 to 2022

    14.3. Current and Future Size (US$ million) Analysis and Forecast by Taxonomy, 2023 to 2033

        14.3.1. By Service

        14.3.2. By Product

        14.3.3. By Expression System

        14.3.4. By Company

        14.3.5. By Scale of Operation

    14.4. Attractiveness Analysis

        14.4.1. By Service

        14.4.2. By Product

        14.4.3. By Expression System

        14.4.4. By Company

        14.4.5. By Scale of Operation

    14.5. Drivers and Restraints - Impact Analysis

15. Northeast Sales Analysis 2018 to 2022 and Forecast 2023 to 2033

    15.1. Introduction

    15.2. Historical Size (US$ million) Trend Analysis by Taxonomy, 2018 to 2022

    15.3. Current and Future Size (US$ million) Analysis and Forecast by Taxonomy, 2023 to 2033

        15.3.1. By Service

        15.3.2. By Product

        15.3.3. By Expression System

        15.3.4. By Company

        15.3.5. By Scale of Operation

    15.4. Attractiveness Analysis

        15.4.1. By Service

        15.4.2. By Product

        15.4.3. By Expression System

        15.4.4. By Company

        15.4.5. By Scale of Operation

    15.5. Drivers and Restraints - Impact Analysis

16. Central-west Sales Analysis 2018 to 2022 and Forecast 2023 to 2033

    16.1. Introduction

    16.2. Historical Size (US$ million) Trend Analysis by Taxonomy, 2018 to 2022

    16.3. Current and Future Size (US$ million) Analysis and Forecast by Taxonomy, 2023 to 2033

        16.3.1. By Service

        16.3.2. By Product

        16.3.3. By Expression System

        16.3.4. By Company

        16.3.5. By Scale of Operation

    16.4. Attractiveness Analysis

        16.4.1. By Service

        16.4.2. By Product

        16.4.3. By Expression System

        16.4.4. By Company

        16.4.5. By Scale of Operation

    16.5. Drivers and Restraints - Impact Analysis

17. Southeast Sales Analysis 2018 to 2022 and Forecast 2023 to 2033

    17.1. Introduction

    17.2. Historical Size (US$ million) Trend Analysis by Taxonomy, 2018 to 2022

    17.3. Current and Future Size (US$ million) Analysis and Forecast by Taxonomy, 2023 to 2033

        17.3.1. By Service

        17.3.2. By Product

        17.3.3. By Expression System

        17.3.4. By Company

        17.3.5. By Scale of Operation

    17.4. Attractiveness Analysis

        17.4.1. By Service

        17.4.2. By Product

        17.4.3. By Expression System

        17.4.4. By Company

        17.4.5. By Scale of Operation

    17.5. Drivers and Restraints - Impact Analysis

18. South Sales Analysis 2018 to 2022 and Forecast 2023 to 2033

    18.1. Introduction

    18.2. Historical Size (US$ million) Trend Analysis by Taxonomy, 2018 to 2022

    18.3. Current and Future Size (US$ million) Analysis and Forecast by Taxonomy, 2023 to 2033

        18.3.1. By Service

        18.3.2. By Product

        18.3.3. By Expression System

        18.3.4. By Company

        18.3.5. By Scale of Operation

    18.4. Attractiveness Analysis

        18.4.1. By Service

        18.4.2. By Product

        18.4.3. By Expression System

        18.4.4. By Company

        18.4.5. By Scale of Operation

    18.5. Drivers and Restraints - Impact Analysis

19. State Level Sales Analysis 2022 and Forecast 2033

    19.1. Rio de Janeiro CMO/CDMO Analysis

        19.1.1. Introduction

        19.1.2. Sales Analysis and Forecast by Taxonomy

            19.1.2.1. By Service

            19.1.2.2. By Product

            19.1.2.3. By Expression System

            19.1.2.4. By Company

            19.1.2.5. By Scale of Operation

    19.2. São Paulo CMO/CDMO Analysis

        19.2.1. Introduction

        19.2.2. Sales Analysis and Forecast by Taxonomy

            19.2.2.1. By Service

            19.2.2.2. By Product

            19.2.2.3. By Expression System

            19.2.2.4. By Company

            19.2.2.5. By Scale of Operation

    19.3. Minas Geras CMO/CDMO Analysis

        19.3.1. Introduction

        19.3.2. Sales Analysis and Forecast by Taxonomy

            19.3.2.1. By Service

            19.3.2.2. By Product

            19.3.2.3. By Expression System

            19.3.2.4. By Company

            19.3.2.5. By Scale of Operation

    19.4. Bahia CMO/CDMO Analysis

        19.4.1. Introduction

        19.4.2. Sales Analysis and Forecast by Taxonomy

            19.4.2.1. By Service

            19.4.2.2. By Product

            19.4.2.3. By Expression System

            19.4.2.4. By Company

            19.4.2.5. By Scale of Operation

    19.5. Pioui CMO/CDMO Analysis

        19.5.1. Introduction

        19.5.2. Sales Analysis and Forecast by Taxonomy

            19.5.2.1. By Service

            19.5.2.2. By Product

            19.5.2.3. By Expression System

            19.5.2.4. By Company

            19.5.2.5. By Scale of Operation

    19.6. Rest of CMO/CDMO Analysis

        19.6.1. Introduction

        19.6.2. Sales Analysis and Forecast by Taxonomy

            19.6.2.1. By Service

            19.6.2.2. By Product

            19.6.2.3. By Expression System

            19.6.2.4. By Company

            19.6.2.5. By Scale of Operation

20. Structure Analysis

    20.1. Sales Analysis by Tier of Companies

    20.2. Share Analysis of Top Players (%)

21. Competition Analysis

    21.1. Competition Dashboard

    21.2. Competition Benchmarking

    21.3. Key Development Analysis

    21.4. Branding and Promotional Strategies, by Key Manufacturers

    21.5. Competition Deep Dive

        21.5.1. Lonza AG

            21.5.1.1. Overview

            21.5.1.2. Product Portfolio

            21.5.1.3. Key Financials

            21.5.1.4. SWOT Analysis

            21.5.1.5. Key Developments

            21.5.1.6. Sales Footprint

            21.5.1.7. Strategy Overview

        21.5.2. Lonza AG

            21.5.2.1. Overview

            21.5.2.2. Product Portfolio

            21.5.2.3. Key Financials

            21.5.2.4. SWOT Analysis

            21.5.2.5. Key Developments

            21.5.2.6. Sales Footprint

            21.5.2.7. Strategy Overview

        21.5.3. Unither Pharmaceuticals

            21.5.3.1. Overview

            21.5.3.2. Product Portfolio

            21.5.3.3. Key Financials

            21.5.3.4. SWOT Analysis

            21.5.3.5. Key Developments

            21.5.3.6. Sales Footprint

            21.5.3.7. Strategy Overview

        21.5.4. Catalent Inc.

            21.5.4.1. Overview

            21.5.4.2. Product Portfolio

            21.5.4.3. Key Financials

            21.5.4.4. SWOT Analysis

            21.5.4.5. Key Developments

            21.5.4.6. Sales Footprint

            21.5.4.7. Strategy Overview

        21.5.5. Fagron

            21.5.5.1. Overview

            21.5.5.2. Product Portfolio

            21.5.5.3. Key Financials

            21.5.5.4. SWOT Analysis

            21.5.5.5. Key Developments

            21.5.5.6. Sales Footprint

            21.5.5.7. Strategy Overview

        21.5.6. Eurofarma

            21.5.6.1. Overview

            21.5.6.2. Product Portfolio

            21.5.6.3. Key Financials

            21.5.6.4. SWOT Analysis

            21.5.6.5. Key Developments

            21.5.6.6. Sales Footprint

            21.5.6.7. Strategy Overview

        21.5.7. Pfizer CentreOne

            21.5.7.1. Overview

            21.5.7.2. Product Portfolio

            21.5.7.3. Key Financials

            21.5.7.4. SWOT Analysis

            21.5.7.5. Key Developments

            21.5.7.6. Sales Footprint

            21.5.7.7. Strategy Overview

        21.5.8. Patheon N.V. (Thermo Fisher Scientific, Inc.)

            21.5.8.1. Overview

            21.5.8.2. Product Portfolio

            21.5.8.3. Key Financials

            21.5.8.4. SWOT Analysis

            21.5.8.5. Key Developments

            21.5.8.6. Sales Footprint

            21.5.8.7. Strategy Overview

        21.5.9. NUVISAN

            21.5.9.1. Overview

            21.5.9.2. Product Portfolio

            21.5.9.3. Key Financials

            21.5.9.4. SWOT Analysis

            21.5.9.5. Key Developments

            21.5.9.6. Sales Footprint

            21.5.9.7. Strategy Overview

        21.5.10. Societal CDMO

            21.5.10.1. Overview

            21.5.10.2. Product Portfolio

            21.5.10.3. Key Financials

            21.5.10.4. SWOT Analysis

            21.5.10.5. Key Developments

            21.5.10.6. Sales Footprint

            21.5.10.7. Strategy Overview

        21.5.11. Bio-Manguinhos

            21.5.11.1. Overview

            21.5.11.2. Product Portfolio

            21.5.11.3. Key Financials

            21.5.11.4. SWOT Analysis

            21.5.11.5. Key Developments

            21.5.11.6. Sales Footprint

            21.5.11.7. Strategy Overview

        21.5.12. Biotimize

            21.5.12.1. Overview

            21.5.12.2. Product Portfolio

            21.5.12.3. Key Financials

            21.5.12.4. SWOT Analysis

            21.5.12.5. Key Developments

            21.5.12.6. Sales Footprint

            21.5.12.7. Strategy Overview

        21.5.13. Pierre Fabre group

            21.5.13.1. Overview

            21.5.13.2. Product Portfolio

            21.5.13.3. Key Financials

            21.5.13.4. SWOT Analysis

            21.5.13.5. Key Developments

            21.5.13.6. Sales Footprint

            21.5.13.7. Strategy Overview

        21.5.14. Ajinomoto Co., Inc.

            21.5.14.1. Overview

            21.5.14.2. Product Portfolio

            21.5.14.3. Key Financials

            21.5.14.4. SWOT Analysis

            21.5.14.5. Key Developments

            21.5.14.6. Sales Footprint

            21.5.14.7. Strategy Overview

22. Assumptions and Acronyms Used

List of Tables

Table 01: Size (US$ million) Analysis 2018 to 2022 and Forecast 2023 to 2033, By Services

Table 02: Size (US$ million) Analysis 2018 to 2022 and Forecast 2023 to 2033, By Product

Table 03: Size (US$ million) Analysis 2018 to 2022 and Forecast 2023 to 2033, By Expression System

Table 04: Size (US$ million) Analysis 2018 to 2022 and Forecast 2023 to 2033, By Company Size

Table 05: Size (US$ million) Analysis 2018 to 2022 and Forecast 2023 to 2033, By Scale of Operation

Table 06: Size (US$ million) Analysis 2018 to 2022 and Forecast 2023 to 2033, By Region

Table 07: Business, Cross Sectional Analysis of Product Vs Services, 2018 to 2033

Table 08: Business, Cross Sectional Analysis of Product Vs Services, 2018 to 2033

Table 09: Business, Cross Sectional Analysis of Product Vs Services, 2018 to 2033

Table 10: North Size (US$ million) Analysis 2018 to 2022 and Forecast 2023 to 2033, By Services

Table 11: North Size (US$ million) Analysis 2018 to 2022 and Forecast 2023 to 2033, By Product

Table 12: North Size (US$ million) Analysis 2018 to 2022 and Forecast 2023 to 2033, By Expression System

Table 13: North Size (US$ million) Analysis 2018 to 2022 and Forecast 2023 to 2033, By Company Size

Table 14: North Size (US$ million) Analysis 2018 to 2022 and Forecast 2023 to 2033, By Scale of Operation

Table 15: Northeast Size (US$ million) Analysis 2018 to 2022 and Forecast 2023 to 2033, By Services

Table 16: Northeast Size (US$ million) Analysis 2018 to 2022 and Forecast 2023 to 2033, By Product

Table 17: Northeast Size (US$ million) Analysis 2018 to 2022 and Forecast 2023 to 2033, By Expression System

Table 18: Northeast Size (US$ million) Analysis 2018 to 2022 and Forecast 2023 to 2033, By Company Size

Table 19: Northeast Size (US$ million) Analysis 2018 to 2022 and Forecast 2023 to 2033, By Scale of Operation

Table 20: Central-West Size (US$ million) Analysis 2018 to 2022 and Forecast 2023 to 2033, By Services

Table 21: Central-West Size (US$ million) Analysis 2018 to 2022 and Forecast 2023 to 2033, By Product

Table 22: Central-West Size (US$ million) Analysis 2018 to 2022 and Forecast 2023 to 2033, By Expression System

Table 23: Central-West Size (US$ million) Analysis 2018 to 2022 and Forecast 2023 to 2033, By Company Size

Table 24: Central-West Size (US$ million) Analysis 2018 to 2022 and Forecast 2023 to 2033, By Scale of Operation

Table 25: Southeast Size (US$ million) Analysis 2018 to 2022 and Forecast 2023 to 2033, By Services

Table 26: Southeast Size (US$ million) Analysis 2018 to 2022 and Forecast 2023 to 2033, By Product

Table 27: Southeast Size (US$ million) Analysis 2018 to 2022 and Forecast 2023 to 2033, By Expression System

Table 28: Southeast Size (US$ million) Analysis 2018 to 2022 and Forecast 2023 to 2033, By Company Size

Table 29: Southeast Size (US$ million) Analysis 2018 to 2022 and Forecast 2023 to 2033, By Scale of Operation

Table 30: South Size (US$ million) Analysis 2018 to 2022 and Forecast 2023 to 2033, By Services

Table 31: South Size (US$ million) Analysis 2018 to 2022 and Forecast 2023 to 2033, By Product

Table 32: South Size (US$ million) Analysis 2018 to 2022 and Forecast 2023 to 2033, By Expression System

Table 33: South Size (US$ million) Analysis 2018 to 2022 and Forecast 2023 to 2033, By Company Size

Table 34: South Size (US$ million) Analysis 2018 to 2022 and Forecast 2023 to 2033, By Scale of Operation

List of Charts

Figure 01: Split By Region, 2023 (E)

Figure 02: Split By Services, 2023 (E)

Figure 03: Split By Product, 2023 (E)

Figure 04: Split By Expression System, 2023 (E)

Figure 05: Split By Company Size, 2023 (E)

Figure 06: Split By Scale of Operation, 2023 (E)

Figure 07: Historical Value (US$ million) Analysis, 2018 to 2022

Figure 08: Value (US$ million), 2023 to 2033 & Y-o-Y Growth Trend Analysis

Figure 09: Absolute $ Opportunity, 2023 to 2033

Figure 10: Share Analysis (%) By Services, 2023 to 2033

Figure 11: Y-o-Y Growth (%) By Services, 2023 to 2033

Figure 12: Attractiveness Analysis, By Services

Figure 13: Share Analysis (%) By Product, 2023 to 2033

Figure 14: Y-o-Y Growth (%) By Product, 2023 to 2033

Figure 15: Attractiveness Analysis, By Product

Figure 16: Share Analysis (%) By Expression System, 2023 to 2033

Figure 17: Y-o-Y Growth (%) By Expression System, 2023 to 2033

Figure 18: Attractiveness Analysis, By Expression System

Figure 19: Share Analysis (%) By Company Size, 2023 to 2033

Figure 20: Y-o-Y Growth (%) By Company Size 2023 to 2033

Figure 21: Attractiveness Analysis, By Company Size

Figure 22: Share Analysis (%) By Scale of Operation, 2023 to 2033

Figure 23: Y-o-Y Growth (%) By Scale of Operation, 2023 to 2033

Figure 24: Attractiveness Analysis, By Scale of Operation

Figure 25: Share Analysis (%) By Region, 2023 to 2033

Figure 26: Y-o-Y Growth (%) By Region, 2023 to 2033

Figure 27: Attractiveness Analysis, By Region

Figure 28: North Split By Services, 2023 (E)

Figure 29: North Split By Product, 2023 (E)

Figure 30: North Split By Expression System, 2023 (E)

Figure 31: North Split By Company Size, 2023 (E)

Figure 32: North Split By Scale of Operation, 2023 (E)

Figure 33: North Historical Value (US$ million) Analysis, 2018 to 2022

Figure 34: North Value (US$ million), 2023 to 2033 & Y-o-Y Growth Trend Analysis

Figure 35: North Attractiveness Analysis, By Services

Figure 36: North Attractiveness Analysis, By Product

Figure 37: North Attractiveness Analysis, By Expression System

Figure 38: North Attractiveness Analysis, By Company Size

Figure 39: North Attractiveness Analysis, By Scale of Operation

Figure 40: Northeast Split By Services, 2023 (E)

Figure 41: Northeast Split By Product, 2023 (E)

Figure 42: Northeast Split By Expression System, 2023 (E)

Figure 43: Northeast Split By Company Size, 2023 (E)

Figure 44: Northeast Split By Scale of Operation, 2023 (E)

Figure 45: Northeast Historical Value (US$ million) Analysis, 2018 to 2022

Figure 46: Northeast Value (US$ million), 2023 to 2033 & Y-o-Y Growth Trend Analysis

Figure 47: Northeast Attractiveness Analysis, By Services

Figure 48: Northeast Attractiveness Analysis, By Product

Figure 49: Northeast Attractiveness Analysis, By Expression System

Figure 50: Northeast Attractiveness Analysis, By Company Size

Figure 51: Northeast Attractiveness Analysis, By Scale of Operation

Figure 52: Central-West Split By Services, 2023 (E)

Figure 53: Central-West Split By Product, 2023 (E)

Figure 54: Central-West Split By Expression System, 2023 (E)

Figure 55: Central-West Split By Company Size, 2023 (E)

Figure 56: Central-West Split By Scale of Operation, 2023 (E)

Figure 57: Central-West Historical Value (US$ million) Analysis, 2018 to 2022

Figure 58: Central-West Value (US$ million), 2023 to 2033 & Y-o-Y Growth Trend Analysis

Figure 59: Central-West Attractiveness Analysis, By Services

Figure 60: Central-West Attractiveness Analysis, By Product

Figure 61: Central-West Attractiveness Analysis, By Expression System

Figure 62: Central-West Attractiveness Analysis, By Company Size

Figure 63: Central-West Attractiveness Analysis, By Scale of Operation

Figure 64: Southeast Split By Services, 2023 (E)

Figure 65: Southeast Split By Product, 2023 (E)

Figure 66: Southeast Split By Expression System, 2023 (E)

Figure 67: Southeast Split By Company Size, 2023 (E)

Figure 68: Southeast Split By Scale of Operation, 2023 (E)

Figure 69: Southeast Historical Value (US$ million) Analysis, 2018 to 2022

Figure 70: Southeast Value (US$ million), 2023 to 2033 & Y-o-Y Growth Trend Analysis

Figure 71: Southeast Attractiveness Analysis, By Services

Figure 72: Southeast Attractiveness Analysis, By Product

Figure 73: Southeast Attractiveness Analysis, By Expression System

Figure 74: Southeast Attractiveness Analysis, By Company Size

Figure 75: Southeast Attractiveness Analysis, By Scale of Operation

Figure 76: South Split By Services, 2023 (E)

Figure 77: South Split By Product, 2023 (E)

Figure 78: South Split By Expression System, 2023 (E)

Figure 79: South Split By Company Size, 2023 (E)

Figure 80: South Split By Scale of Operation, 2023 (E)

Figure 81: South Historical Value (US$ million) Analysis, 2018 to 2022

Figure 82: South Value (US$ million), 2023 to 2033 & Y-o-Y Growth Trend Analysis

Figure 83: South Attractiveness Analysis, By Services

Figure 84: South Attractiveness Analysis, By Product

Figure 85: South Attractiveness Analysis, By Expression System

Figure 86: South Attractiveness Analysis, By Company Size

Figure 87: South Attractiveness Analysis, By Scale of Operation

Recommendations

Healthcare

Electrophoresis Market

Published : October 2023

Healthcare

Catheter Market

Published : October 2023

Healthcare

CMO/CDMO Market

Published : May 2023

Healthcare

Small Molecule Innovator CDMO Market

Published : March 2023

Explore Healthcare Insights

View Reports

CMO/CDMO Industry Analysis in Brazil