The Industry Analysis of Electronic Skin in Western Europe is estimated to be valued at USD 0.6 billion in 2025 and is projected to reach USD 5.7 billion by 2035, registering a compound annual growth rate (CAGR) of 25.8% over the forecast period.
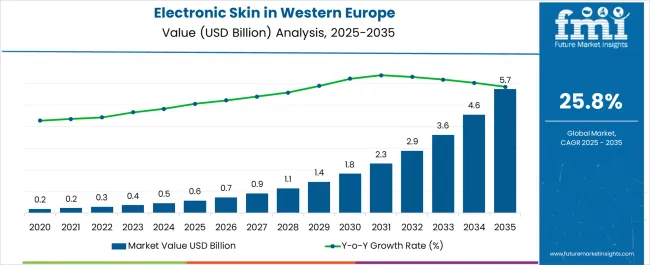
| Metric | Value |
|---|---|
| Industry Analysis of Electronic Skin in Western Europe Estimated Value in (2025 E) | USD 0.6 billion |
| Industry Analysis of Electronic Skin in Western Europe Forecast Value in (2035 F) | USD 5.7 billion |
| Forecast CAGR (2025 to 2035) | 25.8% |
The electronic skin market in Western Europe is witnessing rapid expansion. Growth is being driven by increasing adoption of wearable electronics, rising demand for real-time health monitoring, and technological advancements in flexible and stretchable electronics. Current market dynamics reflect robust R&D investment, regulatory support for healthcare and medical devices, and heightened awareness of personalized monitoring solutions among consumers and healthcare providers.
Integration with IoT and smart devices has enhanced functionality, while collaborations between technology developers and healthcare institutions have accelerated adoption. The future outlook is shaped by increasing geriatric population, rising prevalence of chronic diseases, and growing focus on remote patient monitoring.
Expansion of digital healthcare infrastructure and integration with advanced robotics and prosthetics are expected to further fuel market growth Growth rationale is founded on the versatility of electronic skin applications, ability to provide continuous physiological data, and technological innovations that improve durability, sensitivity, and biocompatibility, collectively supporting sustained market penetration and adoption across both medical and consumer segments.
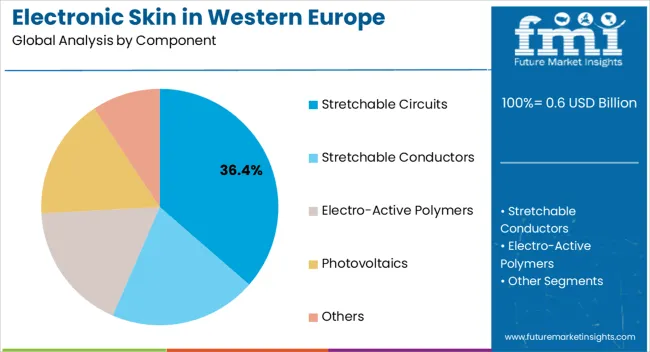
The stretchable circuits segment, accounting for 36.4% of the component category, has emerged as the leading component due to its flexibility, durability, and ability to maintain performance under mechanical strain. Its adoption has been driven by the demand for high-performance wearable devices and electronic skin applications that require conformability to human anatomy.
Manufacturing advancements in flexible substrates, conductive materials, and miniaturization have enhanced product reliability and integration capabilities. Regulatory compliance, material biocompatibility, and long-term stability have further reinforced market confidence.
Strategic collaborations between electronics manufacturers and healthcare device developers have expanded application scope, while continuous innovation in circuit design and fabrication processes is expected to sustain the segment’s market share and support growth in advanced healthcare and consumer electronics applications.
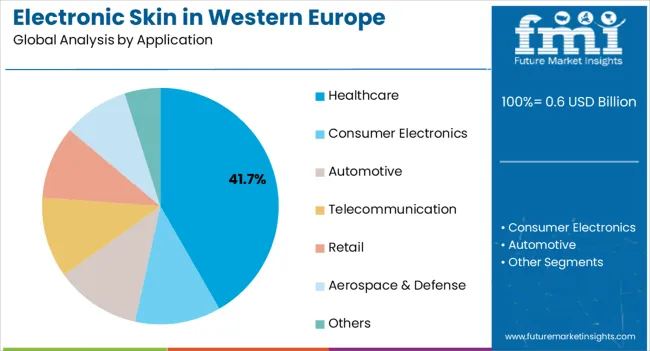
The healthcare application segment, representing 41.7% of the application category, has maintained dominance due to increasing demand for real-time patient monitoring, rehabilitation assistance, and chronic disease management. Adoption has been facilitated by integration of electronic skin into wearable monitoring devices and medical prosthetics.
Healthcare providers have increasingly relied on these devices for continuous data collection, early diagnosis, and improved patient outcomes. Regulatory approvals and clinical validations have strengthened adoption rates, while interoperability with hospital information systems and mobile applications has enhanced usability.
Technological advancements in sensing accuracy, signal processing, and data analytics are expected to drive further adoption The segment’s leadership is supported by growing healthcare expenditure, digital health initiatives, and rising awareness of personalized medicine, ensuring sustained contribution to overall market growth in Western Europe.
This section presents a detailed and in-depth analysis of various facets within certain categories, emphasizing their unique characteristics and emerging trends that define their trajectories. It provides essential insights into the dynamic forces and situations actively creating each segment's landscape.
| Leading Component for Electronic Skin in Western Europe | Electro-active Polymers |
|---|---|
| Value Share (2025) | 33.4% |
Electro-active polymers (EAPs) are increasingly gaining popularity due to their high sensitivity and responsiveness. EAPs hold a 33.4% value share in 2025, and their rising applications in robotics, healthcare, and other industries of Western Europe bolster their demand.
EAPs are ideal for e-skin applications due to their outstanding flexibility and conformability. This characteristic enables e-skin devices to adapt to various surfaces, guaranteeing a pleasant and ergonomic fit, consistent with Western Europe's inclination for user-centric product design.
EAPs can be produced utilizing environmentally friendly materials and procedures that adhere to Western Europe's sustainability standards and severe environmental legislation. This environmentally responsible strategy boosts the marketability of e-skin goods in the region.
| Top Application for Electronic Skin in Western Europe | Consumer Electronics |
|---|---|
| Value Share (2025) | 31.4% |
Consumer electronics have a massive share in Western Europe’s electronic skin industry by application, accounting for 31.4%. Wearable technology has grown significantly in the region.
E-skin components are being smoothly incorporated into smartwatches, fitness trackers, and other wearables, leveraging Western Europe's growing population of health-conscious consumers. The demand for electronic skin wearable devices in Madrid creates a niche target audience for opulent products.
Western Europe's substantial presence in the fashion and design sectors presents chances for e-skin integration into high-end, fashionable consumer electronics. This blend of technology and fashion appeals to the region's discerning customers. E-skin industry trends in Paris are expected to propel collaborations in fashion tech.
| Key Countries in Western Europe | Value Share (2025) |
|---|---|
| Germany | 31.7% |
| Italy | 27.3% |
| France | 30.0% |
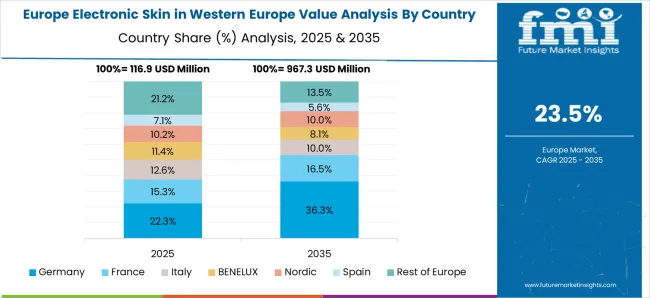
The demand for electronic skin in Germany holds a share of 31.7% in 2025. Germany's strong industrial base and superior manufacturing expertise offer an ideal environment for developing and producing e-skin technology. E-skin improves the human-machine interface and provides safety in the manufacturing and automation industries, in line with Germany's emphasis on Industry 4.0 and automation.
Electronic skin applications in environmental monitoring and sustainable agriculture enhance its demand in Germany. Government support and incentives for R&D in new technologies encourage e-skin innovation and industry expansion in Germany.
The rich fashion and design industry has helped Italy to gain a 27.3% share of the electronic skin industry in Western Europe. Italy's famous fashion and design sector presents opportunities for e-skin integration into fashionable and high-end wearable technology that appeals to prejudiced consumers.
Collaborations between fashion labels, technology businesses, and research institutions make it easier to build e-skin-enabled goods by using varied knowledge. Italy's world-class research institutes and universities actively contribute to e-skin research and development, fostering innovation and commercial expansion.
France accounts for 30.0% of Western Europe’s electronic skin sales in 2025. France's large aerospace sector opens up prospects for e-skin integration in spacecraft and aircraft for improved tactile sensing and safety, harmonizing with the country's advanced aerospace objectives.
The inclusion of e-skin into smart textiles supports France's defense industry, allowing for the production of modern military uniforms and equipment with integrated sensing capabilities. France has a thriving start-up ecosystem centered on e-skin technology that fosters entrepreneurship and market innovation, resulting in competitive dynamics and innovation.
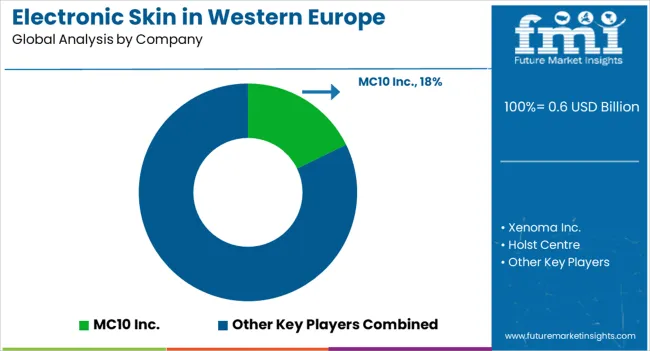
A diversified mix of companies and dynamics characterizes Western Europe's electronic skin industry. Established multinational corporations dominate the market by leveraging their substantial R&D skills, diverse product portfolios, and firmly established market presence. These market leaders have established themselves as significant players, providing e-skin solutions to various sectors.
Western Europe has a flourishing start-up environment in the e-skin industry. New entrants contribute to market innovation and agility, frequently focusing on niche e-skin applications or inventing novel technology. Their presence provides a competitive advantage by probing existing conventions and driving developments in the sector.
Recent Developments in Electronic Skin in Western Europe
| Attribute | Details |
|---|---|
| Estimated Industry Size, 2025 | USD 0.6 billion |
| Projected Industry Size, 2035 | USD 5.7 billion |
| Anticipated CAGR, 2025 to 2035 | 25.8% CAGR |
| Historical Analysis of Demand for Electronic Skin in Western Europe | 2020 to 2025 |
| Demand Forecast for Electronic Skin in Western Europe | 2025 to 2035 |
| Report Coverage | Industry Size, Industry Trends, Analysis of key factors influencing Electronic Skin Adoption in Western Europe, Insights on Global Players and their Industry Strategy in Western Europe, Ecosystem Analysis of Local and Regional Western Europe Manufacturers |
| Key Countries Analyzed while Studying Opportunities in Electronic Skin in Western Europe | Germany, Italy, France, Spain, UK, BENELUX, Rest of Western Europe |
| Key Companies Profiled | MC10 Inc.; Xenoma Inc.; Holst Centre; Interflex Co., Ltd.; ISORG; BeBop Sensors; StretchSense Ltd.; SENSODRIVE GmbH; Xenon Corporation; Dialog Semiconductor PLC |
The global industry analysis of electronic skin in Western Europe is estimated to be valued at USD 0.6 billion in 2025.
The market size for the industry analysis of electronic skin in Western Europe is projected to reach USD 5.7 billion by 2035.
The industry analysis of electronic skin in Western Europe is expected to grow at a 25.8% CAGR between 2025 and 2035.
The key product types in industry analysis of electronic skin in Western Europe are stretchable circuits, stretchable conductors, electro-active polymers, photovoltaics and others.
In terms of application, healthcare segment to command 41.7% share in the industry analysis of electronic skin in Western Europe in 2025.


Full Research Suite comprises of:
Market outlook & trends analysis
Interviews & case studies
Strategic recommendations
Vendor profiles & capabilities analysis
5-year forecasts
8 regions and 60+ country-level data splits
Market segment data splits
12 months of continuous data updates
DELIVERED AS:
PDF EXCEL ONLINE
Industry 4.0 Market
Industry Analysis Non-commercial Acrylic Paint in the United States Size and Share Forecast Outlook 2025 to 2035
Industry Analysis of Syringe and Needle in GCC Size and Share Forecast Outlook 2025 to 2035
Industry Analysis of Medical Device Packaging in Southeast Asia Size and Share Forecast Outlook 2025 to 2035
Industry Analysis of Paper Bag in North America Size and Share Forecast Outlook 2025 to 2035
Industry Analysis of Lidding Film in the United States Size and Share Forecast Outlook 2025 to 2035
Industry Analysis of Last-mile Delivery Software in Japan Size and Share Forecast Outlook 2025 to 2035
Industry Analysis of Automotive Lightweight Body Panel in the United States Size and Share Forecast Outlook 2025 to 2035
Germany Outbound Tourism Market Trends – Growth & Forecast 2024-2034
Europe Second-hand Apparel Market Growth – Trends & Forecast 2024-2034
Industry Analysis of Electronic Skin in Japan Size and Share Forecast Outlook 2025 to 2035
Industry Analysis of Electronic Skin in Korea Size and Share Forecast Outlook 2025 to 2035
DOAS Industry Analysis in the United States Forecast and Outlook 2025 to 2035
FIBC Industry Analysis in Japan Size and Share Forecast Outlook 2025 to 2035
Pectin Industry Analysis in Japan Size and Share Forecast Outlook 2025 to 2035
Western Europe Pectin Market Analysis by Product Type, Application, and Country Through 2035
Mezcal Industry Analysis in Japan - Consumer Demand & Industry Trends in 2025
Mezcal Industry Analysis in Korea – Trends, Demand & Industry Growth
Asia Pacific Dental Market Analysis – Growth, Trends & Forecast 2024-2034
Mezcal Industry Analysis in Western Europe Report – Growth, Demand & Forecast 2025 to 2035

Thank you!
You will receive an email from our Business Development Manager. Please be sure to check your SPAM/JUNK folder too.
Chat With
MaRIA