Pectin Industry Analysis in Japan Forecast and Outlook (2025-2035)

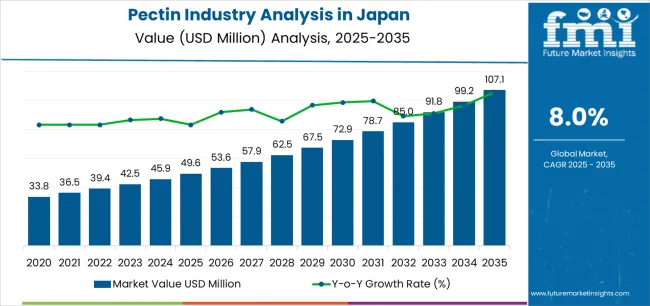
The demand for pectin in Japan is projected to expand from USD 49.6 million in 2025 to USD 107.1 million by 2035, registering an absolute increase of USD 57.4 million and advancing at a CAGR of 8.0%. Sales growth of nearly 2.2X over the forecast horizon highlights the balance between evolving demand drivers and supply-side adjustments that will shape the industry’s trajectory.

On the demand side, consumption is strongly influenced by rising health awareness and the growing penetration of clean-label formulations. Pectin, as a plant-derived gelling agent, appeals to both consumers and food processors seeking natural alternatives to synthetic stabilizers. Demand is particularly pronounced in the beverage sector, where pectin is used for texture stabilization and cloud retention in fruit-based drinks. The Japanese market also shows rising uptake in functional foods targeting the aging population, with pectin’s role in digestive health and cholesterol management reinforcing its use. Premium food manufacturers are emphasizing pectin’s natural origin and dietary fiber benefits to cater to consumers who prioritize nutrition alongside indulgence. Demand is therefore expanding across categories such as dairy desserts, jams, baked goods, and nutraceutical applications. The shift toward plant-based diets in urban populations is adding another vector, as pectin serves as a versatile thickening and gelling agent compatible with vegan and vegetarian diets.

On the supply side, Japan is largely dependent on imports of citrus peels and apple pomace, which serve as primary raw materials for pectin extraction. Domestic production capacity is limited, with most supply sourced from global producers located in Europe, Latin America, and China. This reliance makes the supply chain vulnerable to fluctuations in global fruit harvests, logistics disruptions, and currency exchange risks. Leading international suppliers are strengthening their presence in Japan by expanding distribution networks and collaborating with local food processors. Japanese firms are also investing in R&D partnerships aimed at optimizing the use of imported pectin and tailoring formulations to regional preferences, such as softer gels for traditional confectionery or specific textures in dairy products. Supply resilience is being tested by volatility in raw material availability, but technological innovations in extraction and blending are expected to improve efficiency.
Pectin Industry Analysis in Japan Key Takeaways

  • Pectin Industry Analysis in Japan Value (2025): USD 49.6 million
  • Pectin Industry Analysis in Japan Forecast Value (2035): USD 107.1 million
  • Pectin Industry Analysis in Japan Forecast CAGR: 8.0%
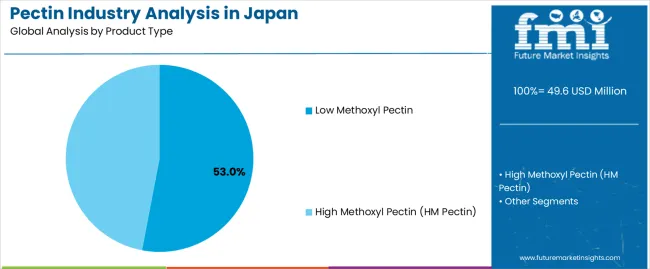
  • Leading Product Type in Japan Pectin Industry: Low Methoxyl Pectin (53.0%)
  • Key Growth Applications in Japan Pectin Industry: Beverages, Jams & Jellies, and Bakery Fillings
  • Regional Leadership: Domestic Japanese manufacturers drive primary demand
  • Top Key Players in Japan Pectin Industry: Unitec Foods Co. Ltd., ADEKA Corporation, Cargill Incorporated, Ingredion Incorporated, CP Kelco

Pectin Industry Analysis In Japan Market Value Analysis

Between 2025 and 2030, Japan pectin industry is projected to expand from USD 49.6 million to USD 72.8 million, resulting in a value increase of USD 23.2 million, which represents 40.4% of the total forecast growth for the decade. This phase of growth will be shaped by accelerating adoption of low methoxyl pectin formulations in reduced-sugar products, expanding functional beverage category requiring natural stabilization solutions, and increasing specification of clean-label gelling agents over synthetic alternatives in food processing operations. Growing adoption of specialty pectin grades offering enhanced functionality and organic certification continues to drive product differentiation. Manufacturers are expanding technical service capabilities to address health-positioning requirements and regulatory specifications, with particular emphasis on beverage stabilization and dairy product formulations serving health-conscious consumer segments.

Japan Pectin Industry Analysis Key Takeaways

Metric Value
Japan Pectin Industry Value (2025) USD 49.6 million
Japan Pectin Industry Forecast Value (2035) USD 107.1 million
Japan Pectin Industry Forecast CAGR (2025-2035) 8.0%

From 2030 to 2035, demand is forecast to grow from USD 72.8 million to USD 107.1 million, adding another USD 34.2 million, which constitutes 59.6% of the ten-year expansion. This period is expected to be characterized by maturation of functional food applications requiring specialized gelling properties, integration of advanced pectin modifications enhancing texture and stability characteristics, and expansion of nutraceutical applications requiring pharmaceutical-grade specifications. The growing emphasis on natural ingredient positioning, particularly in health-focused food categories and premium product segments, will drive demand for certified specialty pectins across commercial and consumer-facing applications.

Between 2020 and 2025, Japan pectin industry experienced steady expansion, growing from USD 38.2 million to USD 49.6 million. This growth was driven by increasing health consciousness among Japanese consumers, acceleration of clean-label product development by food manufacturers, and growing awareness of pectin's functional benefits as soluble fiber source. The sector developed as beverage manufacturers, jam producers, and dairy companies recognized the need for natural gelling agents differentiating premium offerings while meeting evolving consumer preferences favoring natural ingredients over synthetic alternatives.

Why is the Japan Pectin Industry Growing?

Industry expansion is being supported by the rapid transformation of Japan's food processing industry preferences, driven by aging population creating demand for health-positioned products, increasing consumer scrutiny of ingredient labels through digital media and wellness awareness, and growing appreciation for natural gelling agents offering functional benefits compared to synthetic stabilization systems. Modern food manufacturers, beverage producers, and confectionery establishments increasingly specify pectin for reduced-sugar formulations, clean-label positioning, and functional ingredient applications where natural fruit-derived materials create premium positioning and health differentiation.

The accelerating pace of health-conscious product development is fundamentally reshaping pectin consumption patterns by establishing quality standards, technical performance expectations, and consumer confidence in functional food ingredients. Major food companies, beverage manufacturers, and specialty producers are increasingly specifying authenticated pectin with documented functionality, consistent quality, and regulatory compliance provisions that contrast with synthetic alternatives of uncertain consumer acceptance and variable performance. The professionalization of functional food development, particularly in metropolitan processing centers, is driving specifications favoring natural pectins over artificial gelling agents in commercial applications where consumers value authentic ingredients and health-positioning credentials.

Opportunity Pathways - Japan Pectin Industry

The Japan pectin sector stands at a transformative inflection point where health consciousness, clean-label preferences, and functional food innovation converge to drive advanced demand growth. With demand projected to grow from USD 49.6 million in 2025 to USD 107.1 million by 2035, a robust 115.7% increase, the sector is being fundamentally reshaped by beverage industry innovation, reduced-sugar product development, and the pursuit of natural gelling solutions differentiating premium food applications.

The confluence of an aging population driving health-focused consumption patterns, food processing technology advancement establishing quality benchmarks, and regulatory support for health claims creates accelerated adoption of specialty pectin solutions. Food manufacturers and ingredient suppliers managing diverse application portfolios face simultaneous pressures to deliver functional performance, ensure regulatory compliance, and optimize formulation costs through specialized pectin grades offering consistency advantages over conventional gelling alternatives.

Strategic pathways encompassing specialty product development, application-specific formulations, technical service enhancement, and industry segment expansion offer substantial margin enhancement opportunities for manufacturers and distributors positioned at the innovation and quality frontier.

  • Pathway A - Low Methoxyl Pectin Specialization. Health consciousness and sugar-reduction trends drive demand for LM pectin enabling reduced-sugar and sugar-free applications with maintained gelling properties and clean-label positioning. Premium positioning through functional benefits commands 20-30% price advantages in health-focused products and diabetic-friendly formulations. Expected revenue pool: USD 25-40 million.
  • Pathway B - Functional Beverage Applications. Technology advances enabling pectin stabilization in RTD beverages, fiber-fortified drinks, and functional juice products address growing health beverage segment and texture management requirements. Specialty beverage solutions offering clarity and stability capture growing share among beverage manufacturers and functional drink applications. Potential: USD 30-50 million.
  • Pathway C - Organic Certification Premium. Integration of organic certified pectin meeting strict quality standards providing premium positioning and meeting health-conscious consumer preferences. Organic grades commanding margin advantages address residential and commercial specifications emphasizing natural ingredient credentials. Revenue opportunity: USD 15-25 million.
  • Pathway D - Bakery & Confectionery Innovation. Demand for clean-label bakery fillings and natural confectionery applications drives adoption of specialty pectin grades creating authentic fruit textures and reduced-sugar formulations. Bakery-specific solutions capture premium positioning in artisanal and commercial applications. Addressable opportunity: USD 20-35 million.
  • Pathway E - Dairy Alternative Applications. Plant-based dairy manufacturers require specialized pectins for yogurt alternatives, dairy-free desserts, and vegan formulations with enhanced stability and texture properties. Technical pectins serving dairy alternative segments command substantial premiums through specialized functionality and quality requirements. Expected uplift: USD 12-20 million.
  • Pathway F - Pharmaceutical Grade Development. Nutraceutical and supplement applications drive adoption of pharmaceutical-grade pectin enabling health claims, supplement formulations, and medical food applications. Pharma-grade solutions create differentiation while addressing regulatory compliance requirements. Potential: USD 8-15 million.
  • Pathway G - Technical Service Integration. Food manufacturer partnerships create comprehensive technical support through application development, formulation optimization, and process validation services. Strategic service partnerships capture high-value relationships with predictable volume patterns and premium pricing. Revenue opportunity: USD 18-30 million.
  • Pathway H - Regional Food Processing Development. Domestic food processing expansion in traditional Japanese products, regional specialties, and export-oriented manufacturing creates project-based pectin demand with specifications emphasizing quality consistency and cultural authenticity. Regional-focused solutions with comprehensive support capture domestic segment. Addressable opportunity: USD 10-18 million.

Segmental Analysis

Demand is segmented by product type, application, source material, and quality grades. By product type, sales are divided into low methoxyl pectin and high methoxyl pectin. Based on application, demand is categorized into jams & jellies, beverages, bakery fillings & toppings, dairy products & frozen desserts, and confectionery applications. In terms of source material, sales are segmented into citrus pectin, apple pectin, and other botanical sources. By quality grades, demand is divided into food grade, pharmaceutical grade, and organic certified categories.
By Product Type, Low Methoxyl Pectin Segment Accounts for 53.0% Share

Pectin Industry Analysis In Japan Analysis By Product Type

Low Methoxyl Pectin is projected to account for 53% of Japan pectin industry in 2025, making this product type the dominant segment across health-focused, reduced-sugar, and functional food applications. This dominance reflects LM pectin's critical functionality in calcium-reactive gelling systems, superior performance in low-sugar formulations, and clean-label positioning associated with premium health products and contemporary dietary preferences. The segment encompasses conventional LM pectin (32.0% subsegment share) providing standard gelling functionality for reduced-sugar applications and commercial food processing, amidated LM pectin (13.5%) utilizing enhanced stability characteristics suited to challenging pH conditions and extended shelf-life requirements, and organic certified LM pectin (7.5%) incorporating premium positioning creating health-conscious consumer appeal.

Conventional LM pectin maintains dominant position through combination of functional superiority in sugar-reduced applications with cost-effectiveness for commercial food manufacturing, proven performance characteristics in dairy and beverage applications, and regulatory compliance enabling health claims and nutritional positioning. The versatility of LM pectin creates diverse application opportunities within health-focused industrys, with calcium-reactive gelling mechanism providing unique functionality in dairy products and functional beverages. LM pectin scarcity from specialized processing requirements and technical complexity creates supply differentiation supporting premium positioning while driving development of application-specific grades.
  • LM pectin dominance reflects health-conscious consumer preferences, regulatory support for functional food claims, and superior performance characteristics in reduced-sugar applications established through advanced food processing innovation.
  • Calcium-reactive gelling properties and low-sugar functionality drive adoption of LM pectin alternatives and specialty grades enabling health-positioned products while ensuring regulatory compliance and functional performance.

By Application, Beverages Segment Accounts for 22.3% Share

Pectin Industry Analysis In Japan Analysis By Application

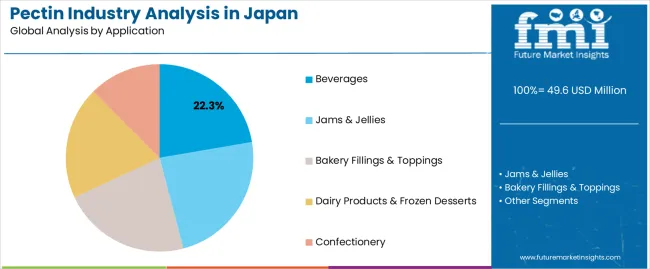
Beverages are projected to demonstrate the highest growth rate at 9.2% CAGR through 2035 while accounting for 22.3% application share in 2025, making this application category the fastest-growing segment driven by functional beverage innovation, fiber-fortified drink development, and RTD product stabilization requirements. The segment encompasses fiber-fortified functional drinks (8.2% subsegment share) targeting health-conscious consumers seeking digestive wellness benefits, fruit juice beverages (7.1%) requiring natural stabilization preventing sedimentation and maintaining fresh taste profiles, and dairy beverage applications (7.0%) where pectin provides texture management and clean-label positioning.

Functional beverages represent the highest-growth subsegment, with manufacturers utilizing pectin for soluble fiber content enabling nutritional claims, natural stabilization properties maintaining product consistency, and clean-label positioning replacing synthetic alternatives. The health beverage segment demonstrates particularly strong pectin consumption as fiber-fortified drinks, wellness beverages, and sports nutrition products incorporate consistent pectin functionality across product ranges. Premium beverage applications increasingly specify natural pectins for custom formulations and specialized products where consumers value functional ingredients and health positioning.

  • Beverage dominance reflects fundamental health trend activity, consumer demand for functional ingredients, and pectin's role enabling natural stabilization at competitive costs compared to synthetic stabilizer alternatives.
  • Functional beverage growth and fiber-fortification represent highest-growth beverage subsegments, driven by health consciousness expansion and regulatory support establishing contemporary wellness positioning preferences.

What are the Drivers, Restraints, and Key Trends of the Japan Pectin Industry?

Japan pectin industry is advancing steadily due to accelerating health consciousness and aging population dietary requirements, expanding clean-label product development establishing natural ingredient standards, and growing functional food specifications favoring natural gelling agents over synthetic alternatives. The sector faces challenges including mature food processing industry limiting volume expansion potential, economic uncertainty creating price sensitivity pressures, and competition from alternative hydrocolloids offering specific performance advantages.

Health Consciousness Driving Clean-Label Reformulation

The expansion of health-conscious consumer behavior including reduced-sugar preferences, functional food adoption, and natural ingredient scrutiny is fundamentally reshaping pectin consumption patterns by establishing performance benchmarks, quality expectations, and consumer acceptance of premium-priced natural ingredients. Health-focused consumers specify authenticated pectins with documented functional benefits, regulatory compliance, and clean-label credentials differentiating offerings from synthetic alternatives of uncertain consumer appeal. These consumers drive quality control processes, health claim verification, and ingredient transparency creating industry demand enabling premium positioning and repeat purchase behavior. The health-conscious segment's growth creates concentrated pectin demand from food manufacturers targeting wellness-positioned products, with formulation decisions emphasizing natural functionality, regulatory compliance, and consumer acceptance documentation.

Functional Food Innovation Addressing Dietary Fiber Requirements

Japan's food processing sector confronts growing consumer demand for functional benefits driving innovation in fiber-fortified products, reduced-sugar formulations, and health-positioned applications where pectin provides soluble fiber content enabling nutritional claims and regulatory compliance. Functional food certifications including health claim approvals provide verification of pectin's dietary benefits and nutritional positioning, with functional products commanding premium positioning in health-focused applications where customers demand documentation of wellness benefits and regulatory approval. Corporate wellness policies, particularly among health-conscious consumers, establish consumption preferences favoring functional ingredients demonstrating health benefits and nutritional enhancement.
Analysis of Japan Pectin Industry by Key Region

Pectin Industry Analysis In Japan Cagr Analysis By Country

Region CAGR (2025-2035)
Tokyo 8.9%
Osaka 8.5%
Nagoya 8.2%
Kyushu 7.8%
Hokkaido 7.5%
Tohoku 7.2%

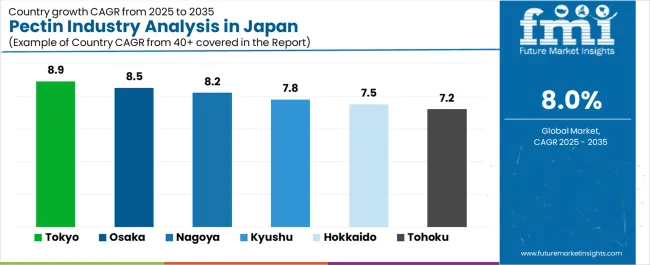
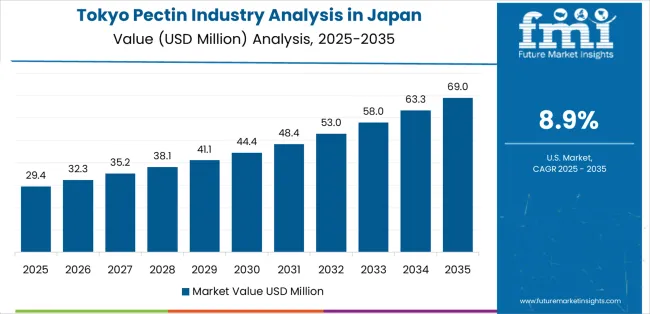
Japan pectin industry demonstrates significant regional variation in growth patterns, driven by diverse factors including food processing industry concentrations, beverage manufacturing clusters, health-conscious consumer populations, and premium food positioning preferences. Tokyo leads growth at 8.9% CAGR through 2035, reflecting high-end food processing and beverage manufacturing in metropolitan area and advancing functional food applications. Osaka follows at 8.5% CAGR, driven by traditional food processing excellence and premium confectionery manufacturing. Nagoya exhibits 8.2% growth supported by industrial food processing capabilities and dairy product manufacturing expansion.
Tokyo Leads National Growth with Food Processing Hub

Pectin Industry Analysis In Japan Country Value Analysis

Demand for pectin in Tokyo is projected to grow at 8.9% CAGR through 2035, the highest growth rate nationally, driven by concentrated food processing and beverage manufacturing operations in metropolitan area, advanced functional food development serving health-conscious urban consumers, and premium ingredient applications incorporating clean-label positioning. Tokyo's position as Japan's economic center creates concentrated affluent consumer population pursuing health-positioned food products with natural ingredient formulations, specialty applications, and premium quality standards differentiating products in competitive metropolitan food industrys.

The region's food manufacturing sector, particularly clustered in Tokyo and surrounding prefectures, demonstrates leading technical advancement through adoption of specialty pectin grades, quality management systems, and health-focused production serving domestic premium industrys. These manufacturers increasingly utilize authenticated pectins meeting strict quality standards and health claim requirements necessary for premium positioning and consumer acceptance in sophisticated urban industrys.

  • Concentrated food processing operations and health-conscious urban consumers are creating significant pectin demand across Tokyo's food manufacturing concentrations and premium product segments.
  • Advanced functional food development and clean-label requirements are driving adoption of specialty pectin grades meeting premium quality standards and health claim regulations for metropolitan consumer applications.

Osaka Demonstrates Strong Growth with Food Processing Excellence

Demand for pectin in Osaka is expanding at 8.5% CAGR, driven by traditional food processing excellence in Osaka-Kyoto-Kobe corridor, premium confectionery manufacturing serving domestic and export industrys, and beverage industry development incorporating natural stabilization solutions. Osaka's position as western Japan's commercial center creates established food processing infrastructure with quality-focused manufacturers pursuing premium ingredient formulations, technical innovation, and brand differentiation.

The region's confectionery sector, particularly concentrated in Osaka and surrounding areas, demonstrates strong growth through premium product development, export-oriented manufacturing, and traditional Japanese sweets innovation incorporating natural gelling agents. These applications favor authenticated pectins providing premium positioning and cultural authenticity alignment with consumer expectations for quality and tradition.

  • Traditional food processing excellence and premium confectionery manufacturing are facilitating pectin demand throughout Osaka's established food industry concentrations and quality-focused applications.
  • Export-oriented production and cultural food traditions establish Osaka as important industry for specialty pectins serving premium domestic and international food manufacturing applications.

Nagoya Shows Strong Expansion with Industrial Processing

Demand for pectin in Nagoya is growing at 8.2% CAGR, supported by industrial food processing capabilities in metropolitan area, dairy product manufacturing expansion serving health-conscious consumers, and beverage industry development requiring stabilization solutions. Nagoya's industrial infrastructure creates efficient food processing operations with established supply chains, technical capabilities, and quality management systems supporting ingredient innovation.

The region's dairy industry demonstrates particularly strong growth through functional dairy product development, health-positioned formulations, and premium positioning addressing aging population dietary requirements. These applications specify natural stabilization solutions including pectin for texture management and clean-label positioning.

  • Industrial food processing capabilities and dairy product manufacturing expansion are creating pectin demand throughout Nagoya's efficient manufacturing operations and health-focused product development.
  • Established supply chain infrastructure and technical capabilities establish Nagoya as growth industry for functional pectins, with manufacturing efficiency and quality focus supporting ingredient innovation requirements.

Kyushu Maintains Growth with Beverage and Confectionery Focus

Demand for pectin in Kyushu is expanding at 7.8% CAGR, driven by beverage manufacturing operations serving domestic industrys, confectionery production utilizing traditional and modern applications, and regional food specialties incorporating natural gelling solutions. The region's food processing sector demonstrates steady growth through established manufacturing capabilities and regional brand development.

Regional beverage manufacturers demonstrate consistent pectin consumption through functional drink development, traditional beverage applications, and health-positioned product innovation addressing consumer wellness preferences. Confectionery applications maintain steady demand for natural gelling agents enabling traditional and contemporary sweet products.

  • Beverage manufacturing operations and confectionery production are creating consistent pectin demand throughout Kyushu's established food processing capabilities and regional brand development.
  • Regional food specialties and traditional applications establish Kyushu as steady industry for natural pectins serving both traditional and contemporary food manufacturing requirements.

Hokkaido Shows Growth with Dairy and Food Processing Applications

Demand for pectin in Hokkaido is projected to expand at 7.5% CAGR, driven by dairy industry leadership requiring natural stabilization solutions, food processing operations serving quality-focused consumers, and premium positioning reflecting regional reputation for food quality. Hokkaido's agricultural foundation creates supply chain advantages for food processing operations emphasizing natural ingredients and quality positioning.

The region's dairy sector, including yogurt manufacturing, dessert production, and functional dairy applications, demonstrates growing pectin utilization for texture management, stability enhancement, and clean-label positioning meeting consumer preferences for natural ingredients and health benefits.

  • Dairy industry leadership and food processing excellence are facilitating pectin adoption throughout Hokkaido's quality-focused manufacturing operations and premium product positioning.
  • Agricultural foundation and quality reputation establish Hokkaido as growth industry for natural pectins, with supply chain advantages supporting ingredient innovation and premium food manufacturing.

Tohoku Maintains Steady Growth with Regional Food Processing

Demand for pectin in Tohoku is growing at 7.2% CAGR, supported by regional food processing operations serving local and national industrys, fruit processing applications utilizing natural gelling solutions, and traditional food manufacturing incorporating contemporary ingredient innovations. The region's food industry demonstrates steady development through established processing capabilities and regional specialization.

Regional fruit processing operations, including jam manufacturing, preserve production, and traditional food applications, maintain consistent pectin consumption for gelling functionality and natural ingredient positioning meeting consumer preferences for authentic regional products.
  • Regional food processing operations and fruit processing applications are creating steady pectin demand throughout Tohoku's established manufacturing capabilities and traditional food production.
  • Regional specialization and traditional food manufacturing establish Tohoku as consistent industry for natural pectins serving both traditional applications and contemporary food processing requirements.

Competitive Landscape of Japan Pectin Industry

Pectin Industry Analysis In Japan Analysis By Company

Japan pectin industry is defined by competition among global specialty ingredient suppliers incorporating advanced pectin production, domestic food ingredient companies focusing on local industry access and customer relationships, and international trading houses serving technical distribution and industry development. Manufacturers are investing in specialty grade development demonstrating enhanced functionality and quality credentials, technical service capabilities enhancing application support and customer collaboration, organic certification systems enabling premium positioning and health-conscious consumer appeal, and comprehensive quality management networks ensuring consistency and regulatory compliance across food processing applications.

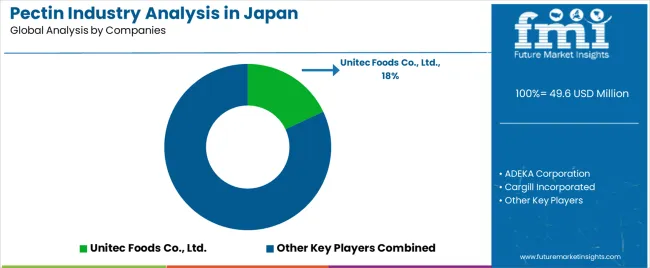
Unitec Foods Co. Ltd., based in Japan and serving domestic industrys, leads with approximately 18.0% share through comprehensive technical service capabilities including application development and customer support, extensive domestic distribution network reaching food processors and beverage manufacturers, and specialized product portfolio emphasizing quality consistency and regulatory compliance. ADEKA Corporation, headquartered in Tokyo, provides specialty chemical and food ingredient solutions including pectin products emphasizing technical innovation, quality management, and domestic industry expertise.

Cargill Incorporated offers global ingredient solutions including pectin products with focus on technical service, quality consistency, and application development partnerships. Ingredion Incorporated delivers comprehensive ingredient solutions targeting food processing applications with emphasis on functionality, technical support, and regulatory compliance. CP Kelco provides specialized hydrocolloid solutions including advanced pectin grades emphasizing technical performance and application-specific development.

Key Players in Japan Pectin Industry

  • Unitec Foods Co., Ltd.
  • ADEKA Corporation
  • Cargill Incorporated
  • Ingredion Incorporated
  • CP Kelco (J.M. Huber Corporation)
  • DuPont Nutrition & Biosciences
  • Herbstreith & Fox KG
  • Silvateam S.p.A.
  • Naturex (Givaudan)
  • Yantai Andre Pectin Co., Ltd.

Scope of the Report

Item Value
Quantitative Units (2025) USD 107.1 million
Product Type Low Methoxyl Pectin (conventional LM pectin, amidated LM pectin, organic certified LM pectin), High Methoxyl Pectin (rapid-set HM pectin, slow-set HM pectin, organic certified HM pectin)
Application Jams & Jellies (traditional high-sugar jams, reduced-sugar preserves, sugar-free fruit spreads), Beverages (fiber-fortified functional drinks, fruit juice beverages, dairy beverage stabilization), Bakery Fillings & Toppings, Dairy Products & Frozen Desserts, Confectionery
Source Material Citrus pectin, apple pectin, sugar beet pectin, sunflower pectin, other botanical sources
Quality Grades Food grade, pharmaceutical grade, organic certified, non-GMO verified
Regions Covered Tokyo, Osaka, Nagoya, Kyushu, Hokkaido, Tohoku
Key Companies Profiled Unitec Foods Co. Ltd., ADEKA Corporation, Cargill Incorporated, Ingredion Incorporated, CP Kelco, DuPont Nutrition & Biosciences, Herbstreith & Fox, Silvateam, Naturex (Givaudan), Yantai Andre Pectin
Additional Attributes Revenue analysis by product type and application categories, Japanese food industry consumption patterns, competitive landscape with global suppliers and domestic distributors, food manufacturer preferences for quality consistency and technical support, regulatory environment and health claim opportunities, innovations in specialty pectin grades and clean-label formulations, development of reduced-sugar applications with maintained sensory quality and functional performance

Japan Pectin Industry by Segments

Product Type:

  • Low Methoxyl Pectin (LM Pectin)
    • Conventional LM Pectin
    • Amidated LM Pectin
    • Organic Certified LM Pectin
  • High Methoxyl Pectin (HM Pectin)
    • Rapid-Set HM Pectin
    • Slow-Set HM Pectin
    • Organic Certified HM Pectin

Application:

  • Jams & Jellies
    • Traditional High-Sugar Jams
    • Reduced-Sugar Preserves
    • Sugar-Free Fruit Spreads
  • Beverages
    • Fiber-Fortified Functional Drinks
    • Fruit Juice Beverages
    • Dairy Beverage Stabilization
  • Bakery Fillings & Toppings
  • Dairy Products & Frozen Desserts
  • Confectionery

Source Material:

  • Citrus Pectin
  • Apple Pectin
  • Sugar Beet Pectin
  • Other Botanical Sources

Quality Grades:

  • Food Grade
  • Pharmaceutical Grade
  • Organic Certified
  • Non-GMO Verified

Frequently Asked Questions

How big is the pectin industry analysis in japan in 2025?

The global pectin industry analysis in japan is estimated to be valued at USD 49.6 million in 2025.

What will be the size of pectin industry analysis in japan in 2035?

The market size for the pectin industry analysis in japan is projected to reach USD 107.1 million by 2035.

How much will be the pectin industry analysis in japan growth between 2025 and 2035?

The pectin industry analysis in japan is expected to grow at a 8.0% CAGR between 2025 and 2035.

What are the key product types in the pectin industry analysis in japan?

The key product types in pectin industry analysis in japan are low methoxyl pectin and high methoxyl pectin (hm pectin).

Which application segment to contribute significant share in the pectin industry analysis in japan in 2025?

In terms of application, beverages segment to command 22.3% share in the pectin industry analysis in japan in 2025.

Table of Content

  1. Executive Summary
    • Global Market Outlook
    • Demand to side Trends
    • Supply to side Trends
    • Technology Roadmap Analysis
    • Analysis and Recommendations
  2. Market Overview
    • Market Coverage / Taxonomy
    • Market Definition / Scope / Limitations
  3. Market Background
    • Market Dynamics
      • Drivers
      • Restraints
      • Opportunity
      • Trends
    • Scenario Forecast
      • Demand in Optimistic Scenario
      • Demand in Likely Scenario
      • Demand in Conservative Scenario
    • Opportunity Map Analysis
    • Product Life Cycle Analysis
    • Supply Chain Analysis
    • Investment Feasibility Matrix
    • Value Chain Analysis
    • PESTLE and Porter’s Analysis
    • Regulatory Landscape
    • Regional Parent Market Outlook
    • Production and Consumption Statistics
    • Import and Export Statistics
  4. Global Market Analysis 2020 to 2024 and Forecast, 2025 to 2035
    • Historical Market Size Value (USD Million) Analysis, 2020 to 2024
    • Current and Future Market Size Value (USD Million) Projections, 2025 to 2035
      • Y to o to Y Growth Trend Analysis
      • Absolute $ Opportunity Analysis
  5. Global Market Pricing Analysis 2020 to 2024 and Forecast 2025 to 2035
  6. Global Market Analysis 2020 to 2024 and Forecast 2025 to 2035, By Product Type
    • Introduction / Key Findings
    • Historical Market Size Value (USD Million) Analysis By Product Type , 2020 to 2024
    • Current and Future Market Size Value (USD Million) Analysis and Forecast By Product Type , 2025 to 2035
      • Low Methoxyl Pectin
      • High Methoxyl Pectin (HM Pectin)
    • Y to o to Y Growth Trend Analysis By Product Type , 2020 to 2024
    • Absolute $ Opportunity Analysis By Product Type , 2025 to 2035
  7. Global Market Analysis 2020 to 2024 and Forecast 2025 to 2035, By Application
    • Introduction / Key Findings
    • Historical Market Size Value (USD Million) Analysis By Application, 2020 to 2024
    • Current and Future Market Size Value (USD Million) Analysis and Forecast By Application, 2025 to 2035
      • Beverages
      • Jams & Jellies
      • Bakery Fillings & Toppings
      • Dairy Products & Frozen Desserts
      • Confectionery
    • Y to o to Y Growth Trend Analysis By Application, 2020 to 2024
    • Absolute $ Opportunity Analysis By Application, 2025 to 2035
  8. Global Market Analysis 2020 to 2024 and Forecast 2025 to 2035, By Region
    • Introduction
    • Historical Market Size Value (USD Million) Analysis By Region, 2020 to 2024
    • Current Market Size Value (USD Million) Analysis and Forecast By Region, 2025 to 2035
      • North America
      • Latin America
      • Western Europe
      • Eastern Europe
      • East Asia
      • South Asia and Pacific
      • Middle East & Africa
    • Market Attractiveness Analysis By Region
  9. North America Market Analysis 2020 to 2024 and Forecast 2025 to 2035, By Country
    • Historical Market Size Value (USD Million) Trend Analysis By Market Taxonomy, 2020 to 2024
    • Market Size Value (USD Million) Forecast By Market Taxonomy, 2025 to 2035
      • By Country
        • USA
        • Canada
        • Mexico
      • By Product Type
      • By Application
    • Market Attractiveness Analysis
      • By Country
      • By Product Type
      • By Application
    • Key Takeaways
  10. Latin America Market Analysis 2020 to 2024 and Forecast 2025 to 2035, By Country
    • Historical Market Size Value (USD Million) Trend Analysis By Market Taxonomy, 2020 to 2024
    • Market Size Value (USD Million) Forecast By Market Taxonomy, 2025 to 2035
      • By Country
        • Brazil
        • Chile
        • Rest of Latin America
      • By Product Type
      • By Application
    • Market Attractiveness Analysis
      • By Country
      • By Product Type
      • By Application
    • Key Takeaways
  11. Western Europe Market Analysis 2020 to 2024 and Forecast 2025 to 2035, By Country
    • Historical Market Size Value (USD Million) Trend Analysis By Market Taxonomy, 2020 to 2024
    • Market Size Value (USD Million) Forecast By Market Taxonomy, 2025 to 2035
      • By Country
        • Germany
        • UK
        • Italy
        • Spain
        • France
        • Nordic
        • BENELUX
        • Rest of Western Europe
      • By Product Type
      • By Application
    • Market Attractiveness Analysis
      • By Country
      • By Product Type
      • By Application
    • Key Takeaways
  12. Eastern Europe Market Analysis 2020 to 2024 and Forecast 2025 to 2035, By Country
    • Historical Market Size Value (USD Million) Trend Analysis By Market Taxonomy, 2020 to 2024
    • Market Size Value (USD Million) Forecast By Market Taxonomy, 2025 to 2035
      • By Country
        • Russia
        • Poland
        • Hungary
        • Balkan & Baltic
        • Rest of Eastern Europe
      • By Product Type
      • By Application
    • Market Attractiveness Analysis
      • By Country
      • By Product Type
      • By Application
    • Key Takeaways
  13. East Asia Market Analysis 2020 to 2024 and Forecast 2025 to 2035, By Country
    • Historical Market Size Value (USD Million) Trend Analysis By Market Taxonomy, 2020 to 2024
    • Market Size Value (USD Million) Forecast By Market Taxonomy, 2025 to 2035
      • By Country
        • China
        • Japan
        • South Korea
      • By Product Type
      • By Application
    • Market Attractiveness Analysis
      • By Country
      • By Product Type
      • By Application
    • Key Takeaways
  14. South Asia and Pacific Market Analysis 2020 to 2024 and Forecast 2025 to 2035, By Country
    • Historical Market Size Value (USD Million) Trend Analysis By Market Taxonomy, 2020 to 2024
    • Market Size Value (USD Million) Forecast By Market Taxonomy, 2025 to 2035
      • By Country
        • India
        • ASEAN
        • Australia & New Zealand
        • Rest of South Asia and Pacific
      • By Product Type
      • By Application
    • Market Attractiveness Analysis
      • By Country
      • By Product Type
      • By Application
    • Key Takeaways
  15. Middle East & Africa Market Analysis 2020 to 2024 and Forecast 2025 to 2035, By Country
    • Historical Market Size Value (USD Million) Trend Analysis By Market Taxonomy, 2020 to 2024
    • Market Size Value (USD Million) Forecast By Market Taxonomy, 2025 to 2035
      • By Country
        • Kingdom of Saudi Arabia
        • Other GCC Countries
        • Turkiye
        • South Africa
        • Other African Union
        • Rest of Middle East & Africa
      • By Product Type
      • By Application
    • Market Attractiveness Analysis
      • By Country
      • By Product Type
      • By Application
    • Key Takeaways
  16. Key Countries Market Analysis
    • USA
      • Pricing Analysis
      • Market Share Analysis, 2024
        • By Product Type
        • By Application
    • Canada
      • Pricing Analysis
      • Market Share Analysis, 2024
        • By Product Type
        • By Application
    • Mexico
      • Pricing Analysis
      • Market Share Analysis, 2024
        • By Product Type
        • By Application
    • Brazil
      • Pricing Analysis
      • Market Share Analysis, 2024
        • By Product Type
        • By Application
    • Chile
      • Pricing Analysis
      • Market Share Analysis, 2024
        • By Product Type
        • By Application
    • Germany
      • Pricing Analysis
      • Market Share Analysis, 2024
        • By Product Type
        • By Application
    • UK
      • Pricing Analysis
      • Market Share Analysis, 2024
        • By Product Type
        • By Application
    • Italy
      • Pricing Analysis
      • Market Share Analysis, 2024
        • By Product Type
        • By Application
    • Spain
      • Pricing Analysis
      • Market Share Analysis, 2024
        • By Product Type
        • By Application
    • France
      • Pricing Analysis
      • Market Share Analysis, 2024
        • By Product Type
        • By Application
    • India
      • Pricing Analysis
      • Market Share Analysis, 2024
        • By Product Type
        • By Application
    • ASEAN
      • Pricing Analysis
      • Market Share Analysis, 2024
        • By Product Type
        • By Application
    • Australia & New Zealand
      • Pricing Analysis
      • Market Share Analysis, 2024
        • By Product Type
        • By Application
    • China
      • Pricing Analysis
      • Market Share Analysis, 2024
        • By Product Type
        • By Application
    • Japan
      • Pricing Analysis
      • Market Share Analysis, 2024
        • By Product Type
        • By Application
    • South Korea
      • Pricing Analysis
      • Market Share Analysis, 2024
        • By Product Type
        • By Application
    • Russia
      • Pricing Analysis
      • Market Share Analysis, 2024
        • By Product Type
        • By Application
    • Poland
      • Pricing Analysis
      • Market Share Analysis, 2024
        • By Product Type
        • By Application
    • Hungary
      • Pricing Analysis
      • Market Share Analysis, 2024
        • By Product Type
        • By Application
    • Kingdom of Saudi Arabia
      • Pricing Analysis
      • Market Share Analysis, 2024
        • By Product Type
        • By Application
    • Turkiye
      • Pricing Analysis
      • Market Share Analysis, 2024
        • By Product Type
        • By Application
    • South Africa
      • Pricing Analysis
      • Market Share Analysis, 2024
        • By Product Type
        • By Application
  17. Market Structure Analysis
    • Competition Dashboard
    • Competition Benchmarking
    • Market Share Analysis of Top Players
      • By Regional
      • By Product Type
      • By Application
  18. Competition Analysis
    • Competition Deep Dive
      • Value (USD Million)ec Foods Co., Ltd.
        • Overview
        • Product Portfolio
        • Profitability by Market Segments (Product/Age /Sales Channel/Region)
        • Sales Footprint
        • Strategy Overview
          • Marketing Strategy
          • Product Strategy
          • Channel Strategy
      • ADEKA Corporation
      • Cargill Incorporated
      • Ingredion Incorporated
      • CP Kelco (J.M. Huber Corporation)
      • DuPont Nutrition & Biosciences
      • Herbstreith & Fox KG
      • Silvateam S.p.A.
      • Naturex (Givaudan)
      • Yantai Andre Pectin Co., Ltd.
      • TIC Gums (Ingredion)
      • Ceamsa (Esteve Group)
      • Pacific Pectin Inc.
      • Krishna Pectins
      • Jinfeng Pectin
  19. Assumptions & Acronyms Used
  20. Research Methodology

List of Tables

  • Table 1: Global Market Value (USD Million) Forecast by Region, 2020 to 2035
  • Table 2: Global Market Value (USD Million) Forecast by Product Type , 2020 to 2035
  • Table 3: Global Market Value (USD Million) Forecast by Application, 2020 to 2035
  • Table 4: North America Market Value (USD Million) Forecast by Country, 2020 to 2035
  • Table 5: North America Market Value (USD Million) Forecast by Product Type , 2020 to 2035
  • Table 6: North America Market Value (USD Million) Forecast by Application, 2020 to 2035
  • Table 7: Latin America Market Value (USD Million) Forecast by Country, 2020 to 2035
  • Table 8: Latin America Market Value (USD Million) Forecast by Product Type , 2020 to 2035
  • Table 9: Latin America Market Value (USD Million) Forecast by Application, 2020 to 2035
  • Table 10: Western Europe Market Value (USD Million) Forecast by Country, 2020 to 2035
  • Table 11: Western Europe Market Value (USD Million) Forecast by Product Type , 2020 to 2035
  • Table 12: Western Europe Market Value (USD Million) Forecast by Application, 2020 to 2035
  • Table 13: Eastern Europe Market Value (USD Million) Forecast by Country, 2020 to 2035
  • Table 14: Eastern Europe Market Value (USD Million) Forecast by Product Type , 2020 to 2035
  • Table 15: Eastern Europe Market Value (USD Million) Forecast by Application, 2020 to 2035
  • Table 16: East Asia Market Value (USD Million) Forecast by Country, 2020 to 2035
  • Table 17: East Asia Market Value (USD Million) Forecast by Product Type , 2020 to 2035
  • Table 18: East Asia Market Value (USD Million) Forecast by Application, 2020 to 2035
  • Table 19: South Asia and Pacific Market Value (USD Million) Forecast by Country, 2020 to 2035
  • Table 20: South Asia and Pacific Market Value (USD Million) Forecast by Product Type , 2020 to 2035
  • Table 21: South Asia and Pacific Market Value (USD Million) Forecast by Application, 2020 to 2035
  • Table 22: Middle East & Africa Market Value (USD Million) Forecast by Country, 2020 to 2035
  • Table 23: Middle East & Africa Market Value (USD Million) Forecast by Product Type , 2020 to 2035
  • Table 24: Middle East & Africa Market Value (USD Million) Forecast by Application, 2020 to 2035

List of Figures

  • Figure 1: Global Market Pricing Analysis
  • Figure 2: Global Market Value (USD Million) Forecast 2020-2035
  • Figure 3: Global Market Value Share and BPS Analysis by Product Type , 2025 and 2035
  • Figure 4: Global Market Y to o to Y Growth Comparison by Product Type , 2025-2035
  • Figure 5: Global Market Attractiveness Analysis by Product Type
  • Figure 6: Global Market Value Share and BPS Analysis by Application, 2025 and 2035
  • Figure 7: Global Market Y to o to Y Growth Comparison by Application, 2025-2035
  • Figure 8: Global Market Attractiveness Analysis by Application
  • Figure 9: Global Market Value (USD Million) Share and BPS Analysis by Region, 2025 and 2035
  • Figure 10: Global Market Y to o to Y Growth Comparison by Region, 2025-2035
  • Figure 11: Global Market Attractiveness Analysis by Region
  • Figure 12: North America Market Incremental Dollar Opportunity, 2025-2035
  • Figure 13: Latin America Market Incremental Dollar Opportunity, 2025-2035
  • Figure 14: Western Europe Market Incremental Dollar Opportunity, 2025-2035
  • Figure 15: Eastern Europe Market Incremental Dollar Opportunity, 2025-2035
  • Figure 16: East Asia Market Incremental Dollar Opportunity, 2025-2035
  • Figure 17: South Asia and Pacific Market Incremental Dollar Opportunity, 2025-2035
  • Figure 18: Middle East & Africa Market Incremental Dollar Opportunity, 2025-2035
  • Figure 19: North America Market Value Share and BPS Analysis by Country, 2025 and 2035
  • Figure 20: North America Market Value Share and BPS Analysis by Product Type , 2025 and 2035
  • Figure 21: North America Market Y to o to Y Growth Comparison by Product Type , 2025-2035
  • Figure 22: North America Market Attractiveness Analysis by Product Type
  • Figure 23: North America Market Value Share and BPS Analysis by Application, 2025 and 2035
  • Figure 24: North America Market Y to o to Y Growth Comparison by Application, 2025-2035
  • Figure 25: North America Market Attractiveness Analysis by Application
  • Figure 26: Latin America Market Value Share and BPS Analysis by Country, 2025 and 2035
  • Figure 27: Latin America Market Value Share and BPS Analysis by Product Type , 2025 and 2035
  • Figure 28: Latin America Market Y to o to Y Growth Comparison by Product Type , 2025-2035
  • Figure 29: Latin America Market Attractiveness Analysis by Product Type
  • Figure 30: Latin America Market Value Share and BPS Analysis by Application, 2025 and 2035
  • Figure 31: Latin America Market Y to o to Y Growth Comparison by Application, 2025-2035
  • Figure 32: Latin America Market Attractiveness Analysis by Application
  • Figure 33: Western Europe Market Value Share and BPS Analysis by Country, 2025 and 2035
  • Figure 34: Western Europe Market Value Share and BPS Analysis by Product Type , 2025 and 2035
  • Figure 35: Western Europe Market Y to o to Y Growth Comparison by Product Type , 2025-2035
  • Figure 36: Western Europe Market Attractiveness Analysis by Product Type
  • Figure 37: Western Europe Market Value Share and BPS Analysis by Application, 2025 and 2035
  • Figure 38: Western Europe Market Y to o to Y Growth Comparison by Application, 2025-2035
  • Figure 39: Western Europe Market Attractiveness Analysis by Application
  • Figure 40: Eastern Europe Market Value Share and BPS Analysis by Country, 2025 and 2035
  • Figure 41: Eastern Europe Market Value Share and BPS Analysis by Product Type , 2025 and 2035
  • Figure 42: Eastern Europe Market Y to o to Y Growth Comparison by Product Type , 2025-2035
  • Figure 43: Eastern Europe Market Attractiveness Analysis by Product Type
  • Figure 44: Eastern Europe Market Value Share and BPS Analysis by Application, 2025 and 2035
  • Figure 45: Eastern Europe Market Y to o to Y Growth Comparison by Application, 2025-2035
  • Figure 46: Eastern Europe Market Attractiveness Analysis by Application
  • Figure 47: East Asia Market Value Share and BPS Analysis by Country, 2025 and 2035
  • Figure 48: East Asia Market Value Share and BPS Analysis by Product Type , 2025 and 2035
  • Figure 49: East Asia Market Y to o to Y Growth Comparison by Product Type , 2025-2035
  • Figure 50: East Asia Market Attractiveness Analysis by Product Type
  • Figure 51: East Asia Market Value Share and BPS Analysis by Application, 2025 and 2035
  • Figure 52: East Asia Market Y to o to Y Growth Comparison by Application, 2025-2035
  • Figure 53: East Asia Market Attractiveness Analysis by Application
  • Figure 54: South Asia and Pacific Market Value Share and BPS Analysis by Country, 2025 and 2035
  • Figure 55: South Asia and Pacific Market Value Share and BPS Analysis by Product Type , 2025 and 2035
  • Figure 56: South Asia and Pacific Market Y to o to Y Growth Comparison by Product Type , 2025-2035
  • Figure 57: South Asia and Pacific Market Attractiveness Analysis by Product Type
  • Figure 58: South Asia and Pacific Market Value Share and BPS Analysis by Application, 2025 and 2035
  • Figure 59: South Asia and Pacific Market Y to o to Y Growth Comparison by Application, 2025-2035
  • Figure 60: South Asia and Pacific Market Attractiveness Analysis by Application
  • Figure 61: Middle East & Africa Market Value Share and BPS Analysis by Country, 2025 and 2035
  • Figure 62: Middle East & Africa Market Value Share and BPS Analysis by Product Type , 2025 and 2035
  • Figure 63: Middle East & Africa Market Y to o to Y Growth Comparison by Product Type , 2025-2035
  • Figure 64: Middle East & Africa Market Attractiveness Analysis by Product Type
  • Figure 65: Middle East & Africa Market Value Share and BPS Analysis by Application, 2025 and 2035
  • Figure 66: Middle East & Africa Market Y to o to Y Growth Comparison by Application, 2025-2035
  • Figure 67: Middle East & Africa Market Attractiveness Analysis by Application
  • Figure 68: Global Market - Tier Structure Analysis
  • Figure 69: Global Market - Company Share Analysis
Dashboard
Dashboard
Dashboard
Dashboard
Dashboard
Dashboard

Full Research Suite comprises of:

Market outlook & trends analysis

Market outlook & trends analysis

Interviews & case studies

Interviews & case studies

Strategic recommendations

Strategic recommendations

Vendor profiles & capabilities analysis

Vendor profiles & capabilities analysis

5-year forecasts

5-year forecasts

8 regions and 60+ country-level data splits

8 regions and 60+ country-level data splits

Market segment data splits

Market segment data splits

12 months of continuous data updates

12 months of continuous data updates

DELIVERED AS:

PDF EXCEL ONLINE

Full Research Suite


$3500

$5000

$6500

Buy Report Now
Similar Industry Reports

Similar Industry Reports

Pectin Market
Pectin Market

Pectin Market Insights – Size, Share & Industry Growth 2025–2035

Pectin Powder Market

Pectin Powder Market Insights - Growth & Forecast 2025 to 2035

Pectin Industry Analysis in Western Europe

Western Europe Pectin Market Analysis by Product Type, Application, and Country Through 2035

USA Pectin Market
USA Pectin Market

USA Pectin Market Report – Growth, Demand & Innovations 2025-2035

Korea Pectin Market
Korea Pectin Market

Korea Pectin Market Analysis by Product Type, Application, and Region Through 2035

Fruit Pectin Market
Fruit Pectin Market

Analysis and Growth Projections for Fruit Pectin Business

Citrus Pectin Market

Citrus Pectin Market Size, Growth, and Forecast for 2025 to 2035

Sugar Beet Pectin Market

Sugar Beet Pectin Market Growth - Functional Applications & Demand 2025 to 2035

Clean Label Pectin Market

Clean Label Pectin Market Analysis – Growth & Industry Trends 2025 to 2035

Industry 4.0 Market
Industry 4.0 Market

Industry 4.0 Market

Industry Analysis of Syringe and Needle in GCC

Industry Analysis of Syringe and Needle in GCC Size and Share Forecast Outlook 2025 to 2035

Industry Analysis Non-commercial Acrylic Paint in the United States

Industry Analysis Non-commercial Acrylic Paint in the United States Size and Share Forecast Outlook 2025 to 2035

Industry Analysis of Medical Device Packaging in Southeast Asia

Industry Analysis of Medical Device Packaging in Southeast Asia Size and Share Forecast Outlook 2025 to 2035

Industry Analysis of Paper Bag in North America

Industry Analysis of Paper Bag in North America Size and Share Forecast Outlook 2025 to 2035

Industry Analysis of Lidding Film in the United States

Industry Analysis of Lidding Film in the United States Size and Share Forecast Outlook 2025 to 2035

Industry Analysis of Automotive Lightweight Body Panel in the United States

Industry Analysis of Automotive Lightweight Body Panel in the United States Size and Share Forecast Outlook 2025 to 2035

Industry Analysis of Electronic Skin in Korea

Industry Analysis of Electronic Skin in Korea Size and Share Forecast Outlook 2025 to 2035

Industry Analysis of Electronic Skin in Western Europe

Industry Analysis of Electronic Skin in Western Europe Size and Share Forecast Outlook 2025 to 2035

Industry Analysis of Outbound Tourism in Germany

Germany Outbound Tourism Market Trends – Growth & Forecast 2024-2034

Industry Analysis of Second-hand Apparel in Europe

Europe Second-hand Apparel Market Growth – Trends & Forecast 2024-2034

Future Market Insights

Pectin Industry Analysis in Japan

Chat With MaRIA

Chat With

MaRIA

Hi There, I am MaRIA, Your Market Research Intelligence Assistant. How may I help you?