Fruit Pectin Market
Market Research report analyzing Sales of Fruit Pectin Market Demand of Fruit Pectin Market and Trend Analysis of Fruit Pectin Market till 2032
Fruit Pectin Market By Product Form, Application, Function, End User & Region - Forecast 2022-2032
Fruit Pectin Market Snapshot (2022-2032)
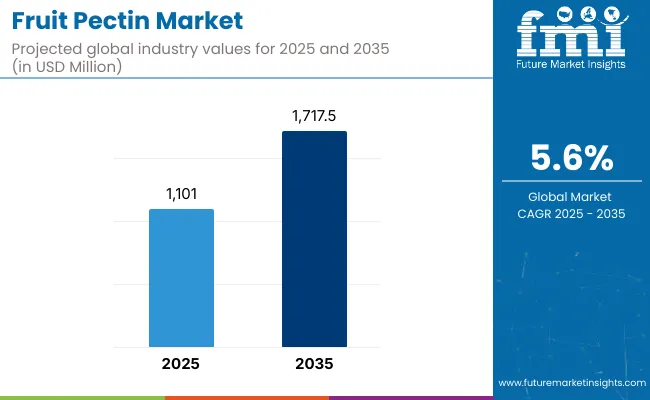
[304 Pages Report] The fruit pectin market is expected to expand at a steady CAGR of 5.6% each year, with an expected value of US$ 1,470.5 million in 2032. The major fruit pectin market is Europe. But during the past ten years, pectin has been more and more in demand everywhere, due to:
- The reduction of greenhouse gas emissions caused by disposing of the waste in landfills is achieved by extracting high-value compounds like pectin and other bioactive chemicals from fruit processing waste.
- To make it practicable in the long run, the extraction process must be environmentally friendly, long-lasting, and cost-effective. Merely using waste is not adequate.
- To create a truly eco-friendly process, it is vital to address the sustainability challenges of the current conventional process from a life cycle perspective.
Report Attribute |
Key Statistics |
Growth Rate (2016-2021) |
4.2% CAGR |
Projected Growth Rate (2022-2032) |
5.6% CAGR |
Expected Market Value (2022) |
US$ 942.6 Million |
Anticipated Forecast Value (2032) |
US$ 1,470.5 Million |
Let us know your requirement to get
100% FREE customization
Sustainability is Acting Sweet for the Fruit Pectin Market
Fruit pectin demand is at an all-time high, driven by worldwide trends toward sugar reduction, label-friendly formulation, and the ubiquity of dairy drinks with fruit flavors. Customers seek out cutting-edge, novel items that provide the vegan and label-friendly choices they demand. Several industries, including baking, beverages, pharmaceuticals, and food supplements, are seeing an increase in demand for fruit pectin. End-use sectors are substituting some of the conventionally employed materials with more organic and healthful goods. The need for homemade fruit pectin is generated by both businesses and households.
Europe Fruit Pectin Market Expanding Significantly
Fruit pectin is now predominantly offered for industrial application due to lifestyle changes. Demand for fruit pectin is high in Europe, as it is still offered to customers as an incorporated part of gelling sugar in various European markets.
Moreover, fruit pectin is widely thought to be an incredibly safe food addiction, and several food additive laws govern both its composition and application. Additionally, FAO and WHO-recognized International Codex Alimentarius recognize it.
Pectin is also approved for use in all non-standard foods by the United States Food and Drug Administration (USFDA), which classifies it as GRAS (Generally Recognized as Safe). In terms of the product's commercial potential, the IPPA believes that good quality, organically produced pectin raw ingredients are currently not readily available in significant amounts.
Find your sweet spots for generating winning opportunities in this market.
Talk to AnalystImports Respond in Favour of Fruit Pectin Market Growth in India
Pectin imports to India have increased during the past few years. India's pectin imports increased from $4.84 million in 2012 to $8.15 million in 2013, according to the Ministry of Commerce (GoI).
The value of imports in 2014 was $10.14 million, continuing the trend. Fruit pectin is imported from several international markets by multinational companies, such as Hindustan Unilever, Nestle, GlaxoSmithKline, Kellogg's, and many more. Imported pectin is also used by all significant producers of dairy products and food products.
Heavy Investments by Manufacturers are benefiting the Demand for Fruit Pectin
The new plant's processes, technology, and controls are intended to deliver the high levels of functionality, application, and ingredient performance that customers want. To guarantee strong product functioning for consumers, firms who invested in new plants have put in place raw material quality controls at the point of entry, as well as in-line controls.
Cargill funded $150 million in a new HM (High Methoxyl) pectin plant in Bebedouro, Brazil, which started operations in September 2021, to help supply the demand for fruit pectin. The facility creates goods for the portfolio of high-methoxyl (HM) pectin, which is used in dairy drinks, juice drinks, jams, and confectionery.
Additionally, Cargill has a plan to leverage its high-quality and dependable UnipectineTM offering to establish itself as a substantial and long-lasting leader in the global fruit pectin industry.
Apples, lemons and limes and oranges contain large quantities of pectin. It has amazing properties that help to prepare healthy and delicious food. Pectin Extraction Citrus peel and apple pomace contain other natural substances, like solid fibres, that are not desired in the jellying processes, so the pectin must be extracted and separated from them.
Extraction is done in hot acidulated water, were pectin dissolves at the right temperature after a certain amount of time. Undesired solids are separated through mechanical and filtration processes, until all solids are removed.
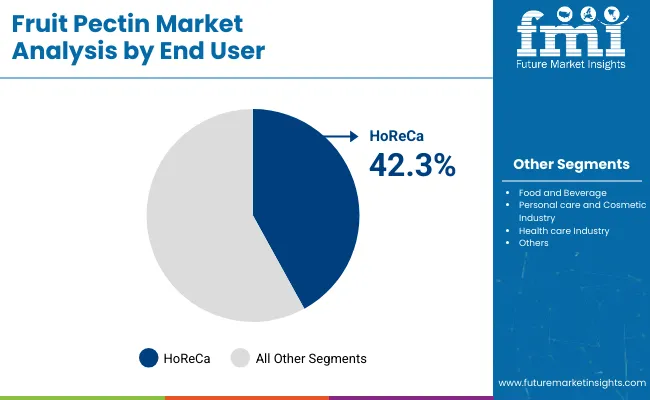
When pectin is heated with sugar, it acts as a gelling agent, stabilizer and thickening agent in foods. Around 90% of the fruit pectin is used in the food & beverage industry followed by healthcare, personal care, cosmetics, and other packaging purpose.

A unified Market Research Subscription Platform, built for today's disparate research needs.
What are Some Prominent Drivers Spearheading Fruit Pectin Market Growth?
Enhanced Consumption of Functional Foods to Augment Fruit Pectin Use
Functional foods today play a vital role in disease prevention and health promotion. Contemporary consumers are seeking out customizable foods, beverages and dietary solutions which help enhance nutritional and personal health goals. According to the U.S Census of 2020, with 109 million Americans aged 50 or older, and 48 million aged over 65, lifestyle issues and conditions of aging are anticipated to drive functional foods consumption in forthcoming years.
A major part of these functional foods comprise of fruits or fruit-derived food products. Recently, pectin and pectin-derived oligosaccharides are being used as important ingredients in functional foods. This also includes fruit pectin. There are various documented instances wherein food derived pectin have proven highly effective in reducing the incidence of various chronic ailments among the elderly demographics.
The most common type of fruit pectin is apple derived. Approximately 15-20% of apple pulp comprises of this important functional ingredient. Some key benefits of apple based pectin include maintenance of the gut microbiome, promoting weight loss, regulating blood sugar levels and maintaining a healthy heart. Adults who consume 5-20 grams of apple pectin with orange juice experienced a feeling of fullness, reducing excessive food intake and achieving weight loss.
What are the Challenges Faced by the Fruit Pectin Industry?
No market is devoid of challenges and the global fruit pectin market is no exception. One of the primary factors restraining market growth is the increased use of substitutes like Xanthan and guar.
Increasing prices of fruit pectin along with processing cost, and the occurrence of devastated a citrus greening disease may hamper the growth of fruit pectin market in near future.
Why is North America Emerging as an Opportunistic Fruit Pectin Market?
North America was the largest market for the fruit pectin market and the trend is expected to continue into the forecast period owing to the high production of fruit pectin in the region. With the high consumption of processed food, advanced technology, high disposable income, and rising demand for diet carbonated drinks and sugar-free products in North America demand for fruit pectin is anticipated to rise in the region. The rapidly growing food and beverage sector and the growing popularity of vegetarian food among the population further drive the growth of the fruit pectin market.
Increased consumption of foods and food items with possible health advantages has stemmed from consumers' desire to live a better lifestyle. Consumers are more aware of their dietary habits. All these factors boost the growth of the market in the region. Europe accounts for a total 32.7% share in the global fruit pectin market.
How is Europe Contributing to the Growth of the Fruit Pectin Market?
According to Future Market Insights, Europe is expected to provide immense growth opportunities for the fruit pectin market, due to the increasing demand for fruit pectin in the cosmetic and personal care industry Europe’s fruit pectin market accounts for 27.4%share of the total global fruit pectin market.
The increasing trend of natural, organic, and environment-friendly products drives the fruit pectin market in the region. Also, growing application areas of hydrocolloids, such as controlling the thickening and gelling properties of aqueous foods, as well as the natural property of hydrocolloids, are driving market development boost the demand for fruit pectin in the region.
Will the Asia Pacific emerge as an Attractive Fruit Pectin Market?
The Asia Pacific will continue to account for a leading share of the global fruit pectin market due to the rising demand for personal care products in the Asia Pacific. The ever-increasing market for natural personal care items and cosmetics is expected to result in record-breaking sales of the ingredients used in these products.
Over the assessment period, revenue from sales of personal care items and ingredients is expected to rise significantly in countries such as India, China, Southeast Asia, and Japan.
Start-up Scenario
Maple biotech PVT ltd, Mirtillo, Zio Chemical, and DSM Andre Pectin are some of the startup companies operating in fruit pectin market.
- Mirtillo International is the leading sales & marketing company of specialty food ingredients in India and also represents some of the global food ingredients producers of Europe, USA & Asia Pacific.
Market Competition
Some of the key participants present in the global fruit pectin market include CP Kelco, Cargill Inc., Devson Impex Pvt. Ltd., Nestlé S.A., Danone S.A., Unilever, Kellogg NA Co., Yantai Andre Pectin Co. Ltd., Danisco A/S, and B&V srl. among others.
Attributed to the presence of such a high number of participants, the market is highly competitive. While global players such as CP Kelco, Cargill Inc., Devson Impex Pvt. Ltd., Nestlé S.A., account for considerable market size, several regional level players are also operating across key growth regions.
- In April 2021 – CP Kelco, announced the launch of a new multimedia resource spotlighting its capabilities in action. Filled with value-creating ideas and nature-powered innovation, “Innovation… Powered by Nature” to help manufacturers in the food, beverage, home and personal care segments understand market trends and navigate a changing industry landscape through problem-solving and collaboration
- In January 2022–Cargill opened the Cargill Innovation Center in Gurugram, Haryana, to develop innovative solutions that address food and beverage (F&B) market trends. Cargill will partner with its F&B customers in India to identify consumer demands, translate global industry trends into local application and accelerate customer product innovation pipelines by co-developing healthy, nutritious food options for consumers.
- In August 2021- Nestlé Health Science announces acquisition of the core brands of The Bountiful Company, including Nature’s Bounty®, Solgar®, Osteo Bi-Flex®, Puritan’s Pride®, Ester-C®, and Sundown.
Report Scope
Report Attribute |
Details |
Growth Rate |
CAGR of 5.6% from 2022 to 2032 |
Expected Market Value (2022) |
US$ 942.6 Million |
Anticipated Forecast Value (2032) |
US$ 1,470.5 Million |
Base Year for Estimation |
2021 |
Historical Data |
2016-2021 |
Forecast Period |
2022-2032 |
Quantitative Units |
Revenue in US$ Million, and CAGR from 2022-2032 |
Report Coverage |
Revenue Forecast, Company Ranking, Competitive Landscape, Growth Factors, Trends and Pricing Analysis |
Segments Covered |
|
Regions Covered |
|
Key Countries Profiled |
|
Key Companies Profiled |
|
Customization |
Available Upon Request |
Key Segments Profiled in the Fruit Pectin Industry Survey
Fruit Pectin Market by Form:
- Dry Fruit Pectin
- Liquid Fruit Pectin
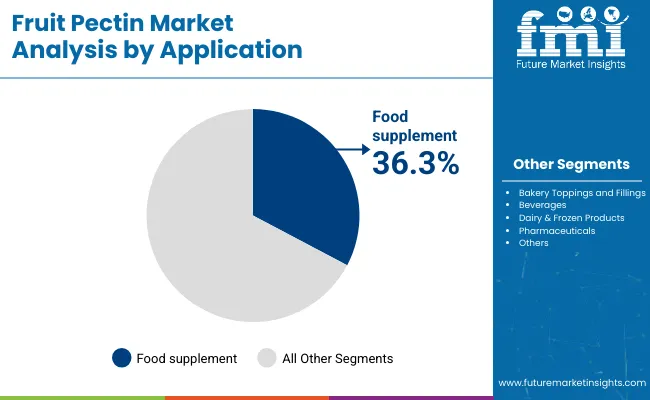
Fruit Pectin Market by Application:
- Fruit Pectin for Bakery Toppings and Fillings
- Fruit Pectin for Beverages
- Fruit Pectin for Food Supplements
- Fruit Pectin for Dairy & Frozen Products
- Fruit Pectin for Pharmaceuticals
- Fruit Pectin for Other Applications
Fruit Pectin Market by Function:
- Fruit Pectin as Thickeners
- Fruit Pectin as Fat Replacers
- Fruit Pectin as Stabilizers
- Fruit Pectin as Gelling Agents
- Fruit Pectin as Detoxification Agents
- Fruit Pectin as Coatings
- Fruit Pectin for Other Functions
Fruit Pectin Market by End User:
- Fruit Pectin for the Food & Beverage Industry
- Fruit Pectin for the Personal Care & Cosmetics Industry
- Fruit Pectin for the Healthcare Industry
- Fruit Pectin for Other End Users
Fruit Pectin Market by Region:
- North America Fruit Pectin Market
- Latin America Fruit Pectin Market
- Europe Fruit Pectin Market
- Middle East and Africa Fruit Pectin Market
- Asia Pacific Fruit Pectin Market
Frequently Asked Questions
FMI projects the global fruit pectin market to expand at a 5.6% value CAGR by 2032
North America is expected to be the most opportunistic with a 32.7% share of the total fruit pectin market
CP Kelco, Cargill Inc., Devson Impex Pvt. Ltd., and Nestlé S.A are some prominent fruit pectin market manufacturers.
Table of Content
1. Executive Summary
1.1. Global Market Outlook
1.2. Demand-side Trends
1.3. Supply-side Trends
1.4. Technology Roadmap Analysis
1.5. Analysis and Recommendations
2. Market Overview
2.1. Market Coverage / Taxonomy
2.2. Market Definition / Scope / Limitations
3. Market Background
3.1. Market Dynamics
3.1.1. Drivers
3.1.2. Restraints
3.1.3. Opportunity
3.1.4. Trends
3.2. Scenario Forecast
3.2.1. Demand in Optimistic Scenario
3.2.2. Demand in Likely Scenario
3.2.3. Demand in Conservative Scenario
3.3. Opportunity Map Analysis
3.4. Product Life Cycle Analysis
3.5. Supply Chain Analysis
3.5.1. Supply Side Participants and their Roles
3.5.1.1. Producers
3.5.1.2. Mid-Level Participants (Traders/ Agents/ Brokers)
3.5.1.3. Wholesalers and Distributors
3.5.2. Value Added and Value Created at Node in the Supply Chain
3.5.3. List of Raw Material Suppliers
3.5.4. List of Existing and Potential Buyer’s
3.6. Investment Feasibility Matrix
3.7. Value Chain Analysis
3.7.1. Profit Margin Analysis
3.7.2. Wholesalers and Distributors
3.7.3. Retailers
3.8. PESTLE and Porter’s Analysis
3.9. Regulatory Landscape
3.9.1. By Key Regions
3.9.2. By Key Countries
3.10. Regional Parent Market Outlook
3.11. Production and Consumption Statistics
3.12. Import and Export Statistics
4. Global Market Analysis 2017-2021 and Forecast, 2022-2032
4.1. Historical Market Size Value (US$ Mn) & Volume (Kg) Analysis, 2017-2021
4.2. Current and Future Market Size Value (US$ Mn) & Volume (Kg) Projections, 2022-2032
4.2.1. Y-o-Y Growth Trend Analysis
4.2.2. Absolute $ Opportunity Analysis
5. Global Market Analysis 2017-2021 and Forecast 2022-2032, By Form
5.1. Introduction / Key Findings
5.2. Historical Market Size Value (US$ Mn) & Volume (Kg) Analysis By Form, 2017-2021
5.3. Current and Future Market Size Value (US$ Mn) & Volume (Kg) Analysis and Forecast By Form, 2022-2032
5.3.1. Dry
5.3.2. Liquid
5.4. Y-o-Y Growth Trend Analysis By Form, 2017-2021
5.5. Absolute $ Opportunity Analysis By Form, 2022-2032
6. Global Market Analysis 2017-2021 and Forecast 2022-2032, By Application
6.1. Introduction / Key Findings
6.2. Historical Market Size Value (US$ Mn) & Volume (Kg) Analysis By Application, 2017-2021
6.3. Current and Future Market Size Value (US$ Mn) & Volume (Kg) Analysis and Forecast By Application, 2022-2032
6.3.1. Bakery Toppings and Fillings
6.3.2. Beverages
6.3.3. Food Supplements
6.3.4. Dairy & Frozen Products
6.3.5. Pharmaceuticals
6.3.6. Others
6.4. Y-o-Y Growth Trend Analysis By Application, 2017-2021
6.5. Absolute $ Opportunity Analysis By Application, 2022-2032
7. Global Market Analysis 2017-2021 and Forecast 2022-2032, By Function
7.1. Introduction / Key Findings
7.2. Historical Market Size Value (US$ Mn) & Volume (Kg) Analysis By Function, 2017-2021
7.3. Current and Future Market Size Value (US$ Mn) & Volume (Kg) Analysis and Forecast By Function, 2022-2032
7.3.1. Thickener
7.3.2. Fat Replacer
7.3.3. Stabilizer
7.3.4. Gelling Agent
7.3.5. Detoxification
7.3.6. Coating
7.3.7. Others
7.4. Y-o-Y Growth Trend Analysis By Function, 2017-2021
7.5. Absolute $ Opportunity Analysis By Function, 2022-2032
8. Global Market Analysis 2017-2021 and Forecast 2022-2032, By End User
8.1. Introduction / Key Findings
8.2. Historical Market Size Value (US$ Mn) & Volume (Kg) Analysis By End User, 2017-2021
8.3. Current and Future Market Size Value (US$ Mn) & Volume (Kg) Analysis and Forecast By End User, 2022-2032
8.3.1. Foods & Beverages industry
8.3.2. Personal Care & Cosmetics Industry
8.3.3. Healthcare Industry
8.3.4. Others
8.4. Y-o-Y Growth Trend Analysis By End User, 2017-2021
8.5. Absolute $ Opportunity Analysis By End User, 2022-2032
9. Global Market Analysis 2017-2021 and Forecast 2022-2032, By Region
9.1. Introduction
9.2. Historical Market Size Value (US$ Mn) & Volume (Kg) Analysis By Region, 2017-2021
9.3. Current Market Size Value (US$ Mn) & Volume (Kg) Analysis and Forecast By Region, 2022-2032
9.3.1. North America
9.3.2. Latin America
9.3.3. Europe
9.3.4. Asia Pacific
9.3.5. MEA
9.4. Market Attractiveness Analysis By Region
10. North America Market Analysis 2017-2021 and Forecast 2022-2032, By Country
10.1. Historical Market Size Value (US$ Mn) & Volume (Kg) Trend Analysis By Market Taxonomy, 2017-2021
10.2. Market Size Value (US$ Mn) & Volume (Kg) Forecast By Market Taxonomy, 2022-2032
10.2.1. By Country
10.2.1.1. U.S.
10.2.1.2. Canada
10.2.2. By Form
10.2.3. By Application
10.2.4. By Function
10.2.5. By End User
10.3. Market Attractiveness Analysis
10.3.1. By Country
10.3.2. By Form
10.3.3. By Application
10.3.4. By Function
10.3.5. By End User
10.4. Key Takeaways
11. Latin America Market Analysis 2017-2021 and Forecast 2022-2032, By Country
11.1. Historical Market Size Value (US$ Mn) & Volume (Kg) Trend Analysis By Market Taxonomy, 2017-2021
11.2. Market Size Value (US$ Mn) & Volume (Kg) Forecast By Market Taxonomy, 2022-2032
11.2.1. By Country
11.2.1.1. Brazil
11.2.1.2. Mexico
11.2.1.3. Rest of Latin America
11.2.2. By Form
11.2.3. By Application
11.2.4. By Function
11.2.5. By End User
11.3. Market Attractiveness Analysis
11.3.1. By Country
11.3.2. By Form
11.3.3. By Application
11.3.4. By Function
11.3.5. By End User
11.4. Key Takeaways
12. Europe Market Analysis 2017-2021 and Forecast 2022-2032, By Country
12.1. Historical Market Size Value (US$ Mn) & Volume (Kg) Trend Analysis By Market Taxonomy, 2017-2021
12.2. Market Size Value (US$ Mn) & Volume (Kg) Forecast By Market Taxonomy, 2022-2032
12.2.1. By Country
12.2.1.1. Germany
12.2.1.2. U.K.
12.2.1.3. France
12.2.1.4. Spain
12.2.1.5. Italy
12.2.1.6. Rest of Europe
12.2.2. By Form
12.2.3. By Application
12.2.4. By Function
12.2.5. By End User
12.3. Market Attractiveness Analysis
12.3.1. By Country
12.3.2. By Form
12.3.3. By Application
12.3.4. By Function
12.3.5. By End User
12.4. Key Takeaways
13. Asia Pacific Market Analysis 2017-2021 and Forecast 2022-2032, By Country
13.1. Historical Market Size Value (US$ Mn) & Volume (Kg) Trend Analysis By Market Taxonomy, 2017-2021
13.2. Market Size Value (US$ Mn) & Volume (Kg) Forecast By Market Taxonomy, 2022-2032
13.2.1. By Country
13.2.1.1. China
13.2.1.2. Japan
13.2.1.3. South Korea
13.2.1.4. Malaysia
13.2.1.5. Singapore
13.2.1.6. Australia
13.2.1.7. New Zealand
13.2.1.8. Rest of APAC
13.2.2. By Form
13.2.3. By Application
13.2.4. By Function
13.2.5. By End User
13.3. Market Attractiveness Analysis
13.3.1. By Country
13.3.2. By Form
13.3.3. By Application
13.3.4. By Function
13.3.5. By End User
13.4. Key Takeaways
14. MEA Market Analysis 2017-2021 and Forecast 2022-2032, By Country
14.1. Historical Market Size Value (US$ Mn) & Volume (Kg) Trend Analysis By Market Taxonomy, 2017-2021
14.2. Market Size Value (US$ Mn) & Volume (Kg) Forecast By Market Taxonomy, 2022-2032
14.2.1. By Country
14.2.1.1. GCC Countries
14.2.1.2. South Africa
14.2.1.3. Israel
14.2.1.4. Rest of MEA
14.2.2. By Form
14.2.3. By Application
14.2.4. By Function
14.2.5. By End User
14.3. Market Attractiveness Analysis
14.3.1. By Country
14.3.2. By Form
14.3.3. By Application
14.3.4. By Function
14.3.5. By End User
14.4. Key Takeaways
15. Key Countries Market Analysis
15.1. U.S.
15.1.1. Pricing Analysis
15.1.2. Market Share Analysis, 2021
15.1.2.1. By Form
15.1.2.2. By Application
15.1.2.3. By Function
15.1.2.4. By End User
15.2. Canada
15.2.1. Pricing Analysis
15.2.2. Market Share Analysis, 2021
15.2.2.1. By Form
15.2.2.2. By Application
15.2.2.3. By Function
15.2.2.4. By End User
15.3. Brazil
15.3.1. Pricing Analysis
15.3.2. Market Share Analysis, 2021
15.3.2.1. By Form
15.3.2.2. By Application
15.3.2.3. By Function
15.3.2.4. By End User
15.4. Mexico
15.4.1. Pricing Analysis
15.4.2. Market Share Analysis, 2021
15.4.2.1. By Form
15.4.2.2. By Application
15.4.2.3. By Function
15.4.2.4. By End User
15.5. Germany
15.5.1. Pricing Analysis
15.5.2. Market Share Analysis, 2021
15.5.2.1. By Form
15.5.2.2. By Application
15.5.2.3. By Function
15.5.2.4. By End User
15.6. U.K.
15.6.1. Pricing Analysis
15.6.2. Market Share Analysis, 2021
15.6.2.1. By Form
15.6.2.2. By Application
15.6.2.3. By Function
15.6.2.4. By End User
15.7. France
15.7.1. Pricing Analysis
15.7.2. Market Share Analysis, 2021
15.7.2.1. By Form
15.7.2.2. By Application
15.7.2.3. By Function
15.7.2.4. By End User
15.8. Spain
15.8.1. Pricing Analysis
15.8.2. Market Share Analysis, 2021
15.8.2.1. By Form
15.8.2.2. By Application
15.8.2.3. By Function
15.8.2.4. By End User
15.9. Italy
15.9.1. Pricing Analysis
15.9.2. Market Share Analysis, 2021
15.9.2.1. By Form
15.9.2.2. By Application
15.9.2.3. By Function
15.9.2.4. By End User
15.10. China
15.10.1. Pricing Analysis
15.10.2. Market Share Analysis, 2021
15.10.2.1. By Form
15.10.2.2. By Application
15.10.2.3. By Function
15.10.2.4. By End User
15.11. Japan
15.11.1. Pricing Analysis
15.11.2. Market Share Analysis, 2021
15.11.2.1. By Form
15.11.2.2. By Application
15.11.2.3. By Function
15.11.2.4. By End User
15.12. South Korea
15.12.1. Pricing Analysis
15.12.2. Market Share Analysis, 2021
15.12.2.1. By Form
15.12.2.2. By Application
15.12.2.3. By Function
15.12.2.4. By End User
15.13. Malaysia
15.13.1. Pricing Analysis
15.13.2. Market Share Analysis, 2021
15.13.2.1. By Form
15.13.2.2. By Application
15.13.2.3. By Function
15.13.2.4. By End User
15.14. Singapore
15.14.1. Pricing Analysis
15.14.2. Market Share Analysis, 2021
15.14.2.1. By Form
15.14.2.2. By Application
15.14.2.3. By Function
15.14.2.4. By End User
15.15. Australia
15.15.1. Pricing Analysis
15.15.2. Market Share Analysis, 2021
15.15.2.1. By Form
15.15.2.2. By Application
15.15.2.3. By Function
15.15.2.4. By End User
15.16. New Zealand
15.16.1. Pricing Analysis
15.16.2. Market Share Analysis, 2021
15.16.2.1. By Form
15.16.2.2. By Application
15.16.2.3. By Function
15.16.2.4. By End User
15.17. GCC Countries
15.17.1. Pricing Analysis
15.17.2. Market Share Analysis, 2021
15.17.2.1. By Form
15.17.2.2. By Application
15.17.2.3. By Function
15.17.2.4. By End User
15.18. South Africa
15.18.1. Pricing Analysis
15.18.2. Market Share Analysis, 2021
15.18.2.1. By Form
15.18.2.2. By Application
15.18.2.3. By Function
15.18.2.4. By End User
15.19. Israel
15.19.1. Pricing Analysis
15.19.2. Market Share Analysis, 2021
15.19.2.1. By Form
15.19.2.2. By Application
15.19.2.3. By Function
15.19.2.4. By End User
16. Market Structure Analysis
16.1. Competition Dashboard
16.2. Competition Benchmarking
16.3. Market Share Analysis of Top Players
16.3.1. By Regional
16.3.2. By Form
16.3.3. By Application
16.3.4. By Function
16.3.5. By End User
17. Competition Analysis
17.1. Competition Deep Dive
17.1.1. CP Kelco
17.1.1.1. Overview
17.1.1.2. Product Portfolio
17.1.1.3. Profitability by Market Segments
17.1.1.4. Sales Footprint
17.1.1.5. Strategy Overview
17.1.1.5.1. Marketing Strategy
17.1.1.5.2. Product Strategy
17.1.1.5.3. Channel Strategy
17.1.2. Cargill Inc.
17.1.2.1. Overview
17.1.2.2. Product Portfolio
17.1.2.3. Profitability by Market Segments
17.1.2.4. Sales Footprint
17.1.2.5. Strategy Overview
17.1.2.5.1. Marketing Strategy
17.1.2.5.2. Product Strategy
17.1.2.5.3. Channel Strategy
17.1.3. Devson Impex Pvt. Ltd
17.1.3.1. Overview
17.1.3.2. Product Portfolio
17.1.3.3. Profitability by Market Segments
17.1.3.4. Sales Footprint
17.1.3.5. Strategy Overview
17.1.3.5.1. Marketing Strategy
17.1.3.5.2. Product Strategy
17.1.3.5.3. Channel Strategy
17.1.4. Nestlé S.A
17.1.4.1. Overview
17.1.4.2. Product Portfolio
17.1.4.3. Profitability by Market Segments
17.1.4.4. Sales Footprint
17.1.4.5. Strategy Overview
17.1.4.5.1. Marketing Strategy
17.1.4.5.2. Product Strategy
17.1.4.5.3. Channel Strategy
17.1.5. Danone S.A.
17.1.5.1. Overview
17.1.5.2. Product Portfolio
17.1.5.3. Profitability by Market Segments
17.1.5.4. Sales Footprint
17.1.5.5. Strategy Overview
17.1.5.5.1. Marketing Strategy
17.1.5.5.2. Product Strategy
17.1.5.5.3. Channel Strategy
17.1.6. Unilever
17.1.6.1. Overview
17.1.6.2. Product Portfolio
17.1.6.3. Profitability by Market Segments
17.1.6.4. Sales Footprint
17.1.6.5. Strategy Overview
17.1.6.5.1. Marketing Strategy
17.1.6.5.2. Product Strategy
17.1.6.5.3. Channel Strategy
17.1.7. Kellogg NA Co
17.1.7.1. Overview
17.1.7.2. Product Portfolio
17.1.7.3. Profitability by Market Segments
17.1.7.4. Sales Footprint
17.1.7.5. Strategy Overview
17.1.7.5.1. Marketing Strategy
17.1.7.5.2. Product Strategy
17.1.7.5.3. Channel Strategy
17.1.8. Yantai Andre Pectin Co. Ltd
17.1.8.1. Overview
17.1.8.2. Product Portfolio
17.1.8.3. Profitability by Market Segments
17.1.8.4. Sales Footprint
17.1.8.5. Strategy Overview
17.1.8.5.1. Marketing Strategy
17.1.8.5.2. Product Strategy
17.1.8.5.3. Channel Strategy
17.1.9. Danisco A/S
17.1.9.1. Overview
17.1.9.2. Product Portfolio
17.1.9.3. Profitability by Market Segments
17.1.9.4. Sales Footprint
17.1.9.5. Strategy Overview
17.1.9.5.1. Marketing Strategy
17.1.9.5.2. Product Strategy
17.1.9.5.3. Channel Strategy
17.1.10. B&V srl
17.1.10.1. Overview
17.1.10.2. Product Portfolio
17.1.10.3. Profitability by Market Segments
17.1.10.4. Sales Footprint
17.1.10.5. Strategy Overview
17.1.10.5.1. Marketing Strategy
17.1.10.5.2. Product Strategy
17.1.10.5.3. Channel Strategy
18. Assumptions & Acronyms Used
19. Research Methodology
Let us know your requirement to get
100% FREE customization
List of Tables
Table 1: Global Market Value (US$ Mn) Forecast by Region, 2017-2032
Table 2: Global Market Volume (Kg) Forecast by Region, 2017-2032
Table 3: Global Market Value (US$ Mn) Forecast by Form, 2017-2032
Table 4: Global Market Volume (Kg) Forecast by Form, 2017-2032
Table 5: Global Market Value (US$ Mn) Forecast by Application, 2017-2032
Table 6: Global Market Volume (Kg) Forecast by Application, 2017-2032
Table 7: Global Market Value (US$ Mn) Forecast by Function, 2017-2032
Table 8: Global Market Volume (Kg) Forecast by Function, 2017-2032
Table 9: Global Market Value (US$ Mn) Forecast by End User, 2017-2032
Table 10: Global Market Volume (Kg) Forecast by End User, 2017-2032
Table 11: North America Market Value (US$ Mn) Forecast by Country, 2017-2032
Table 12: North America Market Volume (Kg) Forecast by Country, 2017-2032
Table 13: North America Market Value (US$ Mn) Forecast by Form, 2017-2032
Table 14: North America Market Volume (Kg) Forecast by Form, 2017-2032
Table 15: North America Market Value (US$ Mn) Forecast by Application, 2017-2032
Table 16: North America Market Volume (Kg) Forecast by Application, 2017-2032
Table 17: North America Market Value (US$ Mn) Forecast by Function, 2017-2032
Table 18: North America Market Volume (Kg) Forecast by Function, 2017-2032
Table 19: North America Market Value (US$ Mn) Forecast by End User, 2017-2032
Table 20: North America Market Volume (Kg) Forecast by End User, 2017-2032
Table 21: Latin America Market Value (US$ Mn) Forecast by Country, 2017-2032
Table 22: Latin America Market Volume (Kg) Forecast by Country, 2017-2032
Table 23: Latin America Market Value (US$ Mn) Forecast by Form, 2017-2032
Table 24: Latin America Market Volume (Kg) Forecast by Form, 2017-2032
Table 25: Latin America Market Value (US$ Mn) Forecast by Application, 2017-2032
Table 26: Latin America Market Volume (Kg) Forecast by Application, 2017-2032
Table 27: Latin America Market Value (US$ Mn) Forecast by Function, 2017-2032
Table 28: Latin America Market Volume (Kg) Forecast by Function, 2017-2032
Table 29: Latin America Market Value (US$ Mn) Forecast by End User, 2017-2032
Table 30: Latin America Market Volume (Kg) Forecast by End User, 2017-2032
Table 31: Europe Market Value (US$ Mn) Forecast by Country, 2017-2032
Table 32: Europe Market Volume (Kg) Forecast by Country, 2017-2032
Table 33: Europe Market Value (US$ Mn) Forecast by Form, 2017-2032
Table 34: Europe Market Volume (Kg) Forecast by Form, 2017-2032
Table 35: Europe Market Value (US$ Mn) Forecast by Application, 2017-2032
Table 36: Europe Market Volume (Kg) Forecast by Application, 2017-2032
Table 37: Europe Market Value (US$ Mn) Forecast by Function, 2017-2032
Table 38: Europe Market Volume (Kg) Forecast by Function, 2017-2032
Table 39: Europe Market Value (US$ Mn) Forecast by End User, 2017-2032
Table 40: Europe Market Volume (Kg) Forecast by End User, 2017-2032
Table 41: Asia Pacific Market Value (US$ Mn) Forecast by Country, 2017-2032
Table 42: Asia Pacific Market Volume (Kg) Forecast by Country, 2017-2032
Table 43: Asia Pacific Market Value (US$ Mn) Forecast by Form, 2017-2032
Table 44: Asia Pacific Market Volume (Kg) Forecast by Form, 2017-2032
Table 45: Asia Pacific Market Value (US$ Mn) Forecast by Application, 2017-2032
Table 46: Asia Pacific Market Volume (Kg) Forecast by Application, 2017-2032
Table 47: Asia Pacific Market Value (US$ Mn) Forecast by Function, 2017-2032
Table 48: Asia Pacific Market Volume (Kg) Forecast by Function, 2017-2032
Table 49: Asia Pacific Market Value (US$ Mn) Forecast by End User, 2017-2032
Table 50: Asia Pacific Market Volume (Kg) Forecast by End User, 2017-2032
Table 51: MEA Market Value (US$ Mn) Forecast by Country, 2017-2032
Table 52: MEA Market Volume (Kg) Forecast by Country, 2017-2032
Table 53: MEA Market Value (US$ Mn) Forecast by Form, 2017-2032
Table 54: MEA Market Volume (Kg) Forecast by Form, 2017-2032
Table 55: MEA Market Value (US$ Mn) Forecast by Application, 2017-2032
Table 56: MEA Market Volume (Kg) Forecast by Application, 2017-2032
Table 57: MEA Market Value (US$ Mn) Forecast by Function, 2017-2032
Table 58: MEA Market Volume (Kg) Forecast by Function, 2017-2032
Table 59: MEA Market Value (US$ Mn) Forecast by End User, 2017-2032
Table 60: MEA Market Volume (Kg) Forecast by End User, 2017-2032
Find your sweet spots for generating winning opportunities in this market.
Talk to AnalystList of Charts
Figure 1: Global Market Value (US$ Mn) by Form, 2022-2032
Figure 2: Global Market Value (US$ Mn) by Application, 2022-2032
Figure 3: Global Market Value (US$ Mn) by Function, 2022-2032
Figure 4: Global Market Value (US$ Mn) by End User, 2022-2032
Figure 5: Global Market Value (US$ Mn) by Region, 2022-2032
Figure 6: Global Market Value (US$ Mn) Analysis by Region, 2017-2032
Figure 7: Global Market Volume (Kg) Analysis by Region, 2017-2032
Figure 8: Global Market Value Share (%) and BPS Analysis by Region, 2022-2032
Figure 9: Global Market Y-o-Y Growth (%) Projections by Region, 2022-2032
Figure 10: Global Market Value (US$ Mn) Analysis by Form, 2017-2032
Figure 11: Global Market Volume (Kg) Analysis by Form, 2017-2032
Figure 12: Global Market Value Share (%) and BPS Analysis by Form, 2022-2032
Figure 13: Global Market Y-o-Y Growth (%) Projections by Form, 2022-2032
Figure 14: Global Market Value (US$ Mn) Analysis by Application, 2017-2032
Figure 15: Global Market Volume (Kg) Analysis by Application, 2017-2032
Figure 16: Global Market Value Share (%) and BPS Analysis by Application, 2022-2032
Figure 17: Global Market Y-o-Y Growth (%) Projections by Application, 2022-2032
Figure 18: Global Market Value (US$ Mn) Analysis by Function, 2017-2032
Figure 19: Global Market Volume (Kg) Analysis by Function, 2017-2032
Figure 20: Global Market Value Share (%) and BPS Analysis by Function, 2022-2032
Figure 21: Global Market Y-o-Y Growth (%) Projections by Function, 2022-2032
Figure 22: Global Market Value (US$ Mn) Analysis by End User, 2017-2032
Figure 23: Global Market Volume (Kg) Analysis by End User, 2017-2032
Figure 24: Global Market Value Share (%) and BPS Analysis by End User, 2022-2032
Figure 25: Global Market Y-o-Y Growth (%) Projections by End User, 2022-2032
Figure 26: Global Market Attractiveness by Form, 2022-2032
Figure 27: Global Market Attractiveness by Application, 2022-2032
Figure 28: Global Market Attractiveness by Function, 2022-2032
Figure 29: Global Market Attractiveness by End User, 2022-2032
Figure 30: Global Market Attractiveness by Region, 2022-2032
Figure 31: North America Market Value (US$ Mn) by Form, 2022-2032
Figure 32: North America Market Value (US$ Mn) by Application, 2022-2032
Figure 33: North America Market Value (US$ Mn) by Function, 2022-2032
Figure 34: North America Market Value (US$ Mn) by End User, 2022-2032
Figure 35: North America Market Value (US$ Mn) by Country, 2022-2032
Figure 36: North America Market Value (US$ Mn) Analysis by Country, 2017-2032
Figure 37: North America Market Volume (Kg) Analysis by Country, 2017-2032
Figure 38: North America Market Value Share (%) and BPS Analysis by Country, 2022-2032
Figure 39: North America Market Y-o-Y Growth (%) Projections by Country, 2022-2032
Figure 40: North America Market Value (US$ Mn) Analysis by Form, 2017-2032
Figure 41: North America Market Volume (Kg) Analysis by Form, 2017-2032
Figure 42: North America Market Value Share (%) and BPS Analysis by Form, 2022-2032
Figure 43: North America Market Y-o-Y Growth (%) Projections by Form, 2022-2032
Figure 44: North America Market Value (US$ Mn) Analysis by Application, 2017-2032
Figure 45: North America Market Volume (Kg) Analysis by Application, 2017-2032
Figure 46: North America Market Value Share (%) and BPS Analysis by Application, 2022-2032
Figure 47: North America Market Y-o-Y Growth (%) Projections by Application, 2022-2032
Figure 48: North America Market Value (US$ Mn) Analysis by Function, 2017-2032
Figure 49: North America Market Volume (Kg) Analysis by Function, 2017-2032
Figure 50: North America Market Value Share (%) and BPS Analysis by Function, 2022-2032
Figure 51: North America Market Y-o-Y Growth (%) Projections by Function, 2022-2032
Figure 52: North America Market Value (US$ Mn) Analysis by End User, 2017-2032
Figure 53: North America Market Volume (Kg) Analysis by End User, 2017-2032
Figure 54: North America Market Value Share (%) and BPS Analysis by End User, 2022-2032
Figure 55: North America Market Y-o-Y Growth (%) Projections by End User, 2022-2032
Figure 56: North America Market Attractiveness by Form, 2022-2032
Figure 57: North America Market Attractiveness by Application, 2022-2032
Figure 58: North America Market Attractiveness by Function, 2022-2032
Figure 59: North America Market Attractiveness by End User, 2022-2032
Figure 60: North America Market Attractiveness by Country, 2022-2032
Figure 61: Latin America Market Value (US$ Mn) by Form, 2022-2032
Figure 62: Latin America Market Value (US$ Mn) by Application, 2022-2032
Figure 63: Latin America Market Value (US$ Mn) by Function, 2022-2032
Figure 64: Latin America Market Value (US$ Mn) by End User, 2022-2032
Figure 65: Latin America Market Value (US$ Mn) by Country, 2022-2032
Figure 66: Latin America Market Value (US$ Mn) Analysis by Country, 2017-2032
Figure 67: Latin America Market Volume (Kg) Analysis by Country, 2017-2032
Figure 68: Latin America Market Value Share (%) and BPS Analysis by Country, 2022-2032
Figure 69: Latin America Market Y-o-Y Growth (%) Projections by Country, 2022-2032
Figure 70: Latin America Market Value (US$ Mn) Analysis by Form, 2017-2032
Figure 71: Latin America Market Volume (Kg) Analysis by Form, 2017-2032
Figure 72: Latin America Market Value Share (%) and BPS Analysis by Form, 2022-2032
Figure 73: Latin America Market Y-o-Y Growth (%) Projections by Form, 2022-2032
Figure 74: Latin America Market Value (US$ Mn) Analysis by Application, 2017-2032
Figure 75: Latin America Market Volume (Kg) Analysis by Application, 2017-2032
Figure 76: Latin America Market Value Share (%) and BPS Analysis by Application, 2022-2032
Figure 77: Latin America Market Y-o-Y Growth (%) Projections by Application, 2022-2032
Figure 78: Latin America Market Value (US$ Mn) Analysis by Function, 2017-2032
Figure 79: Latin America Market Volume (Kg) Analysis by Function, 2017-2032
Figure 80: Latin America Market Value Share (%) and BPS Analysis by Function, 2022-2032
Figure 81: Latin America Market Y-o-Y Growth (%) Projections by Function, 2022-2032
Figure 82: Latin America Market Value (US$ Mn) Analysis by End User, 2017-2032
Figure 83: Latin America Market Volume (Kg) Analysis by End User, 2017-2032
Figure 84: Latin America Market Value Share (%) and BPS Analysis by End User, 2022-2032
Figure 85: Latin America Market Y-o-Y Growth (%) Projections by End User, 2022-2032
Figure 86: Latin America Market Attractiveness by Form, 2022-2032
Figure 87: Latin America Market Attractiveness by Application, 2022-2032
Figure 88: Latin America Market Attractiveness by Function, 2022-2032
Figure 89: Latin America Market Attractiveness by End User, 2022-2032
Figure 90: Latin America Market Attractiveness by Country, 2022-2032
Figure 91: Europe Market Value (US$ Mn) by Form, 2022-2032
Figure 92: Europe Market Value (US$ Mn) by Application, 2022-2032
Figure 93: Europe Market Value (US$ Mn) by Function, 2022-2032
Figure 94: Europe Market Value (US$ Mn) by End User, 2022-2032
Figure 95: Europe Market Value (US$ Mn) by Country, 2022-2032
Figure 96: Europe Market Value (US$ Mn) Analysis by Country, 2017-2032
Figure 97: Europe Market Volume (Kg) Analysis by Country, 2017-2032
Figure 98: Europe Market Value Share (%) and BPS Analysis by Country, 2022-2032
Figure 99: Europe Market Y-o-Y Growth (%) Projections by Country, 2022-2032
Figure 100: Europe Market Value (US$ Mn) Analysis by Form, 2017-2032
Figure 101: Europe Market Volume (Kg) Analysis by Form, 2017-2032
Figure 102: Europe Market Value Share (%) and BPS Analysis by Form, 2022-2032
Figure 103: Europe Market Y-o-Y Growth (%) Projections by Form, 2022-2032
Figure 104: Europe Market Value (US$ Mn) Analysis by Application, 2017-2032
Figure 105: Europe Market Volume (Kg) Analysis by Application, 2017-2032
Figure 106: Europe Market Value Share (%) and BPS Analysis by Application, 2022-2032
Figure 107: Europe Market Y-o-Y Growth (%) Projections by Application, 2022-2032
Figure 108: Europe Market Value (US$ Mn) Analysis by Function, 2017-2032
Figure 109: Europe Market Volume (Kg) Analysis by Function, 2017-2032
Figure 110: Europe Market Value Share (%) and BPS Analysis by Function, 2022-2032
Figure 111: Europe Market Y-o-Y Growth (%) Projections by Function, 2022-2032
Figure 112: Europe Market Value (US$ Mn) Analysis by End User, 2017-2032
Figure 113: Europe Market Volume (Kg) Analysis by End User, 2017-2032
Figure 114: Europe Market Value Share (%) and BPS Analysis by End User, 2022-2032
Figure 115: Europe Market Y-o-Y Growth (%) Projections by End User, 2022-2032
Figure 116: Europe Market Attractiveness by Form, 2022-2032
Figure 117: Europe Market Attractiveness by Application, 2022-2032
Figure 118: Europe Market Attractiveness by Function, 2022-2032
Figure 119: Europe Market Attractiveness by End User, 2022-2032
Figure 120: Europe Market Attractiveness by Country, 2022-2032
Figure 121: Asia Pacific Market Value (US$ Mn) by Form, 2022-2032
Figure 122: Asia Pacific Market Value (US$ Mn) by Application, 2022-2032
Figure 123: Asia Pacific Market Value (US$ Mn) by Function, 2022-2032
Figure 124: Asia Pacific Market Value (US$ Mn) by End User, 2022-2032
Figure 125: Asia Pacific Market Value (US$ Mn) by Country, 2022-2032
Figure 126: Asia Pacific Market Value (US$ Mn) Analysis by Country, 2017-2032
Figure 127: Asia Pacific Market Volume (Kg) Analysis by Country, 2017-2032
Figure 128: Asia Pacific Market Value Share (%) and BPS Analysis by Country, 2022-2032
Figure 129: Asia Pacific Market Y-o-Y Growth (%) Projections by Country, 2022-2032
Figure 130: Asia Pacific Market Value (US$ Mn) Analysis by Form, 2017-2032
Figure 131: Asia Pacific Market Volume (Kg) Analysis by Form, 2017-2032
Figure 132: Asia Pacific Market Value Share (%) and BPS Analysis by Form, 2022-2032
Figure 133: Asia Pacific Market Y-o-Y Growth (%) Projections by Form, 2022-2032
Figure 134: Asia Pacific Market Value (US$ Mn) Analysis by Application, 2017-2032
Figure 135: Asia Pacific Market Volume (Kg) Analysis by Application, 2017-2032
Figure 136: Asia Pacific Market Value Share (%) and BPS Analysis by Application, 2022-2032
Figure 137: Asia Pacific Market Y-o-Y Growth (%) Projections by Application, 2022-2032
Figure 138: Asia Pacific Market Value (US$ Mn) Analysis by Function, 2017-2032
Figure 139: Asia Pacific Market Volume (Kg) Analysis by Function, 2017-2032
Figure 140: Asia Pacific Market Value Share (%) and BPS Analysis by Function, 2022-2032
Figure 141: Asia Pacific Market Y-o-Y Growth (%) Projections by Function, 2022-2032
Figure 142: Asia Pacific Market Value (US$ Mn) Analysis by End User, 2017-2032
Figure 143: Asia Pacific Market Volume (Kg) Analysis by End User, 2017-2032
Figure 144: Asia Pacific Market Value Share (%) and BPS Analysis by End User, 2022-2032
Figure 145: Asia Pacific Market Y-o-Y Growth (%) Projections by End User, 2022-2032
Figure 146: Asia Pacific Market Attractiveness by Form, 2022-2032
Figure 147: Asia Pacific Market Attractiveness by Application, 2022-2032
Figure 148: Asia Pacific Market Attractiveness by Function, 2022-2032
Figure 149: Asia Pacific Market Attractiveness by End User, 2022-2032
Figure 150: Asia Pacific Market Attractiveness by Country, 2022-2032
Figure 151: MEA Market Value (US$ Mn) by Form, 2022-2032
Figure 152: MEA Market Value (US$ Mn) by Application, 2022-2032
Figure 153: MEA Market Value (US$ Mn) by Function, 2022-2032
Figure 154: MEA Market Value (US$ Mn) by End User, 2022-2032
Figure 155: MEA Market Value (US$ Mn) by Country, 2022-2032
Figure 156: MEA Market Value (US$ Mn) Analysis by Country, 2017-2032
Figure 157: MEA Market Volume (Kg) Analysis by Country, 2017-2032
Figure 158: MEA Market Value Share (%) and BPS Analysis by Country, 2022-2032
Figure 159: MEA Market Y-o-Y Growth (%) Projections by Country, 2022-2032
Figure 160: MEA Market Value (US$ Mn) Analysis by Form, 2017-2032
Figure 161: MEA Market Volume (Kg) Analysis by Form, 2017-2032
Figure 162: MEA Market Value Share (%) and BPS Analysis by Form, 2022-2032
Figure 163: MEA Market Y-o-Y Growth (%) Projections by Form, 2022-2032
Figure 164: MEA Market Value (US$ Mn) Analysis by Application, 2017-2032
Figure 165: MEA Market Volume (Kg) Analysis by Application, 2017-2032
Figure 166: MEA Market Value Share (%) and BPS Analysis by Application, 2022-2032
Figure 167: MEA Market Y-o-Y Growth (%) Projections by Application, 2022-2032
Figure 168: MEA Market Value (US$ Mn) Analysis by Function, 2017-2032
Figure 169: MEA Market Volume (Kg) Analysis by Function, 2017-2032
Figure 170: MEA Market Value Share (%) and BPS Analysis by Function, 2022-2032
Figure 171: MEA Market Y-o-Y Growth (%) Projections by Function, 2022-2032
Figure 172: MEA Market Value (US$ Mn) Analysis by End User, 2017-2032
Figure 173: MEA Market Volume (Kg) Analysis by End User, 2017-2032
Figure 174: MEA Market Value Share (%) and BPS Analysis by End User, 2022-2032
Figure 175: MEA Market Y-o-Y Growth (%) Projections by End User, 2022-2032
Figure 176: MEA Market Attractiveness by Form, 2022-2032
Figure 177: MEA Market Attractiveness by Application, 2022-2032
Figure 178: MEA Market Attractiveness by Function, 2022-2032
Figure 179: MEA Market Attractiveness by End User, 2022-2032
Figure 180: MEA Market Attractiveness by Country, 2022-2032
Need specific information?
Request CustomizationExplore Food and Beverage Insights
View Reports