Fruit Tea Market Size and Share Forecast Outlook 2025 to 2035

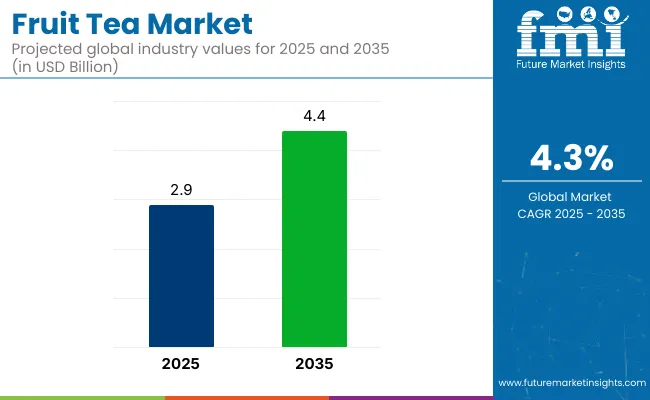
The global fruit tea market has been valued at USD 2.9 billion for 2025 and is expected to reach USD 4.4 billion by 2035, reflecting a steady 4.3% CAGR during the forecast period.
Quick Stats of Fruit Tea Market

  • Market Value (2025): USD 2.9 billion
  • Forecast Value (2035): USD 4.4 billion
  • Forecast CAGR (2025 to 2035): 4.3%
  • Leading Segment in 2025: Powder (55% share)
  • Key Growth Region: Asia Pacific (India is the fastest growing market with 4.7% CAGR)
  • Key Players: Twinings, Tetley, Unilever, Martin Bauer Group, Typhoo Tea Ltd, Van Rees, The London Tea Company, Dilmah, Hain Celestial Group Inc, and Duncans Industries Ltd.

Fruit Tea Market

Attribute Value
Industry Value (2025) USD 2.9 billion
Industry Value (2035) USD 4.4 billion
CAGR (2025 to 2035) 4.3%

The fruit tea category has grown steadily by gaining wider visibility across supermarkets, wellness cafés, and online stores. Fruit-infused teas are now positioned alongside traditional black and green teas, helping attract new customers. This growth has been supported by existing tea-processing infrastructure, which allowed producers to expand freeze-dried powders, RTD concentrates, and single-serve formats without major new investments.

Between 2020 and 2024, value-added products such as cold-brew and immunity blends drove much of the growth. To secure reliable supply, producers signed farming contracts in regions like Sri Lanka’s Uva province and Chile’s Maule Valley, focusing on ingredients such as hibiscus, elderberry, and passion fruit.

In response, blending units in Germany and Poland upgraded their equipment to reduce aroma loss during processing. Demand also rose for premium tea sachets sold through specialty and online channels, where clear sourcing labels and optimized textures helped brands justify higher pricing.

The industry accounts for an estimated 22-25% of the herbal tea market, supported by rising demand for berry, citrus, and hibiscus infusions. Within the flavored tea category, its share stands near 18%, with exotic fruit blends expanding seasonal offerings. In the functional beverages market, product contributes around 9%, driven by interest in antioxidant-rich and vitamin-infused drinks.

As part of the non-carbonated ready-to-drink beverages segment, fruit tea captures nearly 6%, where on-the-go formats are rising. In the natural and organic beverage space, its contribution is pegged at 12%, owing to clean-label sourcing and fair-trade positioning. These shares reflect consumer alignment with caffeine-free, health-positioned infusions and strong uptake through specialty cafés, wellness retailers, and direct-to-consumer online platforms.

Analysis of Fruit Tea Market by Top Investment Segments 

Powdered fruit tea leads demand due to its shelf stability, customization, and e-commerce adaptability. Traditional variants dominate by type, backed by cultural use and health associations. Supermarkets remain the primary distribution channel, favored for product visibility, variety, and trusted brand presence.
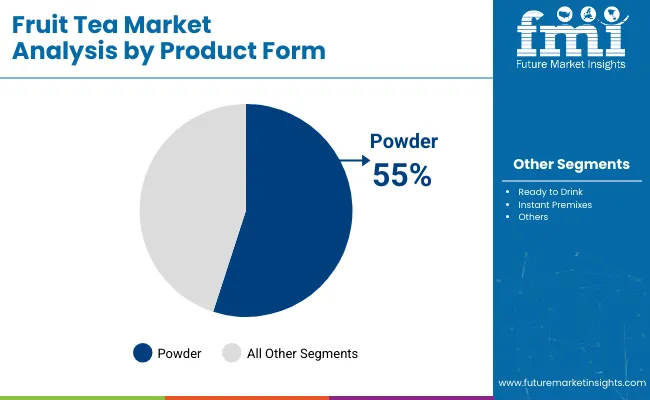
Powder Leads Product Demand with 55% Market Share in 2025

Fruit Tea Market By Product Form

Powder is projected to account for nearly 55% industry share by 2025. Powdered form has emerged as the leading segment due to its extended shelf life, transport efficiency, and flexibility in preparation.
  • Unlike ready-to-drink formats, powder variants allow consumers to control flavor intensity, sweetness, and temperature, aligning with personalized beverage habits.
  • Freeze-drying techniques have preserved fruit nutrients and natural flavors, making powdered tea an attractive option for health-conscious users.
  • The format’s success is further supported by digital-first brands offering sampler kits and functional blends through e-commerce, allowing fast consumer adoption across developed and emerging markets alike.

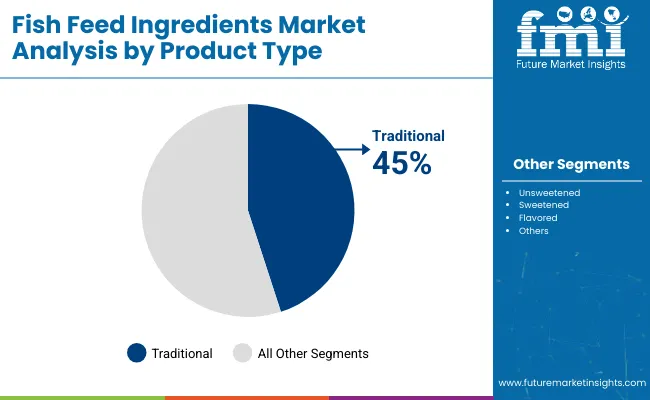
The Traditional Segment Holds a Dominant Position, Capturing Over 45% of the Market

Fruit Tea Market By Product Type

Traditional fruit tea is expected to hold 45% of the industry share in 2025,it retains strong cultural relevance and is deeply associated with natural wellness routines across multiple regions.

  • Blends like hibiscus, rosehip, and elderberry have been historically consumed in Europe, the Middle East, and Asia for their antioxidant and immune-supportive properties.
  • Traditional tea formulations are also widely accepted as caffeine-free options, fitting detox regimens and evening consumption patterns.
  • Manufacturers have reinforced this appeal by sourcing whole dried fruits and flowers, emphasizing clean-label profiles and authenticity.

Supermarkets and Hypermarkets Emerge as Preferred Distribution Channel with 42% Share

Supermarkets and hypermarkets hold the leading share in the distribution of fruit tea, accounting for an estimated 42% of total sales in 2025. Their dominance is driven by wide shelf space allocation, strong visibility, and consumer preference for one-stop beverage shopping.

  • Bulk availability of powdered, RTD, and flavored varieties appeals to diverse shopper preferences.
  • The trust associated with established retail chains supports higher turnover of premium and clean-label products.
  • In many regions, especially across North America and Europe, supermarkets serve as the primary destination for wellness-driven grocery categories, including herbal and functional teas.

Top Fruit Tea Market Dynamics

Caffeine-free fruit teas gained traction through wellness-driven hydration, with 12.6% retail growth and strong café and specialty retail adoption. Powder formats expanded online, growing 17.4% via lightweight packaging and subscription models that boosted repeat purchases and lowered logistics costs.

Functional Tea Demand Driven by Health-First Hydration Trends

Fruit-tea uptake accelerated as caffeine-free infusions addressed daily hydration across North America, Europe, and East Asia. Supermarket turnover for hibiscus- and berry-based blends expanded 12.6% between 2023 and 2025, while unsweetened lines contributed roughly 60% of that incremental value.

Specialty retailers in Germany and the United Kingdom doubled shelf space for adaptogen-fortified products, and 46% of large café chains in Japan carried immunity-positioned infusions by late 2024. Relaxation blends featuring vitamins and botanicals accounted for 31% of global SKU launches after mid-2023, illustrating sustained product pipeline momentum that continues to reinforce the category’s wellness credentials.

  • Retail value growth of 12.6% (2023 to 2025)
  • Unsweetened detox blends highlighted for sugar-conscious shoppers
  • Café menus leveraged for experiential discovery

Powder Format Expansion Backed by Digital Route-to-Market Scale

Logistical and channel efficiencies positioned powdered fruit tea for rapid expansion. E-commerce volumes rose 17.4% between Q1 2023 and Q1 2025, aided by lighter cartons that trimmed average transport cost per unit by about 13% and reduced breakage risk in last-mile delivery.

Asia-Pacific generated 42% of incremental online demand, while subscription boxes drove 28% of North American powder sales, lifting 90-day repeat-purchase rates to 36%. Lower spoilage, ambient storage, and customizable serving sizes strengthened retailer margins and encouraged digital-first brands to scale without traditional shelf-placement fees or cold-chain constraints.
  • E-commerce powder volume climbed 17.4% over two years
  • Subscription trials deepened customer engagement
  • Lightweight packaging improved freight economics

Analysis of Top Countries Manufacturing, Exporting and Supplying Fruit Tea Globally

Country Wise Analysis Of Fruit Tea Market

This report includes a detailed comparative analysis of over 40 countries, with the top five presented here for reference.

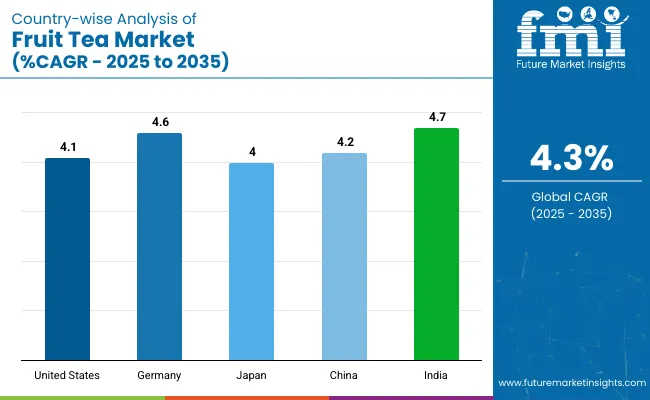
Countries CAGR (2025 to 2035)
United States 4.1%
Germany 4.6%
Japan 4.0%
China 4.2%
India 4.7%

The fruit tea market, forecast to grow globally at a CAGR of 4.3% from 2025 to 2035, reflects differentiated regional dynamics across key economies. India, a BRICS member, leads among the top five with a 4.7% CAGR, propelled by rising demand for Ayurvedic-inspired infusions and fast urban penetration via quick-commerce channels. Germany follows at 4.6%, an OECD country where organic labeling and sugar-free herbal blends are driving shelf expansion across national drugstore chains.

China, another BRICS country, records a 4.2% CAGR as regional fruit-based powders gain popularity through live stream commerce and cross-border e-retail platforms. The United States, an OECD member, posts a 4.1% CAGR, with supermarkets and cafés pushing unsweetened, functional blends as alternatives to high-calorie beverages.

Japan rounds out the group with a 4.0% CAGR, supported by vending-machine placements of citrus-forward SKUs and seasonal gift-pack campaigns. While OECD nations maintain stable demand via retail, BRICS countries like India and China show higher potential through digital-led expansion and domestic ingredient sourcing.

In-depth Analysis of Fruit Tea Market in the USA

The USA market is projected to advance at a 4.1% CAGR across the forecast period. Growth is being powered by consumers who have pivoted from sugary carbonates toward botanically infused hydration, a trend amplified by the calorie-labeling mandates rolled out nationwide.

Major grocery chains are allocating additional shelf frontage to freeze-dried and functional powder blends positioned for immunity, while ready-to-drink formats have entered convenience outlets that once focused on energy drinks. National café franchises now rotate seasonal hibiscus-berry infusions, driving menu visibility and social-media engagement.

  • Menu rotation in cafés lifts trial
  • Citrus sourcing contracts cut lead times
  • Subscription boxes deepen household penetration

Opportunity Analysis of Fruit Tea Market in Germany

Germany’s industry is set to expand at a 4.6% CAGR from 2025 to 2035. Domestic growth is being underwritten by the country’s long-standing herbal-infusion tradition and strict sugar-reduction targets adopted in retail. Drugstore chains such as dm and Rossmann have doubled facings for unsweetened hibiscus-apple and elderberry blends bearing Bio (organic) seals, a move that aligns with Germany’s preference for certified clean-label beverages.

Cold-brew fruit tea, launched in PET carafes for at-work consumption, has captured incremental office-snack occasions. Bavarian processors have invested in low-oxygen bottling lines, preserving polyphenol content and extending shelf life for export shipments into Austria, Switzerland, and the Benelux.

  • Organic seals drive shelf gains
  • Cold-brew format captures office occasions
  • Loyalty rewards push quarterly reorders

Sales Analysis of Fruit Tea Market in China

The market in China is forecast to climb at a 4.2% CAGR between 2025 and 2035. The rise of domestic beverage chains, from Shanghai to Chengdu, has normalized fruit-based infusions as everyday refreshers, especially among consumers seeking a mild alternative to sugary milk tea.

Provincial fruit processors are supplying freeze-dried pitaya, lychee, and kumquat inclusions, giving brands a provenance story that resonates on Douyin and WeChat channels. Cross-border e-commerce hubs in Hangzhou have shortened import clearance for premium European berry blends, widening assortment on leading marketplaces. Live-stream promotions run by key-opinion leaders routinely sell out limited bundles, converting impulse interest into high-frequency orders.

  • Domestic chains popularize fruit infusions
  • Live-streams trigger rapid sell-outs
  • Rail corridors open re-export channels

Demand Analysis for Fruit Tea Market in Japan

Japan’s market is anticipated to record a 4.0% CAGR throughout the projection horizon. Convenience-store operators, known for rapid product-cycle testing, have adopted single-serve chilled fruit-tea bottles positioned beside unsweetened green-tea classics, capturing impulse-buy traffic during commuting hours. Vending-machine networks, covering almost every urban corner, now feature rotating fruit-tea SKUs with regional fruit icons such as Yuzu and Shikuwasa, reinforcing local-produce narratives.

Beverage firms have leveraged in-house R&D to blend amino-acid fortifiers with citrus bases, framing the drinks as post-workout hydration aids. Collaboration between tea houses and confectionery brands has produced limited-edition gift packs, intensifying holiday demand.

  • Convenience stores boost commuter uptake
  • Vending rotation showcases regional fruit
  • Gift-pack collaborations spur seasonal sales

Demand Outlook for Fruit Tea Market in India

The market in India is projected to register a 4.7% CAGR during the forecast period, the fastest among the five nations considered. Urban cafés in Bengaluru, Mumbai, and Delhi have introduced tropical fruit infusions aligned with Ayurvedic wellness themes, appealing to young professionals shifting away from sugar-laden soft drinks.

Domestic tea start-ups leverage smartphone commerce, offering sachet bundles via quick-delivery apps that reach consumers within an hour, reinforcing trial loops in densely populated metros. Cold-chain investments along the Mumbai-Ahmedabad corridor enable distribution of ready-to-drink fruit-tea cans in temperatures exceeding 35 °C, protecting flavor integrity and extending shelf life.

  • Quick-delivery apps speed sachet reach
  • Cold-chain corridors secure RTD quality
  • Local fruit tie-ups trim import dependence

Leading Fruit Tea Market Distributors

In the fruit tea market, leading companies leverage a combination of health-focused innovation, ethical sourcing, and streamlined distribution. Brands like Twinings, Unilever, and Hain Celestial are expanding globally by offering functional blends tied to sleep, digestion, and immunity, often positioned within wellness aisles or online platforms.

Their strategies rely heavily on existing tea-processing infrastructure, allowing them to scale RTD and single-serve formats without major capital investment. Ingredient suppliers such as Martin Bauer and Van Rees play a backend role by supporting private-label and bulk needs, enabling faster SKU turnover for retailers across Europe and Asia. Regional players like Dilmah and The London Tea Company are growing in premium segments by emphasizing single-origin sourcing, Fairtrade credentials, and limited-edition seasonal blends. Duncans Industries is tapping into India’s biodiversity to develop tropical variants for ASEAN and Gulf buyers.

Competitive intensity in this space is increasing due to low entry barriers at the mid-tier level and strong consumer appetite for variety. However, defending market share in the premium and functional categories requires tighter control over sourcing, traceability, and health-related claims. Most players are focusing on three core strategies: building product differentiation through botanicals and flavor systems, expanding into RTD and digital channels, and forming co-manufacturing or private-label alliances to reduce production risk and respond to fast-changing demand.

Recent Fruit Tea Industry News

  • In December 2024, Typhoo Tea Ltd was acquired by Supreme in a £10.2 million deal. Supreme’s CEO highlighted that the acquisition is part of a broader diversification strategy, aiming to leverage Typhoo’s brand for cross-selling and product, especially in soft drinks and fruit teas.

Leading Players in Fruit Tea Market

  • Twinings
  • Tetley
  • Unilever
  • Martin Bauer Group
  • Typhoo Tea Ltd
  • Van Rees
  • The London Tea Company
  • Dilmah
  • Hain Celestial Group Inc
  • Duncans Industries Ltd.

Report Coverage and Scope Summary

Report Attributes Details
Market Size (2025) USD 2.9 billion
Projected Market Size (2035) USD 4.4 billion
CAGR (2025 to 2035) 4.3%
Base Year for Estimation 2024
Historical Period 2020 to 2024
Projections Period 2025 to 2035
Quantitative Units USD billion for value
Product Form Analyzed (Segment 1) Powder, Ready To Drink, And Instant Premixes.
Product Type Analyzed (Segment 2) Traditional, Unsweetened, And Sweetened.
Distribution Channel Analyzed (Segment 3) Supermarkets/Hypermarkets, Specialty Stores, Online Sales, Retail Stores, And Departmental Stores.
Regions Covered North America, Europe, Asia Pacific, Middle East & Africa, Latin America
Countries Covered United States, Canada, Germany, United Kingdom, France, Italy, Spain, China, Japan, South Korea, India, Australia, Brazil, Mexico, Argentina, Saudi Arabia, UAE, South Africa
Key Players Twinings, Tetley, Unilever, Martin Bauer Group, Typhoo Tea Ltd, Van Rees, The London Tea Company, Dilmah, Hain Celestial Group Inc, and Duncans Industries Ltd.
Additional Attributes Dollar sales, share, flavor trends, format preferences, pricing benchmarks, key regions, consumer buying behavior, growth by channel, private label impact, competitor SKUs, and opportunities.

Key Segments

By Product Form:

The industry is segmented into powder, ready to drink, and instant premixes.

By Product Type:

The industry is segmented into traditional, unsweetened, and sweetened.

By Distribution Channel:

The industry finds supermarkets/hypermarkets, specialty stores, online sales, retail stores, and departmental stores.

By Region:

The industry covers regions including North America, Europe, Asia Pacific, Latin America, and the Middle East & Africa.

Table of Content

  1. Executive Summary
    • Global Market Outlook
    • Demand-side Trends
    • Supply-side Trends
    • Technology Roadmap Analysis
    • Analysis and Recommendations
  2. Market Overview
    • Market Coverage/Taxonomy
    • Market Definition/Scope/Limitations
  3. Market Background
    • Market Dynamics
      • Drivers
      • Restraints
      • Opportunity
      • Trends
    • Scenario Forecast
      • Demand in Optimistic Scenario
      • Demand in Likely Scenario
      • Demand in Conservative Scenario
    • Opportunity Map Analysis
    • Product Life Cycle Analysis
    • Supply Chain Analysis
      • Supply Side Participants and their Roles
        • Producers
        • Mid-Level Participants (Traders/ Agents/ Brokers)
        • Wholesalers and Distributors
      • Value Added and Value Created at Node in the Supply Chain
      • List of Raw Material Suppliers
      • List of Existing and Potential Buyer’s
    • Investment Feasibility Matrix
    • Value Chain Analysis
      • Profit Margin Analysis
      • Wholesalers and Distributors
      • Retailers
    • PESTLE and Porter’s Analysis
    • Regulatory Landscape
      • By Key Regions
      • By Key Countries
    • Regional Parent Market Outlook
    • Production and Consumption Statistics
    • Import and Export Statistics
  4. Global Market Analysis 2020 to 2024 and Forecast, 2025 to 2035
    • Historical Market Size Value (USD Billion) Analysis, 2020 to 2024
    • Current and Future Market Size Value (USD Billion) Projections, 2025 to 2035
      • Y-o-Y Growth Trend Analysis
      • Absolute $ Opportunity Analysis
  5. Global Market Pricing Analysis 2020 to 2024 and Forecast 2025 to 2035
  6. Global Market Analysis 2020 to 2024 and Forecast 2025 to 2035, By Product Form
    • Introduction/Key Findings
    • Historical Market Size Value (USD Billion) Analysis By Product Form, 2020 to 2024
    • Current and Future Market Size Value (USD Billion) Analysis and Forecast By Product Form, 2025 to 2035
      • Powder
      • Ready to Drink
      • Instant Premixes
    • Y-o-Y Growth Trend Analysis By Product Form, 2020 to 2024
    • Absolute $ Opportunity Analysis By Product Form, 2025 to 2035
  7. Global Market Analysis 2020 to 2024 and Forecast 2025 to 2035, By Product Type
    • Introduction/Key Findings
    • Historical Market Size Value (USD Billion) Analysis By Product Type, 2020 to 2024
    • Current and Future Market Size Value (USD Billion) Analysis and Forecast By Product Type, 2025 to 2035
      • Traditional
      • Unsweetened
      • Sweetened
    • Y-o-Y Growth Trend Analysis By Product Type, 2020 to 2024
    • Absolute $ Opportunity Analysis By Product Type, 2025 to 2035
  8. Global Market Analysis 2020 to 2024 and Forecast 2025 to 2035, By Distribution Channel
    • Introduction/Key Findings
    • Historical Market Size Value (USD Billion) Analysis By Distribution Channel, 2020 to 2024
    • Current and Future Market Size Value (USD Billion) Analysis and Forecast By Distribution Channel, 2025 to 2035
      • Supermarket/Hypermarket
      • Specialty Stores
      • Online Sales
      • Retail Stores
      • Departmental Stores
    • Y-o-Y Growth Trend Analysis By Distribution Channel, 2020 to 2024
    • Absolute $ Opportunity Analysis By Distribution Channel, 2025 to 2035
  9. Global Market Analysis 2020 to 2024 and Forecast 2025 to 2035, By Region
    • Introduction
    • Historical Market Size Value (USD Billion) Analysis By Region, 2020 to 2024
    • Current Market Size Value (USD Billion) Analysis and Forecast By Region, 2025 to 2035
      • North America
      • Latin America
      • Western Europe
      • Eastern Europe
      • East Asia
      • South Asia & Pacific
      • Middle East and Africa
    • Market Attractiveness Analysis By Region
  10. North America Market Analysis 2020 to 2024 and Forecast 2025 to 2035, By Country
    • Historical Market Size Value (USD Billion) Trend Analysis By Market Taxonomy, 2020 to 2024
    • Market Size Value (USD Billion) Forecast By Market Taxonomy, 2025 to 2035
      • By Country
        • USA
        • Canada
        • Mexico
      • By Product Form
      • By Product Type
      • By Distribution Channel
    • Market Attractiveness Analysis
      • By Country
      • By Product Form
      • By Product Type
      • By Distribution Channel
    • Key Takeaways
  11. Latin America Market Analysis 2020 to 2024 and Forecast 2025 to 2035, By Country
    • Historical Market Size Value (USD Billion) Trend Analysis By Market Taxonomy, 2020 to 2024
    • Market Size Value (USD Billion) Forecast By Market Taxonomy, 2025 to 2035
      • By Country
        • Brazil
        • Argentina
        • Rest of LATAM
      • By Product Form
      • By Product Type
      • By Distribution Channel
    • Market Attractiveness Analysis
      • By Country
      • By Product Form
      • By Product Type
      • By Distribution Channel
    • Key Takeaways
  12. Western Europe Market Analysis 2020 to 2024 and Forecast 2025 to 2035, By Country
    • Historical Market Size Value (USD Billion) Trend Analysis By Market Taxonomy, 2020 to 2024
    • Market Size Value (USD Billion) Forecast By Market Taxonomy, 2025 to 2035
      • By Country
        • Germany
        • Italy
        • France
        • UK
        • Spain
        • BENELUX
        • Nordic
        • Rest of W.Europe
      • By Product Form
      • By Product Type
      • By Distribution Channel
    • Market Attractiveness Analysis
      • By Country
      • By Product Form
      • By Product Type
      • By Distribution Channel
    • Key Takeaways
  13. Eastern Europe Market Analysis 2020 to 2024 and Forecast 2025 to 2035, By Country
    • Historical Market Size Value (USD Billion) Trend Analysis By Market Taxonomy, 2020 to 2024
    • Market Size Value (USD Billion) Forecast By Market Taxonomy, 2025 to 2035
      • By Country
        • Russia
        • Hungary
        • Poland
        • Balkan & Baltics
        • Rest of E. Europe
      • By Product Form
      • By Product Type
      • By Distribution Channel
    • Market Attractiveness Analysis
      • By Country
      • By Product Form
      • By Product Type
      • By Distribution Channel
    • Key Takeaways
  14. East Asia Market Analysis 2020 to 2024 and Forecast 2025 to 2035, By Country
    • Historical Market Size Value (USD Billion) Trend Analysis By Market Taxonomy, 2020 to 2024
    • Market Size Value (USD Billion) Forecast By Market Taxonomy, 2025 to 2035
      • By Country
        • China
        • Japan
        • South Korea
      • By Product Form
      • By Product Type
      • By Distribution Channel
    • Market Attractiveness Analysis
      • By Country
      • By Product Form
      • By Product Type
      • By Distribution Channel
    • Key Takeaways
  15. South Asia & Pacific Market Analysis 2020 to 2024 and Forecast 2025 to 2035, By Country
    • Historical Market Size Value (USD Billion) Trend Analysis By Market Taxonomy, 2020 to 2024
    • Market Size Value (USD Billion) Forecast By Market Taxonomy, 2025 to 2035
      • By Country
        • India
        • Australia & New Zealand
        • ASEAN
        • Rest of SAP
      • By Product Form
      • By Product Type
      • By Distribution Channel
    • Market Attractiveness Analysis
      • By Country
      • By Product Form
      • By Product Type
      • By Distribution Channel
    • Key Takeaways
  16. Middle East and Africa Market Analysis 2020 to 2024 and Forecast 2025 to 2035, By Country
    • Historical Market Size Value (USD Billion) Trend Analysis By Market Taxonomy, 2020 to 2024
    • Market Size Value (USD Billion) Forecast By Market Taxonomy, 2025 to 2035
      • By Country
        • GCC Countries
        • Northern Africa
        • South Africa
        • Turkiye
        • Rest of MEA
      • By Product Form
      • By Product Type
      • By Distribution Channel
    • Market Attractiveness Analysis
      • By Country
      • By Product Form
      • By Product Type
      • By Distribution Channel
    • Key Takeaways
  17. Key Countries Market Analysis
    • USA
      • Pricing Analysis
      • Market Share Analysis, 2024
        • By Product Form
        • By Product Type
        • By Distribution Channel
    • Canada
      • Pricing Analysis
      • Market Share Analysis, 2024
        • By Product Form
        • By Product Type
        • By Distribution Channel
    • Brazil
      • Pricing Analysis
      • Market Share Analysis, 2024
        • By Product Form
        • By Product Type
        • By Distribution Channel
    • Mexico
      • Pricing Analysis
      • Market Share Analysis, 2024
        • By Product Form
        • By Product Type
        • By Distribution Channel
    • Argentina
      • Pricing Analysis
      • Market Share Analysis, 2024
        • By Product Form
        • By Product Type
        • By Distribution Channel
  18. Market Structure Analysis
    • Competition Dashboard
    • Competition Benchmarking
    • Market Share Analysis of Top Players
      • By Regional
      • By Product Form
      • By Product Type
      • By Distribution Channel
  19. Competition Analysis
    • Competition Deep Dive
      • Twinings
        • Overview
        • Product Portfolio
        • Profitability by Market Segments (Product/Age /Sales Channel/Region)
        • Sales Footprint
        • Strategy Overview
          • Marketing Strategy
          • Product Strategy
          • Channel Strategy
      • Tetley
        • Overview
        • Product Portfolio
        • Profitability by Market Segments (Product/Age /Sales Channel/Region)
        • Sales Footprint
        • Strategy Overview
          • Marketing Strategy
          • Product Strategy
          • Channel Strategy
      • Unilever
        • Overview
        • Product Portfolio
        • Profitability by Market Segments (Product/Age /Sales Channel/Region)
        • Sales Footprint
        • Strategy Overview
          • Marketing Strategy
          • Product Strategy
          • Channel Strategy
      • Martin Bauer Group
        • Overview
        • Product Portfolio
        • Profitability by Market Segments (Product/Age /Sales Channel/Region)
        • Sales Footprint
        • Strategy Overview
          • Marketing Strategy
          • Product Strategy
          • Channel Strategy
      • Typhoo Tea Ltd
        • Overview
        • Product Portfolio
        • Profitability by Market Segments (Product/Age /Sales Channel/Region)
        • Sales Footprint
        • Strategy Overview
          • Marketing Strategy
          • Product Strategy
          • Channel Strategy
      • Van Rees
        • Overview
        • Product Portfolio
        • Profitability by Market Segments (Product/Age /Sales Channel/Region)
        • Sales Footprint
        • Strategy Overview
          • Marketing Strategy
          • Product Strategy
          • Channel Strategy
      • The London Tea Company
        • Overview
        • Product Portfolio
        • Profitability by Market Segments (Product/Age /Sales Channel/Region)
        • Sales Footprint
        • Strategy Overview
          • Marketing Strategy
          • Product Strategy
          • Channel Strategy
      • Dilmah
        • Overview
        • Product Portfolio
        • Profitability by Market Segments (Product/Age /Sales Channel/Region)
        • Sales Footprint
        • Strategy Overview
          • Marketing Strategy
          • Product Strategy
          • Channel Strategy
      • Hain Celestial Group Inc
        • Overview
        • Product Portfolio
        • Profitability by Market Segments (Product/Age /Sales Channel/Region)
        • Sales Footprint
        • Strategy Overview
          • Marketing Strategy
          • Product Strategy
          • Channel Strategy
      • Duncans Industries Ltd.
        • Overview
        • Product Portfolio
        • Profitability by Market Segments (Product/Age /Sales Channel/Region)
        • Sales Footprint
        • Strategy Overview
          • Marketing Strategy
          • Product Strategy
          • Channel Strategy
  20. Assumptions & Acronyms Used
  21. Research Methodology

List of Tables

  • Table 1: Global Market Value (USD Billion) Forecast by Region, 2020-2035
  • Table 2: Global Market Value (USD Billion) Forecast by Product Form, 2020-2035
  • Table 3: Global Market Value (USD Billion) Forecast by Product Type, 2020-2035
  • Table 4: Global Market Value (USD Billion) Forecast by Distribution Channel, 2020-2035
  • Table 5: North America Market Value (USD Billion) Forecast by Country, 2020-2035
  • Table 6: North America Market Value (USD Billion) Forecast by Product Form, 2020-2035
  • Table 7: North America Market Value (USD Billion) Forecast by Product Type, 2020-2035
  • Table 8: North America Market Value (USD Billion) Forecast by Distribution Channel, 2020-2035
  • Table 9: Latin America Market Value (USD Billion) Forecast by Country, 2020-2035
  • Table 10: Latin America Market Value (USD Billion) Forecast by Product Form, 2020-2035
  • Table 11: Latin America Market Value (USD Billion) Forecast by Product Type, 2020-2035
  • Table 12: Latin America Market Value (USD Billion) Forecast by Distribution Channel, 2020-2035
  • Table 13: Western Europe Market Value (USD Billion) Forecast by Country, 2020-2035
  • Table 14: Western Europe Market Value (USD Billion) Forecast by Product Form, 2020-2035
  • Table 15: Western Europe Market Value (USD Billion) Forecast by Product Type, 2020-2035
  • Table 16: Western Europe Market Value (USD Billion) Forecast by Distribution Channel, 2020-2035
  • Table 17: Eastern Europe Market Value (USD Billion) Forecast by Country, 2020-2035
  • Table 18: Eastern Europe Market Value (USD Billion) Forecast by Product Form, 2020-2035
  • Table 19: Eastern Europe Market Value (USD Billion) Forecast by Product Type, 2020-2035
  • Table 20: Eastern Europe Market Value (USD Billion) Forecast by Distribution Channel, 2020-2035
  • Table 21: East Asia Market Value (USD Billion) Forecast by Country, 2020-2035
  • Table 22: East Asia Market Value (USD Billion) Forecast by Product Form, 2020-2035
  • Table 23: East Asia Market Value (USD Billion) Forecast by Product Type, 2020-2035
  • Table 24: East Asia Market Value (USD Billion) Forecast by Distribution Channel, 2020-2035
  • Table 25: South Asia & Pacific Market Value (USD Billion) Forecast by Country, 2020-2035
  • Table 26: South Asia & Pacific Market Value (USD Billion) Forecast by Product Form, 2020-2035
  • Table 27: South Asia & Pacific Market Value (USD Billion) Forecast by Product Type, 2020-2035
  • Table 28: South Asia & Pacific Market Value (USD Billion) Forecast by Distribution Channel, 2020-2035
  • Table 29: Middle East and Africa Market Value (USD Billion) Forecast by Country, 2020-2035
  • Table 30: Middle East and Africa Market Value (USD Billion) Forecast by Product Form, 2020-2035
  • Table 31: Middle East and Africa Market Value (USD Billion) Forecast by Product Type, 2020-2035
  • Table 32: Middle East and Africa Market Value (USD Billion) Forecast by Distribution Channel, 2020-2035

List of Figures

  • Figure 1: Global Market Pricing Analysis
  • Figure 2: Global Market Value (USD Billion) Forecast 2020-2035
  • Figure 3: Global Market Value Share and BPS Analysis by Product Form, 2025 and 2035
  • Figure 4: Global Market Y-o-Y Growth Comparison by Product Form, 2025-2035
  • Figure 5: Global Market Attractiveness Analysis by Product Form
  • Figure 6: Global Market Value Share and BPS Analysis by Product Type, 2025 and 2035
  • Figure 7: Global Market Y-o-Y Growth Comparison by Product Type, 2025-2035
  • Figure 8: Global Market Attractiveness Analysis by Product Type
  • Figure 9: Global Market Value Share and BPS Analysis by Distribution Channel, 2025 and 2035
  • Figure 10: Global Market Y-o-Y Growth Comparison by Distribution Channel, 2025-2035
  • Figure 11: Global Market Attractiveness Analysis by Distribution Channel
  • Figure 12: Global Market Value (USD Billion) Share and BPS Analysis by Region, 2025 and 2035
  • Figure 13: Global Market Y-o-Y Growth Comparison by Region, 2025-2035
  • Figure 14: Global Market Attractiveness Analysis by Region
  • Figure 15: North America Market Incremental $ Opportunity, 2025-2035
  • Figure 16: Latin America Market Incremental $ Opportunity, 2025-2035
  • Figure 17: Western Europe Market Incremental $ Opportunity, 2025-2035
  • Figure 18: Eastern Europe Market Incremental $ Opportunity, 2025-2035
  • Figure 19: North America Market Value Share and BPS Analysis by Country, 2025 and 2035
  • Figure 20: North America Market Value Share and BPS Analysis by Product Form, 2025 and 2035
  • Figure 21: North America Market Y-o-Y Growth Comparison by Product Form, 2025-2035
  • Figure 22: North America Market Attractiveness Analysis by Product Form
  • Figure 23: North America Market Value Share and BPS Analysis by Product Type, 2025 and 2035
  • Figure 24: North America Market Y-o-Y Growth Comparison by Product Type, 2025-2035
  • Figure 25: North America Market Attractiveness Analysis by Product Type
  • Figure 26: North America Market Value Share and BPS Analysis by Distribution Channel, 2025 and 2035
  • Figure 27: North America Market Y-o-Y Growth Comparison by Distribution Channel, 2025-2035
  • Figure 28: North America Market Attractiveness Analysis by Distribution Channel
  • Figure 29: Latin America Market Value Share and BPS Analysis by Country, 2025 and 2035
  • Figure 30: Latin America Market Value Share and BPS Analysis by Product Form, 2025 and 2035
  • Figure 31: Latin America Market Y-o-Y Growth Comparison by Product Form, 2025-2035
  • Figure 32: Latin America Market Attractiveness Analysis by Product Form
  • Figure 33: Latin America Market Value Share and BPS Analysis by Product Type, 2025 and 2035
  • Figure 34: Latin America Market Y-o-Y Growth Comparison by Product Type, 2025-2035
  • Figure 35: Latin America Market Attractiveness Analysis by Product Type
  • Figure 36: Latin America Market Value Share and BPS Analysis by Distribution Channel, 2025 and 2035
  • Figure 37: Latin America Market Y-o-Y Growth Comparison by Distribution Channel, 2025-2035
  • Figure 38: Latin America Market Attractiveness Analysis by Distribution Channel
  • Figure 39: Western Europe Market Value Share and BPS Analysis by Country, 2025 and 2035
  • Figure 40: Western Europe Market Value Share and BPS Analysis by Product Form, 2025 and 2035
  • Figure 41: Western Europe Market Y-o-Y Growth Comparison by Product Form, 2025-2035
  • Figure 42: Western Europe Market Attractiveness Analysis by Product Form
  • Figure 43: Western Europe Market Value Share and BPS Analysis by Product Type, 2025 and 2035
  • Figure 44: Western Europe Market Y-o-Y Growth Comparison by Product Type, 2025-2035
  • Figure 45: Western Europe Market Attractiveness Analysis by Product Type
  • Figure 46: Western Europe Market Value Share and BPS Analysis by Distribution Channel, 2025 and 2035
  • Figure 47: Western Europe Market Y-o-Y Growth Comparison by Distribution Channel, 2025-2035
  • Figure 48: Western Europe Market Attractiveness Analysis by Distribution Channel
  • Figure 49: Eastern Europe Market Value Share and BPS Analysis by Country, 2025 and 2035
  • Figure 50: Eastern Europe Market Value Share and BPS Analysis by Product Form, 2025 and 2035
  • Figure 51: Eastern Europe Market Y-o-Y Growth Comparison by Product Form, 2025-2035
  • Figure 52: Eastern Europe Market Attractiveness Analysis by Product Form
  • Figure 53: Eastern Europe Market Value Share and BPS Analysis by Product Type, 2025 and 2035
  • Figure 54: Eastern Europe Market Y-o-Y Growth Comparison by Product Type, 2025-2035
  • Figure 55: Eastern Europe Market Attractiveness Analysis by Product Type
  • Figure 56: Eastern Europe Market Value Share and BPS Analysis by Distribution Channel, 2025 and 2035
  • Figure 57: Eastern Europe Market Y-o-Y Growth Comparison by Distribution Channel, 2025-2035
  • Figure 58: Eastern Europe Market Attractiveness Analysis by Distribution Channel
  • Figure 59: East Asia Market Value Share and BPS Analysis by Country, 2025 and 2035
  • Figure 60: East Asia Market Value Share and BPS Analysis by Product Form, 2025 and 2035
  • Figure 61: East Asia Market Y-o-Y Growth Comparison by Product Form, 2025-2035
  • Figure 62: East Asia Market Attractiveness Analysis by Product Form
  • Figure 63: East Asia Market Value Share and BPS Analysis by Product Type, 2025 and 2035
  • Figure 64: East Asia Market Y-o-Y Growth Comparison by Product Type, 2025-2035
  • Figure 65: East Asia Market Attractiveness Analysis by Product Type
  • Figure 66: East Asia Market Value Share and BPS Analysis by Distribution Channel, 2025 and 2035
  • Figure 67: East Asia Market Y-o-Y Growth Comparison by Distribution Channel, 2025-2035
  • Figure 68: East Asia Market Attractiveness Analysis by Distribution Channel
  • Figure 69: South Asia & Pacific Market Value Share and BPS Analysis by Country, 2025 and 2035
  • Figure 70: South Asia & Pacific Market Value Share and BPS Analysis by Product Form, 2025 and 2035
  • Figure 71: South Asia & Pacific Market Y-o-Y Growth Comparison by Product Form, 2025-2035
  • Figure 72: South Asia & Pacific Market Attractiveness Analysis by Product Form
  • Figure 73: South Asia & Pacific Market Value Share and BPS Analysis by Product Type, 2025 and 2035
  • Figure 74: South Asia & Pacific Market Y-o-Y Growth Comparison by Product Type, 2025-2035
  • Figure 75: South Asia & Pacific Market Attractiveness Analysis by Product Type
  • Figure 76: South Asia & Pacific Market Value Share and BPS Analysis by Distribution Channel, 2025 and 2035
  • Figure 77: South Asia & Pacific Market Y-o-Y Growth Comparison by Distribution Channel, 2025-2035
  • Figure 78: South Asia & Pacific Market Attractiveness Analysis by Distribution Channel
  • Figure 79: Middle East and Africa Market Value Share and BPS Analysis by Country, 2025 and 2035
  • Figure 80: Middle East and Africa Market Value Share and BPS Analysis by Product Form, 2025 and 2035
  • Figure 81: Middle East and Africa Market Y-o-Y Growth Comparison by Product Form, 2025-2035
  • Figure 82: Middle East and Africa Market Attractiveness Analysis by Product Form
  • Figure 83: Middle East and Africa Market Value Share and BPS Analysis by Product Type, 2025 and 2035
  • Figure 84: Middle East and Africa Market Y-o-Y Growth Comparison by Product Type, 2025-2035
  • Figure 85: Middle East and Africa Market Attractiveness Analysis by Product Type
  • Figure 86: Middle East and Africa Market Value Share and BPS Analysis by Distribution Channel, 2025 and 2035
  • Figure 87: Middle East and Africa Market Y-o-Y Growth Comparison by Distribution Channel, 2025-2035
  • Figure 88: Middle East and Africa Market Attractiveness Analysis by Distribution Channel
  • Figure 89: Global Market - Tier Structure Analysis
  • Figure 90: Global Market - Company Share Analysis

Frequently Asked Questions

What is the estimated market size of the fruit tea industry in 2025?

The industry is valued at USD 2.9 billion in 2025.

What is the projected industry size of the fruit tea industry by 2035?

It is forecasted to reach USD 4.4 billion by 2035.

What is the expected CAGR for the fruit tea industry between 2025 and 2035?

The industry is anticipated to grow at a CAGR of 4.3% during this period.

Which segment is expected to lead the fruit tea market in 2025?

Powder are projected to lead the market with a 55% share in 2025.

Which region is expected to witness the highest growth in the fruit tea market?

Asia Pacific, particularly India, is expected to be the key growth region with a projected growth rate of 4.7%.

Explore Similar Insights

Future Market Insights

Fruit Tea Market