The fruit jams, jellies, and preserves market is estimated to be valued at USD 2.08 billion in 2025 and is projected to reach USD 3.59 billion by 2035, expanding at a CAGR of 5.6% during the forecast period.
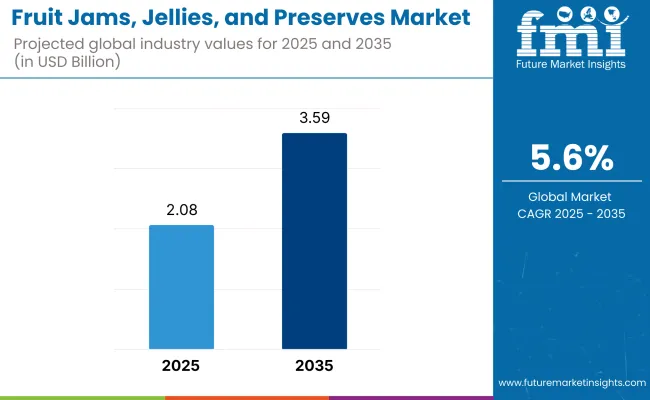
The industry is on the path of a slow-but-steady growth in line with the trends of the times: customers are increasingly looking for natural, unprocessed, and tasteful types of spread. These are the fruit-based varieties that are most often used for breakfast, dessert. and bakery items that are appealing to homes, eateries, and food manufacturers. Increases in the demand for organic, sugar-free, and unusual fruit flavors have been identified as the main factors for the rise of the industry.
The leading driver of this growth is, above all, people`s eye on sustainable, health-friendly foods that are clear label. Thus, wise fruit and veggies lovers have been turned to the fruit jams, jellies, and preserves that are made with not less than 50% fruits, natural sweeteners, and absolutely no preservatives. Furthermore, the very request of additives like fiber, probiotics, and super fruits contains part of the changing direction of the industry.
The boom in the local handicraft and gourmet fruit preserves has also impacted the industry trends. Established names in the industry have also started brands by releasing low-consumption energy, handmade, and flavored jams and jellies. These brands offer trolley combinations, flower infusions, and spice blends. Todays' homemade and local fruit preservatives are becoming a major marketing factor too.
Merits due to research and development in fruit processing, pectin extraction, and natural techniques for preservation that are involved are not just product quality gains. Also, the use of such stylish and environment-friendly packaging has been embraced enthusiastically by the public because they care about the planet more now. On top of this, the e-commerce boom coupled with the use of the sales channels in the direct-to-consumer format are making the game broader and the product palette wider.
Notwithstanding, the industry has to deal with some drawbacks like the rise and fall of fruit prices, the worry over the amount of sugar that goes into traditional jellies and jams that come in the form of other sweet spreads including nut butter and honey. Moreover, the food labeling rules and sugar reduction initiatives that are regulatory may change product formulations.
Nonetheless, adequate opportunities for industry expansion are available. The need for plant-based, diabetic-friendly, and functional fruit spreads along with the above-mentioned developments will be the sources of new growth. Moreover, the increasing stake in organic farming, and environmental sustainability practices will lead to more innovations as a ripple effect. As long as people continue to change, the industry will be always on the road to progress, be it 5 or even more years.
The fruit industry is steadily growing owing to the growing need for clean-label, organic, and low-sugar products. The products are being demanded by customers with natural ingredients, actual content of fruits, and fewer preservatives, thus promoting the development of artisan and gourmet types.
Hotels, cafes, and restaurants in the food service sector favor bulk packaging and value-oriented procurement, with conventional flavors such as strawberry and apricot being the most popular. The bakery industry incorporates preserves and jams into pastries, cakes, and fillings, spurring demand for heat-resistant products. Fruit preserves are applied in yogurts and ice creams by the dairy industry, with increasing popularity for fruit combinations from exotic fruits.
Product innovation is key, with functional, sugar-free, and probiotic jams being popular. Sustainability trends are also being felt in the industry, with brands promoting sustainable packaging and locally sourced fruits to reach out to environment-aware and health-conscious consumers.
The following table is a comparative evaluation of the change in CAGR for six months in the base year (2024) and the current year (2025) for the industry. The analysis provides a significant observation of industry trends in performance, reflecting revenue realization patterns and helping stakeholders gain a better idea about the direction of the industry.
| Particulars | CAGR |
|---|---|
| H1 (2024 to 2034) | 5.2% |
| H2 (2024 to 2034) | 5.4% |
| H1 (2025 to 2035) | 5.3% |
| H2 (2025 to 2035) | 5.6% |
The first half year (H1) is from January to June, and the second half (H2) is from July to December. The industry is anticipated to see steady growth with a significant boost in demand for organic and natural fruit spreads. During the first half (H1) of the period 2025 to 2035, the sector is expected to expand at a CAGR of 5.4%, and then marginally higher growth rate of 5.6% in the second half (H2). The sector grew by 10 BPS in H1, whereas H2 witnessed a marginal growth of 20 BPS.
Between 2020 and 2024, the industry shifted towards deeper fruit flavors as consumers turned against sweet, jelly-like spreads. Younger segments, especially, preferred strong flavor profiles, higher-end pairings, and imported fruit types. Manufacturers segmented on higher fruit content, reduced added sugar, and increased emphasis on small-batch and artisanal manufacturing.
The revitalized breakfast culture, spearheaded by home use patterns and social media influence, also drove demand for premium fruit spreads. Brands expanded convenient package forms and partnered with bakeries and cafes to add products to breakfast menus. Fruit spreads also discovered new kitchen uses for mixology and gourmet cooking, leading the manufacturers to introduce specialty flavors laced with spices, alcohol, and savory ingredients.
2025 to 2035 will witness the direction of the industry change with added emphasis on functional fortification and personal nutrition. Spreads fortified with additional probiotics, fiber, adaptogens, and herb extracts for their nutritional value rather than necessarily flavor is what shoppers will seek out. Individualization by Artificial Intelligence will pave the way for the potential of spreads that are particularly formulated to provide specific nutritional needs.
Sustainability will also be the mode, with businesses employing biodegradable packaging, carbon-neutral production, and upcycled fruit material. AI-based food processing will maximize flavor and texture consistency and ensure nutritional purity. As the smart labeling technology makes strides, health advantages and availability of sources will be selling drivers, increasing consumer confidence and interest in turn.
Comparative Market Shift Analysis (2020 to 2024 vs. 2025 to 2035)
| 2020 to 2024 | 2025 to 2035 |
|---|---|
| Increased customer demand for natural and organic fruit preserves, domestic baking activity, and high-end jam products. | Food technological innovations, increases in functional and fortified fruit spreads, and environmental-friendly packaging demands. |
| Trend for low-sugar, organic, and handmade jams with tropical fruit flavors. | Trend towards sugar-free, probiotic-fortified, and nutrition-based individual fruit preserves. |
| Introduction of sugar-reduced and sugar-free alternatives, natural sweeteners such as stevia and honey. | Artificial intelligence-powered flavor personalization, intelligent-label technology for transparent ingredients, and fruit extracts lab-grown. |
| Use of recyclable glass containers, fair-trade and locally sourced fruits. | Biodegradable packaging, reuse of fruit waste, and carbon-neutral manufacturing. |
| Cold-processing methods to preserve fruit nutrients, automation in manufacturing. | Artificial intelligence-enabled quality control, blockchain-based traceability for raw material sourcing, and nano-encapsulation to improve flavor release. |
The supply chain risks for the industry are caused by seasonal fruit availability and climate conditions that influence crop yields. Weather conditions such as severe weather, droughts, and storms can disrupt the availability of fruits and create price swings and raw material shortages which necessitate diversification of procurement strategies and the offering of improved storage facilities.
Regulatory challenges play a fundamental role in industry processes with food safety levels and label requirements varying across regions. The companies are required to be adaptable as they adhere to the demands on sugar content, the application of preservatives, and organic labeling. Lack of compliance will result in product recalls, litigation, and loss of customers' trust, hence the need for stringent quality control and truthful labeling.
The shift in consumer choices towards dietary concerns and the respective health consciousness of these customers are the main reasons brands will be struggling now. The failure to develop innovative products will cost brands the ability to compete against, functional and health-focused spreads. Enterprises should augment the research and development; provide products with less sugar, natural ingredients, and superfood variants to cater to the changing dietary patterns and hence sustain the demand.
The fluctuation of prices of raw materials, including sugar and fruit, directly impacts the production costs. The vicissitudes of the economy, transportation costs, and the disturbances in the supply chain are the other causes of the instability in prices. Companies should proceed through the use of low-cost production methods, the establishment of long-term contracts with suppliers, and the search for alternative ingredients to reduce the financial risks.
With industry rivalry coming from private labels, artisanal producers, the emerging pressure on other established companies is a fact of life. Consumers are captivated by the idea of a product being locally made, consequently, large-scale manufacturers have to amplify the branding strategies, signify a superior quality, and present the products in innovative and unique ways to maintain brand loyalty and competitive advantage.
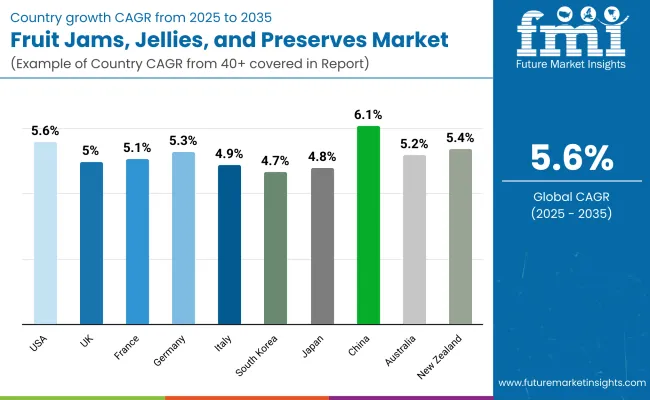
| Countries | CAGR (2025 to 2035) |
|---|---|
| USA | 5.6% |
| UK | 5% |
| France | 5.1% |
| Germany | 5.3% |
| Italy | 4.9% |
| South Korea | 4.7% |
| Japan | 4.8% |
| China | 6.1% |
| Australia | 5.2% |
| New Zealand | 5.4% |
The USA industry is projected to record a CAGR of 5.6% during 2025 to 2035. The industry is fueled by increasing consumer demand for natural and organic food, especially among health-concerned consumers. Companies are countering this with innovation in the form of sugar-reduced and functional ingredient-fortified spreads, such as those with superfruits, probiotics, and chia seeds. Increased breakfast and home-cooking culture have driven demand for high-end spreads, with internet shopping remaining central to industry growth.
Gourmet and artisanal varieties are growing, with small-factory firms increasing representation through direct consumer sales channels. Increasing Hispanic and Asian segments in the USA are driving flavor innovation, resulting in a diverse array of fruit spread varieties with exotic ingredients.
The UK industry is expected to achieve a CAGR of 5.0% during 2025 to 2035. There is a long-standing traditional consumption of fruit preserves in the country, especially for tea time and breakfast. Consumers are also moving towards no-added-sugar and low-sugar versions, and manufacturers are reformulating the recipes to include natural sweeteners such as honey and stevia.
Sustainability trends also affect the behavior of consumers when shopping, as companies consider recyclable packaging and sustainably produced products. Higher growth in plant-based eating has created more demand for alternative-ingredient-based spreads like coconut and almond butter blends. Private labels by major supermarket chains are adding tougher competition through the supply of cheaper but superior fruit preserves, further increasing industry diversity.
The French industry is expected to grow at a CAGR of 5.1% from 2025 to 2035. Good French breakfast culture remains conducive to consumption, as consumers look for high fruit concentration and natural products. Premiumization remains a primary trend, as premium brands offer distinctive flavors such as fig, lavender, and chestnut. Local and regional specialties, especially heritage fruit products, are in rising demand as people demand authenticity.
Organic farming is highly developed in France, and more certified organic lines are coming onto supermarket shelves. Small-production, artisan jams sold with handicraft charm are faring well, especially in specialist food shops and farmers' markets.
The German industry will grow at a CAGR of 5.3% during 2025 to 2035. Moreover, German consumers also like high-fruit-content jams and spreads with low application of artificial ingredients. Demand for traditional and locally available fruits like black currant and sour cherry continues to influence industry offerings.
The robust organic food culture in Germany is compelling manufacturers to launch labeled certified organic products. Seasonal, limited-edition flavors and cooperation with local fruit growers are keeping brands in the eyes of consumers. Discounters and supermarkets are creating premium ranges, widening consumers' choices, and therefore raising competition for mainstream brands and new entrants.
Italy's industry will grow at a CAGR of 4.9% from 2025 to 2035. Italian breakfast consumption trends are also evolving, with fruit preserves becoming a more popular accompaniment to baked goods and dairy foods. Mediterranean fruits are also in fashion in terms of the fruit preserve category, with fig and citrus-based fruit preserves being particularly in demand.
Consumers are looking for healthier alternatives, thus opening up space for organic and low-sugar products. Hand-made manufacturing is the focus, with local producers highlighting the regional heritage and authenticity of the fruit preserves. The hospitality industry, such as boutique hotels and cafés, is a prime consumer segment, fueling the premiumization trend.
South Korea's industry is projected to experience a CAGR of 4.7% from 2025 to 2035. Fruit spread demand in South Korea is driven by South Korea's lively café culture and the increasing popularity of Western breakfasts. Korean consumers are fond of unique and imaginative flavors like yuja (yuzu) and persimmon jams.
Health-conscious consumers seek lower-sugar and vitamin-fortified spreads, prompting leading brands to launch fortified variants. Increased home baking and dessert preparation have also driven the consumption of fruit preserves in pastry and confectionery.
The Japanese industry is expected to expand at 4.8% CAGR during 2025 to 2035. Japanese consumers look for products offering a balance of sweetness and regional fruit flavor, which results in demands for quality, reduced sugar, and fruit-dense spread. Exotic fruits like yuzu and ume (Japanese plum) are still popular.
Packaged portion sizes and single-packaging remain extremely popular in Japan, catering to the convenience and freshness-obsessed consumer culture. The use of fruit preserves in conventional confectionery and bakery items is growing, and manufacturers are employing these trends to launch new products.
The Chinese industry is projected to grow at the highest CAGR of 6.1% during 2025 to 2035. More Westernization of breakfast eating, together with increasing disposable incomes, is driving demand. Premium export brands are becoming popular, especially in urban centers, as consumers more and more demand high-quality, fruit-flavored products.
The Internet is instrumental in making distribution easier, and online food shops are driving volume growth. Food trends are informing product innovation, with function-driven ingredient spread and less sugar increasing in popularity. Local producers are launching new and innovative flavors inspired by Chinese food culture, including goji berry and hawthorn-flavored spreads.
The Australian industry will grow at 5.2% CAGR between 2025 to 2035. The consumer is choosing natural and organic products with increasing demand, choosing clean-label and local ingredients. The nation's breakfast lifestyle, involving the popularity of toast and spread, allows for industry growth to a steady extent.
Brands are shifting towards the use of indigenous fruits such as Davidson's plum and finger lime to distinguish the product. Concerns about environmental sustainability are also pushing producers towards sustainable packaging and responsibly sourced raw materials.
The New Zealand industry will grow at a CAGR of 5.4% during the forecast period. Focus on domestic and high-quality fruit spreads is the hallmark driver for industry expansion. Indigenous fruits like feijoa and boysenberry are becoming increasingly popular. Customers prefer small-batch, artisan-style jams with low additive additions.
Customers are also seeking quality New Zealand-produced fruit preserves, especially in the European and Asian markets. Stores are increasing organic and specialty lines to respond to changing consumer trends.
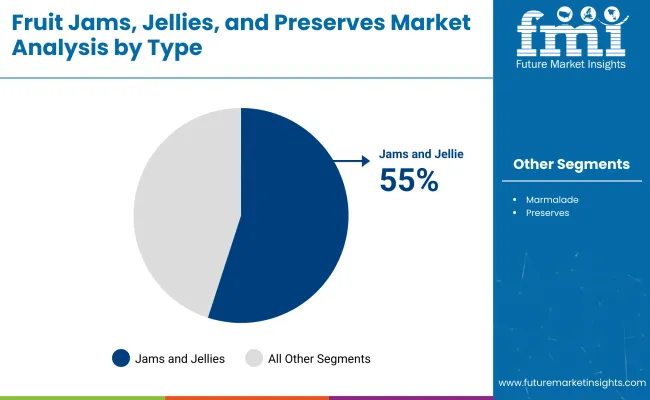
Jams and Jellies Leading the Market with Premiumization Trends
| Segment | Value Share (2025) |
|---|---|
| Jams and Jellies | 55% |
The industry continues to grow, driven by increasing consumer preference for fruit-based spreads and rising demand for natural and organic products. By 2025, the industry will be segmented into Jams and Jellies, which are projected to dominate with a 55% industry share, and Marmalade, which is expected to hold 25%.
Jams and jellies continue to be the leading segment owing to their wide range of applications to breakfast spreads, bakery, and dessert preparation. Low-sugar and sugar-free varieties are gaining popularity, with the Smucker's and Bonne Maman brands also adding organic and reduced-sugar offerings to their product portfolios. Some premium jams with exotic fruit mixes, including fig and passion fruit, are soaring in popularity, especially in Europe and North America.
Marmalade (a name for a fruit-based product) accounts for 25 percent of this industry and is often favored in European markets and the UK. There's a trickle-down demand for artisanal and handcrafted marmalades that gourmet brands such as Tiptree and Fortnum & Mason have done more and more to satisfy. As consumers chase intense flavors and more healthful fare, marmalades, with the antioxidant benefits of citrus peels, are coming up.
The industry update also notes that natural sugar substitutes, sustainable packaging, and functional ingredients will open doors for innovations while maintaining the driving demand for health-conscious consumers looking for spread options that are both nutrient-rich and sustainable.
Hypermarkets and Supermarkets Retain Dominance in Distribution.
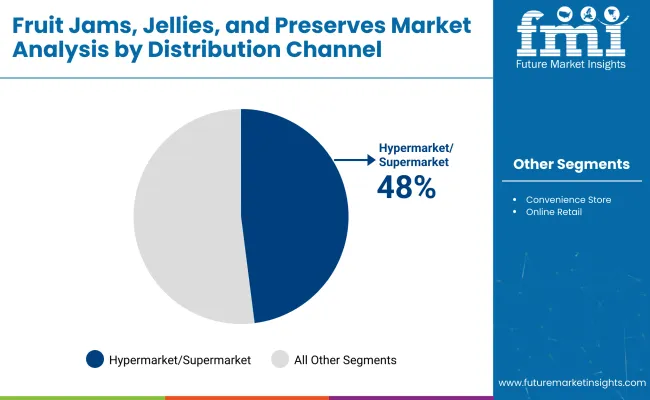
| Segment | Value Share (2025) |
|---|---|
| Hypermarkets/Supermarkets | 48% |
As the clean label trend continues to gain traction with consumers who prefer natural, organic, and sugar-free fruit spreads, the industry is on the rise. In 2025, the industry will be divided into hypermarkets and supermarkets (48% share) and convenience stores 30%.
Hypermarkets and supermarkets continue to have the largest industry share by retail channel, owing to their wide range of products, competitive pricing and established branding. Supermarket chains such as Walmart, Tesco and Carrefour carry lots of regular and upscale jams that speak to a broad range of esoteric consumers.
As health-savvy consumers become more prevalent in China, the demand for organic and reduced-sugar spreads has skyrocketed, driving brands like Bonne Maman and St.Dalfour to place their focus in these retail arenas consistently. The unbounded expansion of private-label brands has likewise spurred growth in this area, with supermarket chains peddling branded organic and gourmet preserves.
Multinational brands hold about 30% of the industry share in convenience stores catering to on-the-go consumers and impulse purchasers. Growth in this segment has been driven by increased demand for single-serve and on-the-go packaging. Brands as diverse as Smucker’s and Hero are introducing portion-controlled packs of ready-to-use jams to cater to consumers looking for fast, grab-and-go solutions.
Although total e-commerce growth keeps on proliferating, real-life retail with store promotions, physical item tests, and bundling offers are still fierce competitors to e-commerce and D2C channels. As consumers increasingly seek healthier and more premium fruit spreads, retailers must look past the traditional forms of jams and preserves and expand their assortments to include organic, artisanal, and functional varieties.
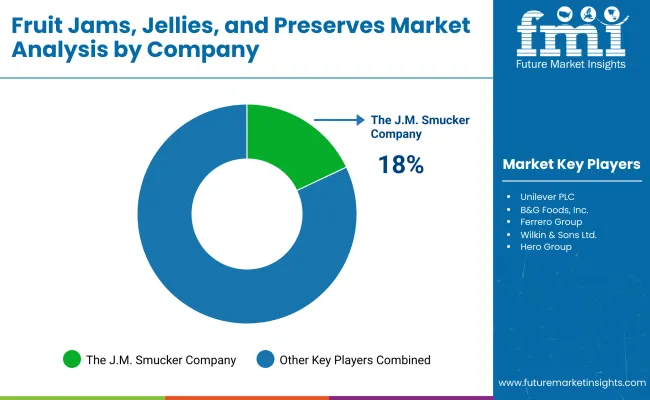
The industry bears a combination of legacy brands and emerging artisanal players alongside changing consumer preferences. Industry giants, such as The J.M. Smucker Company, Conagra Brands, Unilever, B&G Foods, and Ferrero Group, exercise their industry powers through extensive distribution channels, solid brand equity, and large-scale production capabilities. Conversely, niche brands and specialty brands have gained traction in the industry due to rising demand for organic marketing, reduced sugar offerings, and other exotic fruit-based alternatives.
Product innovation is one of the core competitive strategies, with premiumization being the other. Listing health-conscious formulations such as sugar-free and high-fiber products is expected to lure consumers who are either diabetic or otherwise wellness-focused. In terms of industry access, competition on an even playing field has begun that permits small brands to industry to overseas customers, and that too without big-time dependence on brick-and-mortar retailers, thanks to online retail and direct-to-consumer sales channels.
Sustainability and ethical sourcing will become pivotal in enhancing brand differentiation as consumers value transparency, fair trade practices, and eco-friendly packaging. More leading brands are cooperating with local fruit producers under sustainable supply chain initiatives to industry their products as farm-to-table sourced.
As the competition begins to expand, success in the industry will hinge on balancing tradition with innovation, growing digital presence, and adhering to the ever-changing trends of health and sustainability.
Market Share Analysis by Company
| Company Name | Estimated Market Share (%) |
|---|---|
| The J.M. Smucker Company | 18-22% |
| Conagra Brands, Inc. | 14-18% |
| Unilever PLC | 12-16% |
| B&G Foods, Inc. | 10-14% |
| Ferrero Group | 8-12% |
| Other Companies (Combined) | 30-40% |
| Company Name | Key Offerings/Activities |
|---|---|
| The J.M. Smucker Company | Leads with Smucker’s and Dickinson’s jams, offering classic, sugar-free, and premium fruit preserves. |
| Conagra Brands, Inc. | Integrates fruit preserves into breakfast and bakery brands, capitalizing on bundled product strategies. |
| Unilever PLC | Expands culinary applications for fruit spreads, incorporating global flavor influences. |
| B&G Foods, Inc. | It focuses on premium and organic fruit spreads that cater to health-conscious consumers. |
| Ferrero Group | Develops premium fruit-based spreads, leveraging brand strength in confectionery and breakfast markets. |
Key Company Insights
The J.M. Smucker Company (18-22%)
Smucker’s maintains industry dominance in North America, supported by well-established brand equity, diverse product lines, and continuous innovation in low-sugar and premium fruit spreads.
Conagra Brands, Inc. (14-18%)
Conagra integrates fruit preserves into its breakfast and bakery segments, ensuring cross-category consumer engagement while expanding into healthier product formulations.
Unilever PLC (12-16%)
Unilever's strategy includes expanding jam-based spreads into diverse culinary uses, leveraging its global supply chain and extensive retail penetration.
B&G Foods, Inc. (10-14%)
B&G Foods is focusing on organic and premium fruit spreads, strengthening its position with high-quality ingredient sourcing and clean-label transparency.
Ferrero Group (8-12%)
Ferrero capitalizes on consumer trust in premium spreads, positioning fruit-based offerings within its well-established confectionery and breakfast product lines.
Other Key Players (30-40% Combined)
By type, the industry is segmented into jams and jellies, marmalade, and preserves.
By end user, the segmentation includes Household and HoReCa.
By distribution channel, the industry is categorized into hypermarkets/supermarkets, convenience stores, and online retail.
By region, the industry analysis covers North America, Latin America, Europe, Asia Pacific, and the Middle East & Africa.
The industry is expected to reach USD 2.08 billion in 2025.
The industry is projected to grow to USD 3.59 billion by 2035.
The industry is expected to grow at a CAGR of 5.6% from 2025 to 2035.
China is expected to grow at the fastest rate, with a CAGR of 6.1% during the forecast period.
The jams and jellies segment is among the most widely used in the industry.
Leading companies include The J.M. Smucker Company, Conagra Brands, Inc., Unilever PLC, B&G Foods, Inc., Ferrero Group, Andros Group, Wilkin & Sons Ltd., Hero Group, Orkla ASA, and Baxter & Sons.


Our Research Products

The "Full Research Suite" delivers actionable market intel, deep dives on markets or technologies, so clients act faster, cut risk, and unlock growth.

The Leaderboard benchmarks and ranks top vendors, classifying them as Established Leaders, Leading Challengers, or Disruptors & Challengers.

Locates where complements amplify value and substitutes erode it, forecasting net impact by horizon

We deliver granular, decision-grade intel: market sizing, 5-year forecasts, pricing, adoption, usage, revenue, and operational KPIs—plus competitor tracking, regulation, and value chains—across 60 countries broadly.

Spot the shifts before they hit your P&L. We track inflection points, adoption curves, pricing moves, and ecosystem plays to show where demand is heading, why it is changing, and what to do next across high-growth markets and disruptive tech

Real-time reads of user behavior. We track shifting priorities, perceptions of today’s and next-gen services, and provider experience, then pace how fast tech moves from trial to adoption, blending buyer, consumer, and channel inputs with social signals (#WhySwitch, #UX).

Partner with our analyst team to build a custom report designed around your business priorities. From analysing market trends to assessing competitors or crafting bespoke datasets, we tailor insights to your needs.
Supplier Intelligence
Discovery & Profiling
Capacity & Footprint
Performance & Risk
Compliance & Governance
Commercial Readiness
Who Supplies Whom
Scorecards & Shortlists
Playbooks & Docs
Category Intelligence
Definition & Scope
Demand & Use Cases
Cost Drivers
Market Structure
Supply Chain Map
Trade & Policy
Operating Norms
Deliverables
Buyer Intelligence
Account Basics
Spend & Scope
Procurement Model
Vendor Requirements
Terms & Policies
Entry Strategy
Pain Points & Triggers
Outputs
Pricing Analysis
Benchmarks
Trends
Should-Cost
Indexation
Landed Cost
Commercial Terms
Deliverables
Brand Analysis
Positioning & Value Prop
Share & Presence
Customer Evidence
Go-to-Market
Digital & Reputation
Compliance & Trust
KPIs & Gaps
Outputs
Full Research Suite comprises of:
Market outlook & trends analysis
Interviews & case studies
Strategic recommendations
Vendor profiles & capabilities analysis
5-year forecasts
8 regions and 60+ country-level data splits
Market segment data splits
12 months of continuous data updates
DELIVERED AS:
PDF EXCEL ONLINE
Fruit Punnet Market Forecast and Outlook 2025 to 2035
Fruit Pomace Market Size and Share Forecast Outlook 2025 to 2035
Fruit Processing Equipment Market Size and Share Forecast Outlook 2025 to 2035
Fruit Tea Market Analysis - Size, Share, & Forecast Outlook 2025 to 2035
Fruit Beverages Market Size, Share, and Forecast 2025 to 2035
Fruit Powders Market Trends - Growth, Demand & Forecast 2025 to 2035
Fruit Wine Market Analysis by Platform, By Application, By Type, and By Region – Forecast from 2025 to 2035
Fruit Beer Market Analysis by Flavor Type, Alcohol Content, Packaging Type, and Sales Channel Through 2035
Competitive Breakdown of Fruit Snacks Suppliers
Fruit Concentrate Puree Market Growth - Trends & Forecast 2025 to 2035
Fruit Snacks Market Analysis by Product Type, Nature, Flavour Type, Distribution Channel Type, and Processing Type Through 2035
Analysis and Growth Projections for Fruit Pectin Business
Market Share Insights of Fruit Juice Packaging Providers
Fruit Juice Packaging Market Growth – Trends & Forecast through 2035
Fruit Kernel Products Market
Fruit Seed Waste Market
Fruit And Vegetable Juice Market Size and Share Forecast Outlook 2025 to 2035
Fruit and Vegetable Ingredient Market Size and Share Forecast Outlook 2025 to 2035
Global Fruits and Vegetable Bag Market Growth – Trends & Forecast 2024-2034
IQF Fruits & Vegetables Market Size, Growth, and Forecast for 2025 to 2035

Thank you!
You will receive an email from our Business Development Manager. Please be sure to check your SPAM/JUNK folder too.
Chat With
MaRIA