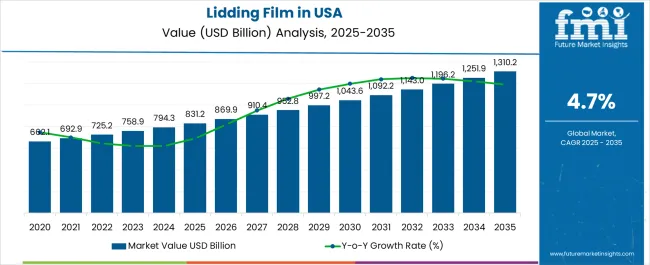
The Industry Analysis of Lidding Film in the United States is estimated to be valued at USD 831.2 billion in 2025 and is projected to reach USD 1310.2 billion by 2035, registering a compound annual growth rate (CAGR) of 4.7% over the forecast period.
| Metric | Value |
|---|---|
| Industry Analysis of Lidding Film in the United States Estimated Value in (2025 E) | USD 831.2 billion |
| Industry Analysis of Lidding Film in the United States Forecast Value in (2035 F) | USD 1310.2 billion |
| Forecast CAGR (2025 to 2035) | 4.7% |
The lidding film market in the United States is experiencing robust growth. Increasing demand for convenience foods, rising adoption of ready-to-eat meals, and evolving packaging requirements are driving market expansion. Current market dynamics are influenced by consumer preference for high-quality, durable, and safe packaging materials that extend shelf life and maintain product integrity.
Technological advancements in multi-layer film production and heat-resistant formulations have enhanced functionality across various food applications. Sustainability considerations and regulatory compliance are shaping material selection and processing standards.
The future outlook is characterized by continued investment in innovative film structures, growth in frozen and prepared food segments, and expansion of automated packaging lines, which collectively are expected to increase adoption of specialty lidding films Growth rationale is founded on the integration of functional and aesthetic benefits, operational efficiencies for food manufacturers, and increasing consumer demand for convenience, safety, and freshness, all of which are positioning the market for sustained revenue growth and broader penetration across the packaged food industry.
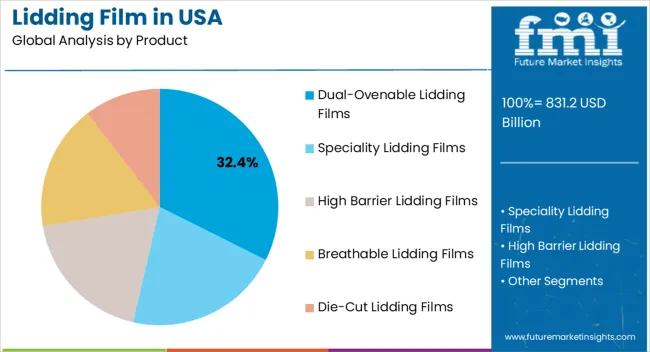
The dual-ovenable lidding films segment, representing 32.40% of the product category, has emerged as the leading product due to its versatility in withstanding both cooking and reheating processes. Its adoption has been supported by demand from frozen and ready-to-eat meal manufacturers. Heat resistance, sealing performance, and clarity have reinforced preference among packaging engineers and food processors.
Production consistency, regulatory compliance, and compatibility with automated packaging systems have contributed to market confidence. Continuous improvements in film layering, barrier properties, and manufacturing efficiency have enhanced usability and shelf-life extension.
The segment’s growth is further supported by innovation in sustainable and recyclable variants These factors are expected to maintain its competitive positioning and ensure continued contribution to overall market share.
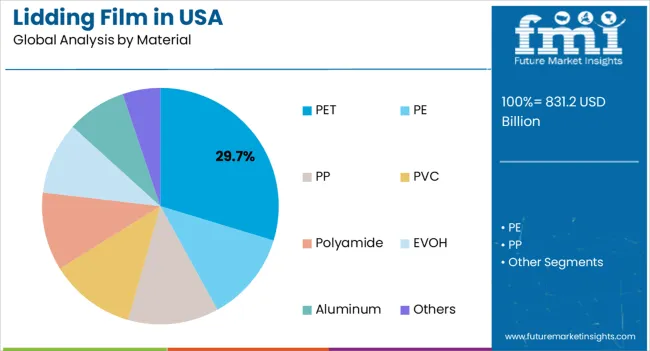
The PET material segment, accounting for 29.70% of the material category, has maintained prominence due to its superior mechanical strength, thermal stability, and clarity. Its adoption has been facilitated by widespread compatibility with dual-ovenable and standard lidding films.
Resistance to deformation and chemical inertness have reinforced preference among food manufacturers. Sustainability initiatives and recyclability considerations have further enhanced market appeal.
Advancements in PET formulations and multilayer structures have improved barrier performance, durability, and operational efficiency Continued investment in PET processing technologies and alignment with regulatory standards are expected to sustain segment share and support adoption across multiple packaging applications.
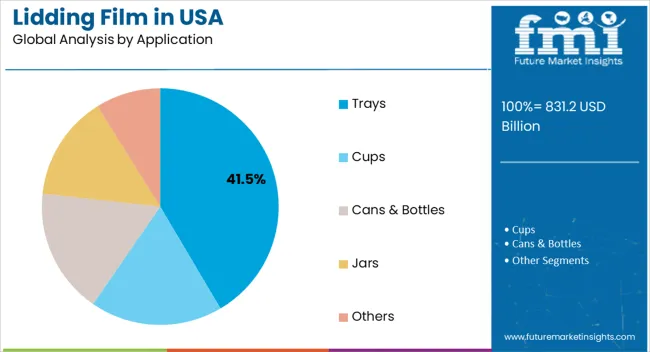
The trays application segment, holding 41.50% of the application category, has been leading due to its widespread use in ready-to-eat and frozen meal packaging. Adoption has been driven by the need for secure sealing, heat resistance, and product visibility.
Integration into automated packaging lines and compatibility with dual-ovenable films have reinforced market acceptance. Durability, regulatory compliance, and shelf-life extension have strengthened preference among food manufacturers.
Continuous innovation in tray design, film adhesion, and functional performance is expected to sustain segment share Expansion of convenience food consumption and growth of prepared meal segments are anticipated to drive incremental adoption, ensuring trays remain a critical application within the lidding film market.
United States Revenue to Expand 1.6X through 2035
Revenue in the United States is expected to expand over 1.6X through 2035, amid a 2.1% increase in estimated CAGR compared to the historical one. This is due to rising demand for packaged food products, growing popularity of flexible packaging, and the escalating need to extend the shelf life of food and pharmaceutical items.
Food Industry to Remain Leading Consumer of Lidding Films
As per the latest report, the United States food sector is projected to remain the leading end user of lidding films during the forecast period. This is attributable to growing demand for ready-to-eat meals, snacks, and other food items and rising emphasis on protecting and extending the life of food items.
The spending on packaged food products and pharmaceuticals is rising significantly across the United States. This is due to changing lifestyles and eating habits, increasing disposable income, and growing incidence of lifestyle diseases. Driven by this, demand for packaging like lidding films is set to rise steadily.
High Barrier Lidding Films to Sweep United States
The high barrier lidding films are expected to remain dominant category despite the rising popularity of dual-ovenable and specialty lidding films. This is attributable to widening usage of these films across diverse industries due to their ability to provide excellent protection to packed content.
High barrier lidding films are versatile and offer optimal protection against moisture and other environmental factors that can degrade pharmaceutical products. This makes them ideal for ensuring the safety and efficacy of food items and pharmaceuticals.
Manufacturers Using Sustainable Materials to Stay Ahead
Leading manufacturers are focusing on using sustainable materials for producing lidding films. For instance, they use renewable resources like plant-based polymers (such as PLA - polylactic acid) and bio-based raw materials derived from agricultural waste to develop biodegradable and compostable films.
Growing popularity of sustainable lidding films is expected to boost revenue in the United States. Adoption of sustainable materials will also help companies to comply with environmental regulations.
Overview of the Lidding Films in the United States
Lidding films are made by extruding a thin layer of plastic material onto a substrate, such as paper or foil. The plastic material can be a variety of different types, such as polyethylene (PE), polypropylene (PP), or polyester (PET).
The substrate provides support and structure to the lidding film and additional properties, such as barrier protection or printability. Lidding films are utilized to package a wide variety of products, including food, pharmaceuticals, and medical devices.
Lidding films can provide packaged items protection, preservation, and tamper-evident features. As a result, they are used in packaging products like dairy items, ready-to-eat meals, and other perishable products.
Rising demand for lidding films from food & beverage, personal care, and pharmaceutical industries is expected to boost sales in the United States. Subsequently, growing focus on extending the shelf life of sensitive food & pharmaceutical items will likely fuel lidding film demand.
Sales of lidding films in the United States increased at a CAGR of around 2.8% during the historic period. Total value at the end of 2025 reached USD 721.7 million. This was due to several factors, including:
COVID-19 Impact
The COVID-19 pandemic’s impact led to an increased demand for convenience and packaged foods, simultaneously emphasizing food safety. This prompted manufacturers and suppliers, especially the food industry, to use packaging solutions like lidding films.
Manufacturers emphasized providing protective and environmentally friendly packaging options, enabling hassle-free purchasing and consuming food products. Driven by this, sales of lidding films rose at a steady pace between 2020 and 2025.
Rise of E-commerce Platforms
The growing use of e-commerce platforms in the United States also translated into increasing requirements for lidding films. These films witnessed high demand from the food, personal care, and cosmetics industries, and the trend is expected to continue through 2035.
| Particular | Value CAGR |
|---|---|
| H1 | 5.1% (2025 to 2035) |
| H2 | 5.4% (2025 to 2035) |
| H1 | 4.5% (2025 to 2035) |
| H2 | 4.6% (2025 to 2035) |
Lidding Film Sales Forecast in the United States
Lidding film demand in the United States is forecast to thrive at a steady CAGR of 4.9% during the assessment period. According to the latest United States lidding film industry analysis, total revenue in the country is predicted to reach USD 1,222.3 million by 2035.
Several factors are expected to drive lidding film demand in the United States during the assessment period. These include:
Convenience
Consumer preferences for convenience have prompted a shift towards ready-to-eat and packaged food products. This is necessitating efficient and eco-friendly packaging solutions like sustainable lidding films.
Americans are more concerned when it comes to convenience. Their fast lifestyle creates room for products like ready-to-eat and frozen ones, which require packaging solutions like lidding films.
Convenience will continue to play a critical role in boosting lidding film sales in the United States. The stringent regulations and quality standards in the food sector have also made secure, tamper-evident packaging a necessity, with lidding films providing a reliable solution.
The increasing trend of online food delivery services heightens the need for packaging that preserves freshness and ensures hygienic delivery. This is expected to drive demand for lidding films in the United States food.
Lidding film demand is also increasing due to the popularity of grocery shopping across the country and the growing emphasis on consumer convenience. Americans are showing a keen inclination towards purchasing products for online groceries.
Online grocery shopping is experiencing sustained growth and significant investments from several stakeholders. For instance, in December 2024, the USA Department of Agriculture (USDA) announced a USD 5 million grant to expand the SNAP online grocery shopping platform. This will create growth opportunities for manufacturers of lidding films.
Growing Usage in Non-food Industries:
Industries like pharmaceutical and personal care are also witnessing growing demand for packaging films owing to stringent compliance and hygiene requirements. The versatility and cost-effectiveness of such films also encourage their adoption in a wide range of non-food industries.
Challenges Faced by Lidding Film Manufacturers in the United States
The below section highlights the prediction for the high barrier lidding films segment, which is expected to hold a prominent share based on product type. It is poised to exhibit a CAGR of 4.1% through 2035.
Based on material type, PE segment is expected to lead the United States. It will likely progress at 4.8% CAGR during the assessment period.
| Top Segments (Product) | Projected Value (2035) |
|---|---|
| High Barrier Lidding Films | USD 1310.2 million |
| Dual-ovenable Lidding Films | USD 317.80 million |
Based on the product, the high barrier lidding films segment is anticipated to hold around 36.7% share by the end of 2035. This is owing to rising usage of high barriers lidding films in the thriving pharmaceutical industry in the United States.
High barrier lidding films provide appropriate protection against moisture, oxygen, and other environmental factors that can degrade pharmaceutical products. This makes them essential for ensuring the safety and efficacy of these products.
High-barrier lidding films also meet the stringent regulations imposed by the USA Food and Drug Administration (US FDA), further pushing their demand upwards. Hence, growing adoption of high barrier lidding films to package pharmaceutical products like tablets, capsules, and liquids will drive their sales through 2035.
Rising demand for high barrier packaging films from the food industry will further boost the target segment. As per the latest American lidding film industry analysis, high barrier lidding films segment is set to thrive at 4.1% CAGR, totaling a valuation of USD 1310.2 million by 2035.
Dual-ovenable lidding films are also expected to witness high demand due to increasing usage in the food & beverage industry. These films are widely used to package prepared meals, frozen foods, and other products that require to be heated in a microwave or oven.
Dual-ovenable lidding film demand will likely rise at 5.9% CAGR during the forecast period. The target segment is predicted to total a valuation of USD 317.80 million by 2035.
| Material Type | PE |
|---|---|
| Predicted Value (2035) | USD 321.5 million |
Lidding films are generally made from materials liek PE, PET, PP, PVC, polyamide, EVOH, aluminum, and others. Among these, polyethylene (PE) remains the most preferred material used by manufacturers for producing lidding films.
The PE segment is poised to exhibit a CAGR of 4.8% during the forecast period, totaling a valuation of USD 321.5 million by 2035. This is due to excellent barrier properties, flexibility, cost-effectiveness, transparency, and good heat sealability of PE.
PE lidding films offer several advantages, including excellent barrier protection and versatility. Polyethylene prices in the United States have remained low since last year, making them one of the most cost-effective raw materials for manufacturing lidding films.
PE lidding films are used for packaging a wide range of food products, including fresh produce, frozen foods, dairy products, meat & poultry, etc. They also find applications across industries like pharmaceuticals.
The EVOH segment, however, is poised to witness a higher CAGR of 6.8% over the forecast period. The demand for EVOH or Ethylene Vinyl Alcohol is rising owing to its transparency and chemical resistance properties.
EVOH-based lidding films have grown popular in the food industry for packaging oxygen-sensitive products such as meat and cheese. This high usage of EVOH lidding films in the food industry will improve share of the target segment.
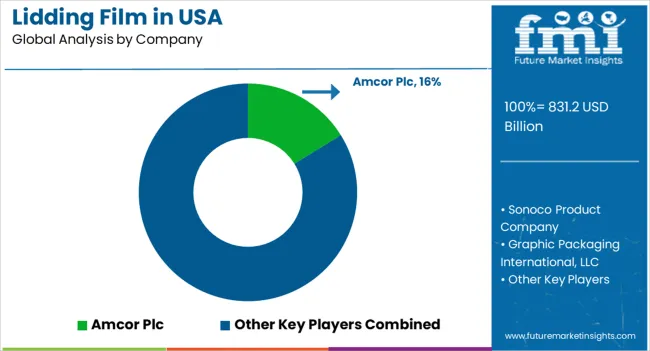
The United States landscape is highly competitive, with several key players holding a dominant share. Prominent lidding film companies in the United States include Amcor Plc, Sonoco Product Company, Berry Global, Inc., and Mondi PLC.
Key manufacturers of lidding films in the United States are concentrating on increasing their production capacity to meet the increasing end user demand. They are exploring alternative packaging materials and designs to reduce environmental impact. Besides this, companies are adopting strategies like acquisitions, mergers, partnerships, and facility expansions to strengthen their presence.
Recent Developments:
| Attribute | Details |
|---|---|
| Estimated Value (2025) | USD 831.2 billion |
| Projected Size (2035) | USD 1310.2 billion |
| Anticipated Growth Rate (2025 to 2035) | 4.7% CAGR |
| Historical Data | 2020 to 2025 |
| Forecast Period | 2025 to 2035 |
| Quantitative Metric Tonnes | Revenue in USD Million, Volume in Metric Tonnes and CAGR from 2025 to 2035 |
| Segments Covered | Product Type, Material Type, Application, End Use |
| Key Companies Profiled | Amcor Plc; Sonoco Product Company; Graphic Packaging International, LLC; Sealed Air Corporation; Berry Global Inc; Novolex Holdings, LLC; Klöckner Pentaplast Group; Profol GmbH; Dunmore; ProAmpac Holdings Inc.; Toray Plastics; Plastopil BV.; Mondi Plc; Momar Industries; Dupont Teijin Films USA; Dow Inc. |
The global industry analysis of lidding film in the United States is estimated to be valued at USD 831.2 billion in 2025.
The market size for the industry analysis of lidding film in the United States is projected to reach USD 1,310.2 billion by 2035.
The industry analysis of lidding film in the United States is expected to grow at a 4.7% CAGR between 2025 and 2035.
The key product types in industry analysis of lidding film in the United States are dual-ovenable lidding films, speciality lidding films, high barrier lidding films, breathable lidding films and die-cut lidding films.
In terms of material, pet segment to command 29.7% share in the industry analysis of lidding film in the United States in 2025.


Full Research Suite comprises of:
Market outlook & trends analysis
Interviews & case studies
Strategic recommendations
Vendor profiles & capabilities analysis
5-year forecasts
8 regions and 60+ country-level data splits
Market segment data splits
12 months of continuous data updates
DELIVERED AS:
PDF EXCEL ONLINE
Industry 4.0 Market
Industry Analysis Non-commercial Acrylic Paint in the United States Size and Share Forecast Outlook 2025 to 2035
Industry Analysis of Syringe and Needle in GCC Size and Share Forecast Outlook 2025 to 2035
Industry Analysis of Paper Bag in North America Size and Share Forecast Outlook 2025 to 2035
Industry Analysis of Last-mile Delivery Software in Japan Size and Share Forecast Outlook 2025 to 2035
Industry Analysis of Electronic Skin in Japan Size and Share Forecast Outlook 2025 to 2035
Industry Analysis of Electronic Skin in Korea Size and Share Forecast Outlook 2025 to 2035
Industry Analysis of Electronic Skin in Western Europe Size and Share Forecast Outlook 2025 to 2035
Germany Outbound Tourism Market Trends – Growth & Forecast 2024-2034
Europe Second-hand Apparel Market Growth – Trends & Forecast 2024-2034
Industry Analysis of Medical Device Packaging in Southeast Asia Size and Share Forecast Outlook 2025 to 2035
Industry Analysis of Automotive Lightweight Body Panel in the United States Size and Share Forecast Outlook 2025 to 2035
FIBC Industry Analysis in Japan Size and Share Forecast Outlook 2025 to 2035
DOAS Industry Growth in the United States – Trends & Forecast 2024-2034
Pectin Industry Analysis in Japan Size and Share Forecast Outlook 2025 to 2035
Western Europe Pectin Market Analysis by Product Type, Application, and Country Through 2035
Mezcal Industry Analysis in Japan - Consumer Demand & Industry Trends in 2025
Mezcal Industry Analysis in Korea – Trends, Demand & Industry Growth
Mezcal Industry Analysis in Western Europe Report – Growth, Demand & Forecast 2025 to 2035
Asia Pacific Dental Market Analysis – Growth, Trends & Forecast 2024-2034

Thank you!
You will receive an email from our Business Development Manager. Please be sure to check your SPAM/JUNK folder too.
Chat With
MaRIA