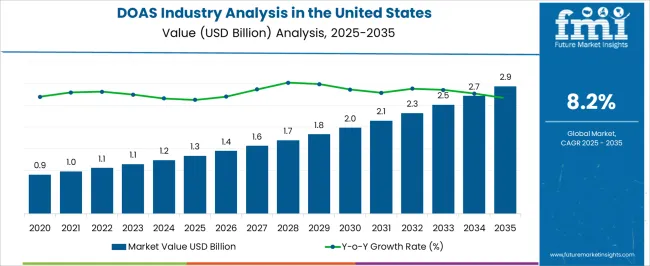
The DOAS Industry Analysis in the United States is estimated to be valued at USD 1.3 billion in 2025 and is projected to reach USD 2.9 billion by 2035, registering a compound annual growth rate (CAGR) of 8.2% over the forecast period.
The DOAS industry in the United States is witnessing steady growth, driven by increasing demand for energy-efficient HVAC systems and enhanced indoor air quality across commercial and institutional buildings. Rising awareness of the importance of ventilation in maintaining health, especially in workplaces and educational facilities, is accelerating adoption. Investments in energy-efficient infrastructure, regulatory incentives for sustainable building practices, and integration of smart building technologies are contributing to market expansion.
Advancements in system design, control strategies, and integration with variable refrigerant flow and other HVAC components are enhancing operational efficiency and reducing energy consumption. Growing focus on meeting ASHRAE standards and achieving LEED or equivalent certifications is shaping market requirements.
Additionally, the need to maintain optimal temperature, humidity, and air quality in response to increasingly stringent building codes is supporting adoption As organizations prioritize energy-efficient solutions and occupant comfort, the DOAS market in the United States is expected to maintain sustained growth, with opportunities arising from both retrofitting projects and new construction initiatives.
| Metric | Value |
|---|---|
| DOAS Industry Analysis in the United States Estimated Value in (2025 E) | USD 1.3 billion |
| DOAS Industry Analysis in the United States Forecast Value in (2035 F) | USD 2.9 billion |
| Forecast CAGR (2025 to 2035) | 8.2% |
The market is segmented by Capacity, Implementation Type, Requirement, and End-Use and region. By Capacity, the market is divided into 20 To 40 Tons, Less Than 20 Tons, 40 To 60 Tons, and Greater Than 60 Tons. In terms of Implementation Type, the market is classified into New Construction and Retrofit. Based on Requirement, the market is segmented into Cooling, Heating, Ventilation, and Dehumidification. By End-Use, the market is divided into Commercial, Residential, and Industrial. Regionally, the market is classified into North America, Latin America, Western Europe, Eastern Europe, Balkan & Baltic Countries, Russia & Belarus, Central Asia, East Asia, South Asia & Pacific, and the Middle East & Africa.
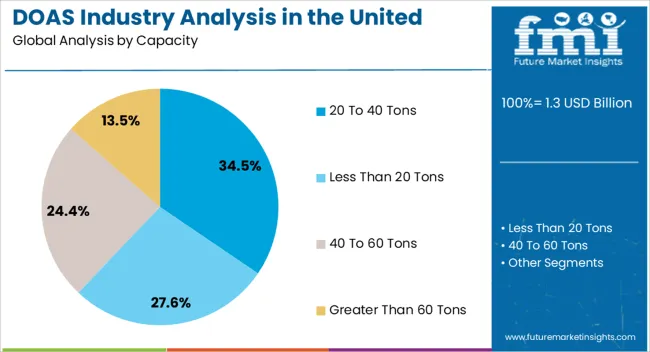
The 20 to 40 tons capacity segment is projected to hold 34.5% of the DOAS market revenue in 2025, establishing it as the leading capacity range. Growth in this segment is being driven by its suitability for mid-to-large commercial and institutional applications, where moderate-to-high airflow is required. Systems in this capacity range offer efficient handling of ventilation loads, ensuring consistent indoor air quality while optimizing energy consumption.
The flexibility to integrate with other HVAC components and advanced control systems enhances performance and operational reliability. Additionally, these units are compatible with both new construction projects and retrofitting initiatives, providing versatility for building owners and engineers.
The segment’s growth is further reinforced by increasing demand for centralized air handling solutions capable of maintaining temperature, humidity, and air quality standards efficiently As energy efficiency regulations and sustainability requirements continue to influence building design, the 20 to 40 tons capacity segment is expected to remain the market leader, supported by operational effectiveness and adaptability.
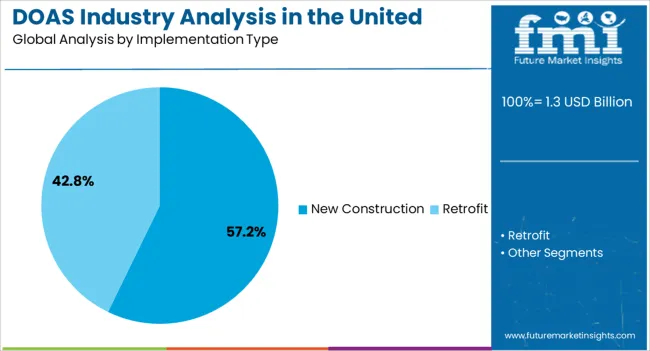
The new construction implementation type segment is expected to account for 57.2% of the market revenue in 2025, making it the leading adoption category. Its growth is driven by the ongoing expansion of commercial, educational, and institutional infrastructure across the United States, where energy efficiency and compliance with modern building standards are critical considerations. DOAS units are being integrated into new building designs to provide optimized ventilation and improved indoor air quality while supporting sustainable construction goals.
The ability to tailor system design to specific building layouts and occupancy patterns enhances performance and operational efficiency. Regulatory requirements, including ASHRAE and local building codes, further reinforce the importance of DOAS in new construction projects.
Investment in energy-efficient, high-performance HVAC systems during initial construction reduces long-term operational costs and supports environmental objectives As construction activity grows in response to urbanization and commercial development, new construction projects are expected to remain the primary driver of DOAS market expansion in the United States.
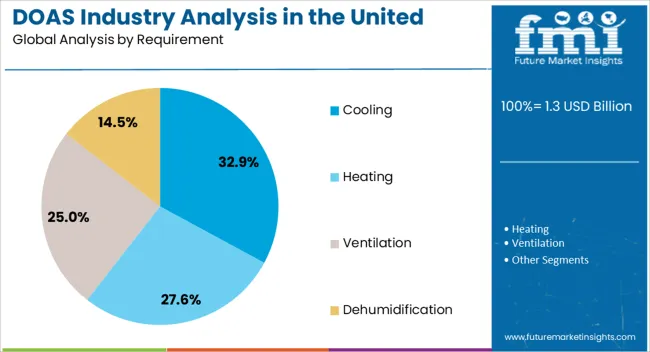
The cooling requirement segment is anticipated to hold 32.9% of the DOAS market revenue in 2025, establishing it as the leading requirement type. Growth in this segment is being driven by the need to maintain comfortable indoor temperatures and controlled humidity levels in commercial and institutional spaces, particularly in regions with warm climates or seasonal temperature variations.
DOAS systems are increasingly being deployed to meet cooling demands efficiently, as they provide precise control over airflow and temperature while reducing energy consumption. Integration with other HVAC technologies, including variable refrigerant flow systems and chilled water loops, further enhances operational efficiency.
The ability to deliver consistent cooling performance, maintain indoor air quality, and comply with energy efficiency regulations has strengthened adoption As building owners and operators prioritize occupant comfort and environmental sustainability, the cooling requirement segment is expected to remain a significant growth driver for the DOAS market, supported by innovations in system design, control strategies, and energy-efficient operation.
Industry to Expand around 2.2X through 2035
An expected increase in CAGR compared to the historical one by 2.3% is likely to lead to at least a 2.2x expansion of the United States DOAS industry through 2035. Increasing awareness of indoor air quality (IAQ) will likely propel the industry.
DOAS is likely to be added to building automation control systems (BACS) to improve HVAC performance and building efficiency. It also provides reliability while being able to communicate with the BAS platforms used, increasing their efficiency and reliability.
DOAS deployments combined with IoT devices and smart building technologies are gaining popularity. These enable remote monitoring and optimization of air quality & energy efficiency.
Customers and facility managers are looking for DOAS solutions that can easily fit a complete building management system with comprehensive performance analysis and predictive maintenance functions. Changes in construction, energy consumption, and IAQ-related regulations impact requirements.
Regulations aimed at reducing energy consumption and improving air quality are set to propel demand. DOAS programs are required to meet current regulatory conditions but can be adapted to changing future standards to maintain long-term durability and ensure compliance.
West United States to Remain the Hotbed for DOAS Manufacturers
West United States is expected to rise substantially in the United States DOAS industry during the forecast period. It is set to hold around 35.2% of the share in 2035.
The vast geographical range across Western United States plays a key role in increasing the need for advanced DOAS HVAC systems. This is because the area spans from dry deserts to temperate coastal lands. Hence, the region requires climate control structures that can adapt to a wide range of environmental situations. This has made the system an attractive option among homeowners and firms due to its versatility & efficiency.
Strict environmental regulations that exist in Western United States are set to propel the adoption of DOAS. To reduce emissions while improving energy usage, state and local governments have enacted stringent building codes and green standards. The system emerges as a solution that is compliant with all regulations.
Demand is further encouraged by exponential growth of urban centers in Western United States. In Los Angeles, San Francisco, and Seattle, there has been an influx of commercial development that calls for DOAS system HVAC to accommodate infrastructures. It becomes the keystone of contemporary buildings aimed at ensuring optimum indoor air quality and enhanced occupant comfort amid city growth.
Healthcare Sector becomes a Key Consumer of DOAS
In the healthcare industry, where patient well-being and infection prevention are significant, DOAS plays an important role in maintaining a sterile environment. It also helps in preventing the spread of airborne pollutants.
Hospitals, clinics, and pharmacies rely on DOAS to provide increased ventilation and filtration to patients, staff, and guests. To ensure a comfortable and healthy indoor environment, advanced features such as heat recovery and air purification enhance efficiency.
Sales of DOAS in the United States grew at a CAGR of 3.1% between 2020 and 2025. Total industry revenue reached about USD 1,146.6 million in 2025. In the forecast period, the United States DOAS industry is set to thrive at a CAGR of 8.2%.
| Historical CAGR (2020 to 2025) | 3.1% |
|---|---|
| Forecast CAGR (2025 to 2035) | 8.2% |
Increased awareness of air quality, strict environmental standards, and need for more flexible DOAS in HVAC are set to augment demand. Innovations in technology have led to the development of efficient and sophisticated solutions.
Innovations include heat recovery, unique filtration options, and smart controls to improve system efficiency and energy savings. The forecast period will likely see high adoption of green building practices, which will propel demand for energy-efficient solutions such as DOAS.
Regulatory Compliance and Standards
Regulatory requirements and standards mandating minimum air concentrations & IAQ standards in buildings are pushing the adoption of DOAS with ERV. Building codes, such as ASHRAE standards and local codes, often specify ventilation requirements that must be met to ensure occupant health and safety.
New solutions with the ability to provide outdoor ventilation and reduce energy consumption provide an attractive way to comply with this code. Mitsubishi Electric Trane HVAC US (METUS) provides DOAS systems that meet or exceed regulatory requirements.
By providing solutions that help building owners comply with building codes and standards, companies like METUS have established themselves as trusted partners.
High Initial Investments for DOAS
Compared to traditional HVAC systems, DOAS typically involves higher upfront costs due to the need for specialized equipment such as energy recovery ventilators, advanced filtration systems, and sophisticated controls. Additionally, retrofitting existing buildings with these systems can require significant modifications to the building's infrastructure.
These include ductwork, ventilation pathways, and control systems. High initial costs may deter certain building owners and operators, particularly those with limited budgets or stringent financial constraints, from adopting these systems.
Complexity of Design and Installation of DOAS
The United States DOAS industry consists of complex policies and procedures associated with these systems. The system often requires careful technical and design considerations to ensure efficiency, effectiveness, and compatibility with existing building systems.
The DOAS design process involves adequate air volume, airflow distribution, and large equipment. It depends on factors such as building size, occupancy, climate, and indoor air quality requirements.
Establishing a DOAS can be challenging due to the need to collaborate with other building systems, comply with regulatory requirements, and integrate with existing infrastructure. Complex design can be a barrier for a construction project, especially for those with limited technical expertise or resources.
The table below highlights key states in the United States DOAS industry. California, Texas, and Florida are expected to remain the top three consumers of DOAS air systems, with expected valuations of USD 2.9 million, USD 246.8 million, and USD 144.4 million, respectively, in 2035.
| States | United States DOAS Industry Revenue (2035) |
|---|---|
| California | USD 2.9 million |
| Texas | USD 246.8 million |
| Florida | USD 144.4 million |
| New York | USD 122.1 million |
| Georgia | USD 80.2 million |
The table below shows the estimated growth rates of several states in the United States DOAS industry. Georgia, Texas, and New York are set to record high CAGRs of 9.7%, 8.8%, and 8.2%, respectively, through 2035.
| States | Projected CAGR (2025 to 2035) |
|---|---|
| Georgia | 9.7% |
| Texas | 8.8% |
| Florida | 8.6% |
| New York | 8.2% |
| California | 7.8% |
California is a key state in terms of technology and innovations. Silicon Valley serves as a global hub for cutting-edge research & development in a variety of industries, including sensing and technology.
The state’s vibrant ecosystem of start-ups and research institutions creates a favorable environment for advancing HVAC DOAS technology. It stimulates innovation and pushes the boundaries of possibilities in optical & sensing applications.
California’s diverse geographic and environmental conditions provide several opportunities to implement DOAS programs in a variety of settings. It includes urban environments, rural landscapes, coastal areas, and mountainous areas.
Sales of DOAS in California are projected to soar at a CAGR of around 7.8% during the assessment period. Total valuation in the state is anticipated to reach USD 2.9 million by 2035.
Texas has a diverse economy characterized by a strong presence in the manufacturing, industrial, energy, wind, and aerospace industries. The state's well-established technology base provides a strong foundation for DOAS operations. It provides skilled labor, supplies, and support services needed for manufacturing.
Texas has a great deal of talent, including engineers, scientists, and technicians These skilled personnel are essential for the designing, development, and execution of DOAS systems to ensure smooth manufacturing and extraction of new manufacturing processes.
Texas offers a favorable climate, including business-friendly regulations, low taxes, and incentives for manufacturing investments. The state’s pro-business policies and commitment to economic development attract companies seeking to establish production. It is creating a favorable environment for DOAS entrepreneurs to succeed.
The section below shows the commercial segment dominating by end-use. It is likely to thrive at a 7.9% CAGR between 2025 and 2035.
Based on capacity, the 40 to 60 ton segment is anticipated to hold a dominant share through 2035. It is set to exhibit a CAGR of 8.2% during the forecast period.
| Top Segment (End-use) | Commercial |
|---|---|
| Predicted CAGR (2025 to 2035) | 7.9% |
Based on end-use, the United States DOAS industry is segmented into commercial, residential, and industrial. Among these, the commercial category stands out as the dominant force, significantly influencing the industry’s landscape.
Commercial buildings are subject to stringent regulations and standards for safety, security, and environmental performance. Compliance with these regulations often requires the use of advanced monitoring and control systems, including DOAS solutions. The programs enable owners and operators to meet regulatory requirements while ensuring the well-being of their residents and reducing operational risks.
| Top Segment (Capacity) | 40 to 60 Tons |
|---|---|
| Projected CAGR (2025 to 2035) | 8.2% |
DOAS in the 40 to 60 ton capacity range is robust to meet the air conditioning needs of medium to large commercial buildings. It is also flexible to be used in a variety of environments such as offices, schools, hospitals, and manufacturing facilities.
The capacity is ideal for large mid-rise buildings where DOAS is required to maintain indoor air quality and comfort. Systems in this capacity are typically designed to be more energy efficient, helping building owners and operators reduce operating costs and meet sustainability goals. They typically use unique features such as variable-speed compressors and air recovery to improve efficiency.
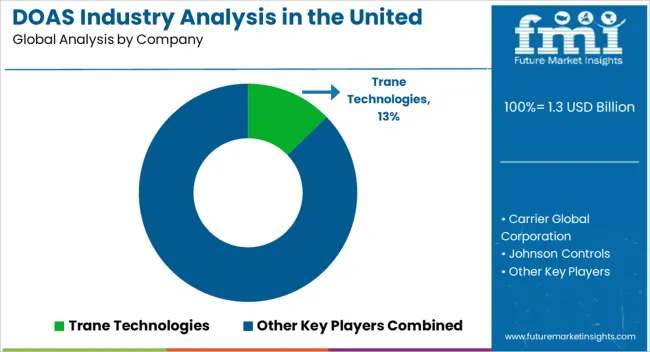
Tier 1 players account for around 40 to 44% of the share and a revenue of more than USD 200 million in the United States. These players include Johnson Controls, Modine Manufacturing, Lennox International, Carrier United States Corporation, AAON, Munters Corporation, Trane Technologies, and Daikin Industries.
Tier 2 players include Desert Aire, Greenheck Fan Corporation, RenewAire, Nortek Air Solutions, DRI Innovative Solution, and FlaktGroup SEMCO. Other regional and local players are set to hold 56 to 60% of the industry share.
Leading DOAS manufacturers are focusing on investing in research & development activities to come up with innovative products. They are also participating in several exhibitions to showcase their latest products and gain a large customer base.
Recent Developments in the United States DOAS Industry
| Attribute | Details |
|---|---|
| Estimated Industry Size (2025) | USD 1.3 billion |
| Projected Industry Size (2035) | USD 2.9 billion |
| Anticipated Growth Rate (2025 to 2035) | 8.2% |
| Historical Data | 2020 to 2025 |
| Forecast Period | 2025 to 2035 |
| Quantitative Units | Value (USD million) and Volume (Units) |
| Report Coverage | Revenue Forecast, Volume Forecast, Company Ranking, Competitive Landscape, Growth Factors, Trends, and Pricing Analysis |
| Industry Segments Covered | Capacity, Implementation Type, Requirement, End-use, Region |
| Regions Covered | Northeast United States; Southeast United States; Southwest United States; Midwest United States; West United States |
| Key Countries Covered | Pennsylvania, New York, Massachusetts, Florida, Georgia, North Carolina, Virginia, Arizona, New Mexico, Nevada, Utah, Illinois, Ohio, Michigan, Indiana, California, Texas, Colorado, Washington |
| Key Companies Profiled | Trane Technologies; Carrier Global Corporation; Johnson Controls; Daikin Industries; DRI Innovative Solution; Nortek Air Solutions; Lennox International; AAON; Desert Aire; Greenheck Fan Corporation; Munters Corporation; Ruskin Company; Modine Manufacturing; SEMCO; RenewAire. |
The global DOAS industry analysis in the united states is estimated to be valued at USD 1.3 billion in 2025.
The market size for the DOAS industry analysis in the united states is projected to reach USD 2.9 billion by 2035.
The DOAS industry analysis in the united states is expected to grow at a 8.2% CAGR between 2025 and 2035.
The key product types in DOAS industry analysis in the united states are 20 to 40 tons, less than 20 tons, 40 to 60 tons and greater than 60 tons.
In terms of implementation type, new construction segment to command 57.2% share in the DOAS industry analysis in the united states in 2025.


Full Research Suite comprises of:
Market outlook & trends analysis
Interviews & case studies
Strategic recommendations
Vendor profiles & capabilities analysis
5-year forecasts
8 regions and 60+ country-level data splits
Market segment data splits
12 months of continuous data updates
DELIVERED AS:
PDF EXCEL ONLINE
Dedicated Outdoor Air System (DOAS) Market Size and Share Forecast Outlook 2025 to 2035
Industry 4.0 Market
Industry Analysis of Syringe and Needle in GCC Size and Share Forecast Outlook 2025 to 2035
Industry Analysis of Paper Bag in North America Size and Share Forecast Outlook 2025 to 2035
Industry Analysis of Last-mile Delivery Software in Japan Size and Share Forecast Outlook 2025 to 2035
Industry Analysis of Electronic Skin in Japan Size and Share Forecast Outlook 2025 to 2035
Industry Analysis of Electronic Skin in Korea Size and Share Forecast Outlook 2025 to 2035
Industry Analysis of Electronic Skin in Western Europe Size and Share Forecast Outlook 2025 to 2035
Germany Outbound Tourism Market Trends – Growth & Forecast 2024-2034
Europe Second-hand Apparel Market Growth – Trends & Forecast 2024-2034
Industry Analysis of Lidding Film in the United States Size and Share Forecast Outlook 2025 to 2035
Industry Analysis Non-commercial Acrylic Paint in the United States Size and Share Forecast Outlook 2025 to 2035
Industry Analysis of Medical Device Packaging in Southeast Asia Size and Share Forecast Outlook 2025 to 2035
Industry Analysis of Automotive Lightweight Body Panel in the United States Size and Share Forecast Outlook 2025 to 2035
FIBC Industry Analysis in Japan Size and Share Forecast Outlook 2025 to 2035
Pectin Industry Analysis in Japan Size and Share Forecast Outlook 2025 to 2035
Western Europe Pectin Market Analysis by Product Type, Application, and Country Through 2035
Mezcal Industry Analysis in Japan - Consumer Demand & Industry Trends in 2025
Mezcal Industry Analysis in Korea – Trends, Demand & Industry Growth
Mezcal Industry Analysis in Western Europe Report – Growth, Demand & Forecast 2025 to 2035

Thank you!
You will receive an email from our Business Development Manager. Please be sure to check your SPAM/JUNK folder too.
Chat With
MaRIA