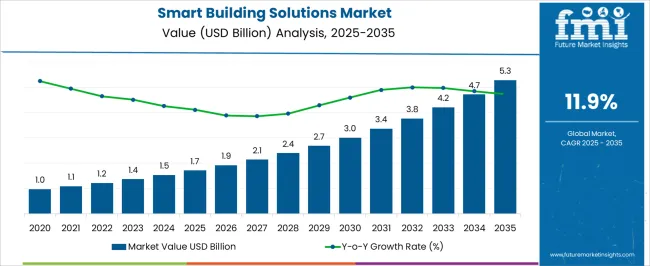
The Smart Building Solutions Market is estimated to be valued at USD 1.7 billion in 2025 and is projected to reach USD 5.3 billion by 2035, registering a compound annual growth rate (CAGR) of 11.9% over the forecast period.

| Metric | Value |
|---|---|
| Smart Building Solutions Market Estimated Value in (2025 E) | USD 1.7 billion |
| Smart Building Solutions Market Forecast Value in (2035 F) | USD 5.3 billion |
| Forecast CAGR (2025 to 2035) | 11.9% |
The smart building solutions market is expanding steadily due to the increasing integration of digital infrastructure, energy efficiency mandates, and heightened focus on occupant safety and comfort. Manufacturing facilities are adopting advanced automation and monitoring systems to enhance operational performance, reduce energy consumption, and comply with sustainability goals.
Advances in IoT, AI driven analytics, and cloud based platforms are accelerating the deployment of smart solutions across industrial environments. Furthermore, physical security systems are witnessing robust demand as enterprises prioritize asset protection, cyber physical integration, and compliance with stringent security regulations.
Investments in connected systems that deliver real time monitoring, predictive maintenance, and data driven decision making are reshaping the building ecosystem. The outlook remains strong as stakeholders leverage technology to optimize costs, improve resilience, and achieve long term sustainability benchmarks.

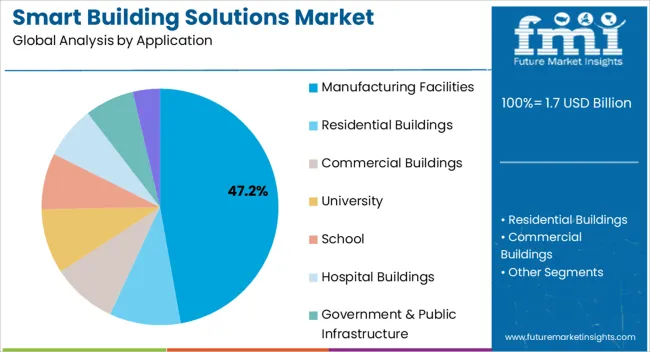
The manufacturing facilities application segment is expected to account for 47.20% of total revenue by 2025, establishing it as the leading application area. Growth is supported by rising adoption of automation technologies and the need to optimize energy usage across industrial operations.
Manufacturing environments require efficient monitoring systems to enhance productivity, reduce downtime, and ensure compliance with evolving environmental standards. The adoption of smart solutions in these facilities has been driven by the demand for predictive maintenance, centralized control, and improved workforce safety.
As industries modernize production plants and integrate connected infrastructure, manufacturing facilities continue to emerge as a primary driver of the smart building solutions market.

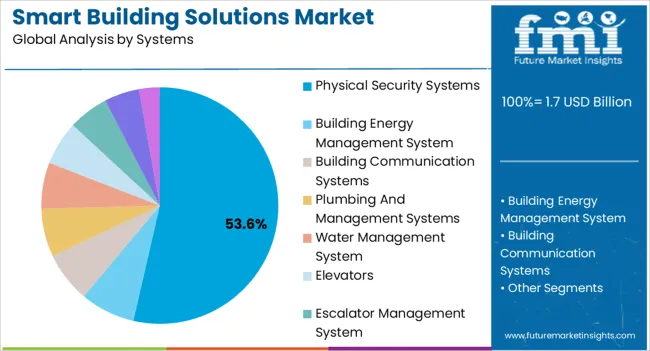
The physical security systems category is projected to hold 53.60% of market share within the systems segment, making it the most dominant area. The expansion of this segment is being propelled by heightened concerns around workplace safety, data protection, and compliance with security regulations.
Smart surveillance, biometric access control, and integrated alarm systems have gained traction due to their role in preventing unauthorized entry and ensuring asset protection. The convergence of AI and IoT has further strengthened adoption, allowing real time monitoring, automated alerts, and analytics driven decision making.
Enterprises across manufacturing and commercial facilities are investing heavily in physical security systems to address evolving threat landscapes, thereby reinforcing their leadership position in the smart building solutions market.
Globally, the smart building solutions market is largely driven by government initiatives for building automation. In addition to this, the concept enables an effective energy management system for a building, thereby reducing energy wastage. Therefore, this factor is anticipated to drive the demand for smart building solutions.
The growing number of smart energy systems is expected to boost the sales of smart building solutions. Also, a relentless pursuit of improving access, efficiency, sustainability, and comfort is anticipated to drive innovations in smart building solutions. Innovations in the smart buildings market are projected to be driven by technology players that are increasingly focused on extending IoT backbones.
Factors Restraining Growth in Smart Building Solutions Market
| Countries | Revenue Share % (2025) |
|---|---|
| The United States | 19.1% |
| Germany | 10.4% |
| Japan | 5.9% |
| Australia | 3.1% |
| North America | 26.9% |
| Europe | 23.9% |
| Countries | CAGR % (2025 to 2035) |
|---|---|
| China | 14.5% |
| India | 10.5% |
| The United Kingdom | 10.2% |
North America is estimated to capture a notable share and lead the global smart buildings solution market, accounting for 26.9% of the overall market share in 2025. The United States and Canada hold a significant portion, and they are prominent countries contributing to technology development in this region. The United States itself held a market share of 19.1% in 2025. For instance,
Europe held a considerable share of 23.9% of the global market for smart building solutions in 2025. The regional market is expected to grow at a moderate pace in Europe because of the growing awareness of smart building solutions and the government's initiatives in the region.
The availability of resources, innovations in IT, and increasing adoption of the smart building solutions concept furthermore encourage new players to step into the market. Germany market held a market share of 10.4% in 2025. The growth is attributed to the new development projects, and policy-based change in building procedures etc.
| Category | By Application Type |
|---|---|
| Leading Segment | Commercial Buildings |
| Market Share% (2025) | 17.5% |
| Category | By System Type |
|---|---|
| Leading Segment | Building Energy Management |
| Market Share% (2025) | 14.4% |
Based on application type, commercial buildings are flourishing in the market as they held a market share of 17.5% in 2025. The growth is attributed to high economic activities, expanding privately owned businesses along with their management infrastructures. Also, the new corporate structure penetrating emerging economies is likely to make a change in the way we look at it.
Based on system type, building energy management is leading the category. The segment held a market share of 14.4% in 2025. The projected growth is caused by the new high government investment in enhanced energy management due to power-saving and better risk management. Moreover, the growing demand for sustainable energy management in commercial buildings is increasing its adoption.
How is the Start-up Ecosystem in the Smart Building Solutions Market?
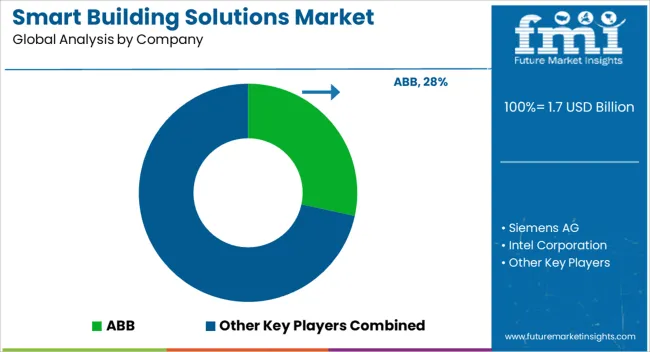
The smart building solutions market is currently fragmented, with the presence of established global and domestic players across the globe. By incorporating modern technologies and customizing products, the market is likely to be propelled forward. Currently, vendors are focusing mainly on offering innovative products and solutions that can optimize energy consumption and serve a high level of building automation.

Smart Building Solutions Market: Key Contracts/ Agreements/ Acquisitions
The players in the smart buildings market have adopted various growth strategies, such as partnerships, business extensions, agreements, and collaborations. These players also focus on product launches and product enhancements to further increase their market presence and expand their customer base. For instance,
Recent Developments in the Smart Building Solutions Market
The global smart building solutions market is estimated to be valued at USD 1.7 billion in 2025.
The market size for the smart building solutions market is projected to reach USD 5.3 billion by 2035.
The smart building solutions market is expected to grow at a 11.9% CAGR between 2025 and 2035.
The key product types in smart building solutions market are manufacturing facilities, residential buildings, commercial buildings, university, school, hospital buildings, government & public infrastructure and others.
In terms of systems, physical security systems segment to command 53.6% share in the smart building solutions market in 2025.


Our Research Products

The "Full Research Suite" delivers actionable market intel, deep dives on markets or technologies, so clients act faster, cut risk, and unlock growth.

The Leaderboard benchmarks and ranks top vendors, classifying them as Established Leaders, Leading Challengers, or Disruptors & Challengers.

Locates where complements amplify value and substitutes erode it, forecasting net impact by horizon

We deliver granular, decision-grade intel: market sizing, 5-year forecasts, pricing, adoption, usage, revenue, and operational KPIs—plus competitor tracking, regulation, and value chains—across 60 countries broadly.

Spot the shifts before they hit your P&L. We track inflection points, adoption curves, pricing moves, and ecosystem plays to show where demand is heading, why it is changing, and what to do next across high-growth markets and disruptive tech

Real-time reads of user behavior. We track shifting priorities, perceptions of today’s and next-gen services, and provider experience, then pace how fast tech moves from trial to adoption, blending buyer, consumer, and channel inputs with social signals (#WhySwitch, #UX).

Partner with our analyst team to build a custom report designed around your business priorities. From analysing market trends to assessing competitors or crafting bespoke datasets, we tailor insights to your needs.
Supplier Intelligence
Discovery & Profiling
Capacity & Footprint
Performance & Risk
Compliance & Governance
Commercial Readiness
Who Supplies Whom
Scorecards & Shortlists
Playbooks & Docs
Category Intelligence
Definition & Scope
Demand & Use Cases
Cost Drivers
Market Structure
Supply Chain Map
Trade & Policy
Operating Norms
Deliverables
Buyer Intelligence
Account Basics
Spend & Scope
Procurement Model
Vendor Requirements
Terms & Policies
Entry Strategy
Pain Points & Triggers
Outputs
Pricing Analysis
Benchmarks
Trends
Should-Cost
Indexation
Landed Cost
Commercial Terms
Deliverables
Brand Analysis
Positioning & Value Prop
Share & Presence
Customer Evidence
Go-to-Market
Digital & Reputation
Compliance & Trust
KPIs & Gaps
Outputs
Full Research Suite comprises of:
Market outlook & trends analysis
Interviews & case studies
Strategic recommendations
Vendor profiles & capabilities analysis
5-year forecasts
8 regions and 60+ country-level data splits
Market segment data splits
12 months of continuous data updates
DELIVERED AS:
PDF EXCEL ONLINE
Smart Building Delivery Robot Market Size and Share Forecast Outlook 2025 to 2035
Smart Building Market Size and Share Forecast Outlook 2025 to 2035
Smart Home Solutions Market Size and Share Forecast Outlook 2025 to 2035
Building Energy Management Solutions Market Size and Share Forecast Outlook 2025 to 2035
Smart Meeting Pod Market Size and Share Forecast Outlook 2025 to 2035
Smart Electrogastrogram Recorder Market Size and Share Forecast Outlook 2025 to 2035
Smart Aerial Work Robots Market Size and Share Forecast Outlook 2025 to 2035
Smart Bladder Scanner Market Size and Share Forecast Outlook 2025 to 2035
Smart School Bus Platform Market Size and Share Forecast Outlook 2025 to 2035
Smart Home Wireless Smoke Detector Market Size and Share Forecast Outlook 2025 to 2035
Smart Bus Platform Market Size and Share Forecast Outlook 2025 to 2035
Smart Vision Processing Chips Market Size and Share Forecast Outlook 2025 to 2035
Smart Touch Screen Scale Market Size and Share Forecast Outlook 2025 to 2035
Smart Magnetic Drive Conveyor System Market Size and Share Forecast Outlook 2025 to 2035
Smart Wheelchair market Size and Share Forecast Outlook 2025 to 2035
Smart Mining Technologies Market Size and Share Forecast Outlook 2025 to 2035
Smart Parking Market Size and Share Forecast Outlook 2025 to 2035
Smart Digital Valve Positioner Market Forecast and Outlook 2025 to 2035
Smart Card IC Market Size and Share Forecast Outlook 2025 to 2035
Smart-Tag Inlay Inserters Market Analysis - Size and Share Forecast Outlook 2025 to 2035

Thank you!
You will receive an email from our Business Development Manager. Please be sure to check your SPAM/JUNK folder too.
Chat With
MaRIA