The Industry Analysis of Last-mile Delivery Software in Japan is estimated to be valued at USD 104.2 million in 2025 and is projected to reach USD 256.1 million by 2035, registering a compound annual growth rate (CAGR) of 9.4% over the forecast period.
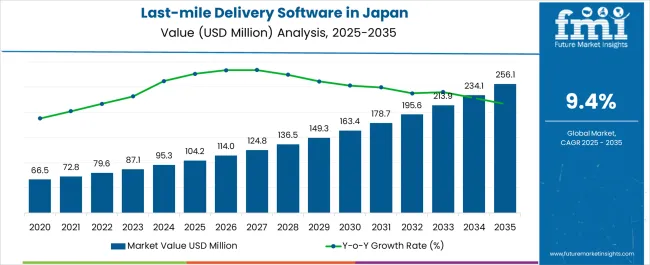
| Metric | Value |
|---|---|
| Industry Analysis of Last-mile Delivery Software in Japan Estimated Value in (2025E) | USD 104.2 million |
| Industry Analysis of Last-mile Delivery Software in Japan Forecast Value in (2035F) | USD 256.1 million |
| Forecast CAGR (2025 to 2035) | 9.4% |
The last-mile delivery software market in Japan is experiencing robust growth. Increasing e-commerce penetration, rising consumer expectations for faster deliveries, and the need for operational efficiency in logistics are driving demand. Current market dynamics are characterized by the adoption of advanced route optimization, real-time tracking, and analytics-enabled delivery management.
Regulatory frameworks and technological advancements are supporting digital transformation within logistics networks. Challenges such as urban congestion, labor shortages, and rising fuel costs are being mitigated through software-enabled efficiency and automation. The future outlook is shaped by continued integration of AI and IoT technologies, growing investment in cloud infrastructure, and expansion of delivery networks across metropolitan and regional areas.
Growth rationale is anchored on the ability of software solutions to optimize resource utilization, improve customer satisfaction, and enable scalability for logistics providers Strategic adoption by enterprise logistics operators, combined with continuous innovation in cloud and mobile platforms, is expected to sustain long-term market expansion and broader industry penetration.
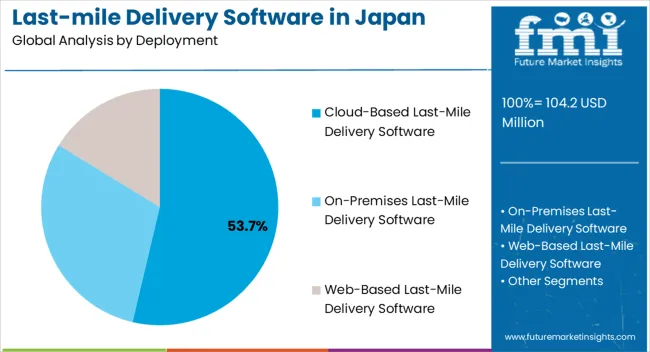
The cloud-based last-mile delivery software segment, representing 53.70% of the deployment category, has been leading due to its scalability, accessibility, and cost-effectiveness. Adoption has been supported by centralized data management, seamless integration with enterprise logistics systems, and enhanced security features.
Cloud deployment allows real-time monitoring, route optimization, and data-driven decision-making, which have reinforced preference among large-scale logistics operators. Continuous platform updates, high availability, and minimal infrastructure requirements have increased operational efficiency and reduced total cost of ownership.
Service providers’ emphasis on cloud-native capabilities and API integration with third-party applications has strengthened market acceptance The segment’s dominance is expected to continue as enterprises increasingly prioritize flexibility, remote access, and rapid deployment, ensuring sustained contribution to overall market share.
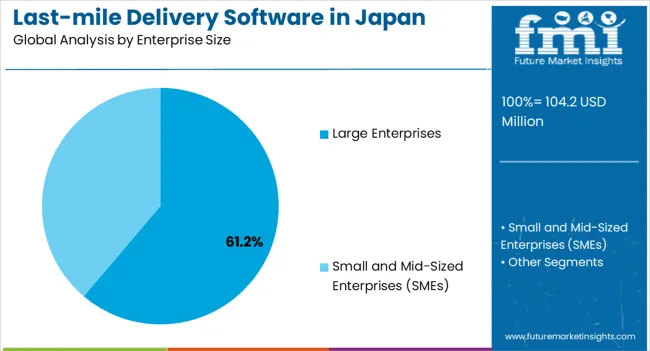
The large enterprises segment, holding 61.20% of the enterprise size category, has maintained leadership due to high-volume delivery requirements and the ability to invest in advanced software solutions. Adoption has been driven by the need for integrated logistics management, efficiency optimization, and compliance with national delivery standards.
Large enterprises benefit from economies of scale, dedicated IT infrastructure, and specialized logistics teams, which enhance software utilization. The segment’s growth is supported by strategic deployment of analytics, automation, and AI-powered route planning to reduce operational costs and improve delivery performance.
Continued focus on expanding delivery networks and digital transformation initiatives is expected to sustain segment share and reinforce market dominance in Japan.
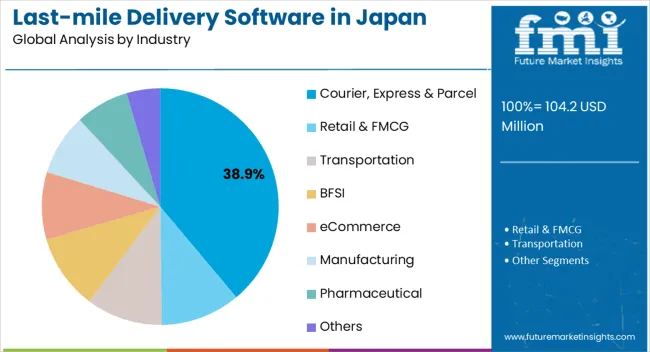
The courier, express, and parcel segment, accounting for 38.90% of the industry category, has emerged as the leading industry due to the high volume of time-sensitive shipments and increasing demand for efficient delivery solutions. Adoption has been supported by the need for route optimization, real-time tracking, and customer communication tools to enhance service quality.
Operational pressures such as urban congestion and delivery density have accelerated the integration of advanced last-mile software. Market growth is further reinforced by e-commerce expansion and rising expectations for same-day or next-day deliveries.
Continuous innovation in predictive analytics, automation, and mobile-enabled tracking solutions is expected to sustain the segment’s market share and drive broader adoption within the Japanese logistics sector.
Japanese show an acute inclination toward online shopping. Consumers opt for online deliveries while virtually tracking orders from the warehouse to the sorting center to the doorstep.
Some of the adoption patterns impacting the last-mile delivery software businesses in Japan are listed below:
The cloud-based delivery software is deployed at a greater rate and enjoys maximum market share in Japan. Several businesses in Japan prioritize flexibility and cost-effectiveness while opting for last-mile delivery software for their operations.
End users of last-mile delivery solutions in Japan are focusing on scaling their services and products and adjusting resources and capacity to the demand, which is made possible by cloud-based delivery software. Their use is also higher due to cost-efficiency, as users do not need to invest in on-premise servers, thus incurring hardware as well as infrastructure expenses.
| Last-mile Delivery Software in Japan based on Deployment | Forecast CAGR (2025 to 2035) |
|---|---|
| Cloud-based | 11% |
| On-premise | 9.2% |
| Web-based | 8% |
A spike in eCommerce sales in Japan is significantly contributing to the last-mile delivery software businesses’ revenue in the country. The FMCG category in the eCommerce sector is predicted to witness significant prospects as consumers in Japan are inclining toward packaged products and consumables.
| Adoption of Last-mile Delivery Software in Japan | Market Value (2035) |
|---|---|
| eCommerce | USD 67.70 million |
| Courier, Express & Parcel | USD 56.3 million |
The courier, express, and parcel segment follows behind the eCommerce segment. The robustly expanding pace of this segment suggests higher use of this service in Japan to transfer products.
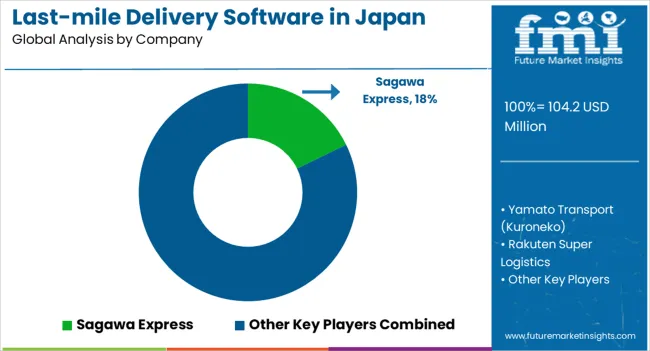
Japan is experiencing an incoming of startups presenting an innovative offering, thus keeping established players on their toes. The combination of startups and established players in Japan makes Japan a fragmented landscape. Given below are some strategic moves followed by last-mile delivery software participants:
Recent Developments Observed in Last-mile Delivery Services in Japan
| Attribute | Details |
|---|---|
| Estimated Industry Size in 2025 | USD 104.2 million |
| Projected Industry Size in 2035 | USD 256.1 million |
| Anticipated CAGR between 2025 to 2035 | 9.4% CAGR |
| Historical Analysis of Demand for Last-mile Delivery Software in Japan | 2020 to 2025 |
| Demand Forecast for Last-mile Delivery Software in Japan | 2025 to 2035 |
| Report Coverage | Industry Size, Industry Trends, Analysis of Key Factors Influencing Last mile Delivery Adoption in Japan, Insights on Japan Players and their Industry Strategy in Japan, Ecosystem Analysis of Local and Regional Japan Providers |
| Key Companies Profiled | Sagawa Express; Yamato Transport (Kuroneko); Rakuten Super Logistics; Sagawa Global Logistics; Nippon Express; Parcel Live Japan; OpenLogi; Delight Ventures; AnyMind Group; QUOQUS; Others |
The global industry analysis of last-mile delivery software in Japan is estimated to be valued at USD 104.2 million in 2025.
The market size for the industry analysis of last-mile delivery software in Japan is projected to reach USD 256.1 million by 2035.
The industry analysis of last-mile delivery software in Japan is expected to grow at a 9.4% CAGR between 2025 and 2035.
The key product types in industry analysis of last-mile delivery software in Japan are cloud-based last-mile delivery software, on-premises last-mile delivery software and web-based last-mile delivery software.
In terms of enterprise size, large enterprises segment to command 61.2% share in the industry analysis of last-mile delivery software in Japan in 2025.


Full Research Suite comprises of:
Market outlook & trends analysis
Interviews & case studies
Strategic recommendations
Vendor profiles & capabilities analysis
5-year forecasts
8 regions and 60+ country-level data splits
Market segment data splits
12 months of continuous data updates
DELIVERED AS:
PDF EXCEL ONLINE
Industry 4.0 Market
Industry Analysis Non-commercial Acrylic Paint in the United States Size and Share Forecast Outlook 2025 to 2035
Industry Analysis of Outbound Tourism in Germany Size and Share Forecast Outlook 2025 to 2035
Industry Analysis of Syringe and Needle in GCC Size and Share Forecast Outlook 2025 to 2035
Industry Analysis of Medical Device Packaging in Southeast Asia Size and Share Forecast Outlook 2025 to 2035
Industry Analysis of Paper Bag in North America Size and Share Forecast Outlook 2025 to 2035
Industry Analysis of Lidding Film in the United States Size and Share Forecast Outlook 2025 to 2035
Industry Analysis of Automotive Lightweight Body Panel in the United States Size and Share Forecast Outlook 2025 to 2035
Industry Analysis of Electronic Skin in Korea Size and Share Forecast Outlook 2025 to 2035
Industry Analysis of Electronic Skin in Western Europe Size and Share Forecast Outlook 2025 to 2035
Europe Second-hand Apparel Market Growth – Trends & Forecast 2024-2034
Industry Analysis of Electronic Skin in Japan Size and Share Forecast Outlook 2025 to 2035
DOAS Industry Analysis in the United States Forecast and Outlook 2025 to 2035
FIBC Industry Analysis in Japan Size and Share Forecast Outlook 2025 to 2035
Western Europe Pectin Market Analysis by Product Type, Application, and Country Through 2035
Pectin Industry Analysis in Japan Size and Share Forecast Outlook 2025 to 2035
Mezcal Industry Analysis in Korea – Trends, Demand & Industry Growth
Mezcal Industry Analysis in Western Europe Report – Growth, Demand & Forecast 2025 to 2035
Asia Pacific Dental Market Analysis – Growth, Trends & Forecast 2024-2034
Mezcal Industry Analysis in Japan - Consumer Demand & Industry Trends in 2025

Thank you!
You will receive an email from our Business Development Manager. Please be sure to check your SPAM/JUNK folder too.
Chat With
MaRIA