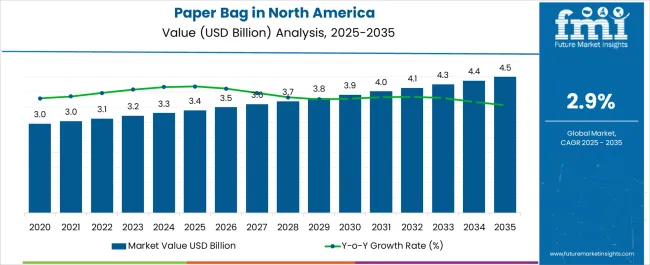
The Industry Analysis of Paper Bag in North America is estimated to be valued at USD 3.4 billion in 2025 and is projected to reach USD 4.5 billion by 2035, registering a compound annual growth rate (CAGR) of 2.9% over the forecast period.
| Metric | Value |
|---|---|
| Industry Analysis of Paper Bag in North America Estimated Value in (2025 E) | USD 3.4 billion |
| Industry Analysis of Paper Bag in North America Forecast Value in (2035 F) | USD 4.5 billion |
| Forecast CAGR (2025 to 2035) | 2.9% |
The paper bag market in North America is witnessing robust growth. Increasing consumer preference for sustainable packaging solutions, regulatory initiatives limiting single-use plastics, and growing environmental awareness are driving adoption. The market is characterized by diverse application across retail, foodservice, and e-commerce sectors.
Manufacturers are focusing on product innovation, enhanced durability, and aesthetic appeal to meet evolving consumer demands. The future outlook is shaped by continued regulatory support for eco-friendly packaging, expansion of retail and foodservice networks, and rising emphasis on corporate sustainability initiatives. Growth rationale is based on the proven environmental benefits of paper bags, scalable manufacturing infrastructure, and the ability to offer customized solutions in terms of size, thickness, and material.
Increasing demand for recyclable and biodegradable packaging across North America is expected to sustain revenue growth Strategic collaborations, improved supply chain management, and investment in high-quality raw materials are contributing to market stability and long-term adoption prospects.
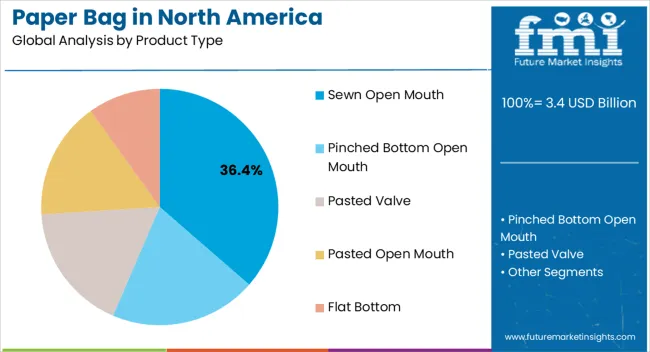
The sewn open mouth segment, holding 36.40% of the product type category, has been leading due to its robustness, reliability, and versatility for carrying medium to heavy loads. Its adoption has been driven by widespread use in grocery stores, retail outlets, and foodservice establishments. Manufacturing efficiency, consistent quality, and ease of customization in dimensions and handles have strengthened market acceptance.
Market share has been supported by consumer preference for durable yet eco-friendly alternatives to plastic bags. Continuous improvements in stitching, reinforcement, and ergonomic design have enhanced usability and operational convenience.
Industry initiatives to standardize quality and meet regulatory requirements have further reinforced the segment’s leading position The segment is expected to maintain its dominance as retail and e-commerce sectors increasingly prioritize sustainable packaging solutions.
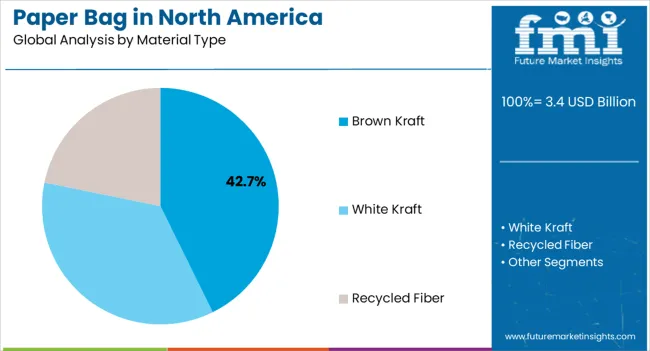
The brown kraft segment, representing 42.70% of the material type category, has maintained leadership due to its cost-effectiveness, recyclability, and compatibility with various manufacturing processes. Adoption has been supported by consistent supply from established pulp and paper industries and broad acceptance among retailers and consumers.
Its natural appearance and strength profile align with sustainability trends, promoting brand visibility and customer trust. Manufacturing processes have been optimized to enhance durability, tear resistance, and printability.
The segment’s market share has been reinforced by regulatory incentives encouraging eco-friendly packaging Continuous innovation in fiber processing and coating technologies is expected to sustain growth and ensure that brown kraft remains the preferred material in the North American paper bag market.
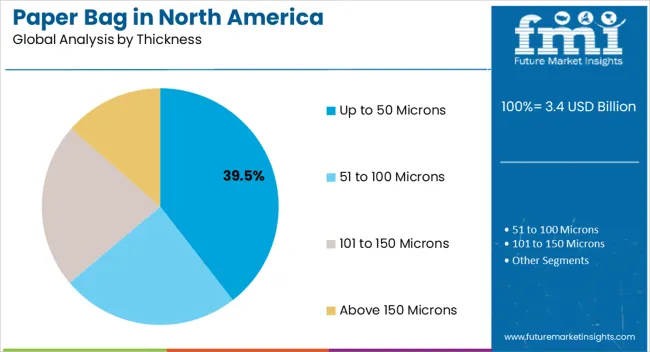
The up to 50 microns segment, holding 39.50% of the thickness category, has emerged as the leading segment due to its optimal balance of strength, flexibility, and material efficiency. Adoption has been driven by suitability for retail and lightweight foodservice applications.
Production techniques have been refined to maintain uniformity, prevent tearing, and allow efficient printing. The segment’s market share has been reinforced by cost efficiency and alignment with sustainability standards promoting minimal material usage.
End-user preference for convenient, lightweight, and recyclable bags has further strengthened demand Ongoing improvements in paper layering, lamination, and reinforcement are expected to maintain the segment’s leading position while supporting broad adoption across multiple application areas in North America.
The demand for paper bag in North America grew at a CAGR of 1.9% in the historical period from 2020 to 2025. It is anticipated to witness a CAGR of 3.0% in the projection period. Revenue generated from paper bag sales in North America stood at USD 3,093.6 million in 2025.
There is a growing emphasis on sustainability and environmental consciousness, with consumers and businesses opting for eco-friendly packaging alternatives over plastic-based materials. With growing environmental awareness, e-commerce companies are shifting towards sustainable packaging solutions. Paper bag are eco-friendly and biodegradable, making them an attractive option.
Various e-commerce businesses use branded paper bags to enhance their brand image and provide a better unboxing experience for customers. This will increase the demand for custom-printed paper bags across North America.
Paper bag can be customized in terms of size, shape, and design, allowing e-commerce companies to tailor packaging to their specific needs. The growth of the e-commerce space is leading to an increase in online shopping, directly correlating with the demand for packaging materials like paper bags.
Various regulations and bans on single-use plastics in North America have led e-commerce companies to explore paper bag as a compliant alternative. Government regulations and policies aimed at reducing plastic usage further push this trend.
Key players are recognizing the marketing value of paper bag and using them as branding opportunities to convey their eco-conscious commitments to the growing rate of consumers who prioritize sustainability.
For instance, a study conducted by the International Food Information Council (IFIC) reveals that almost 40% of consumers across North America base their decisions on the environmental sustainability of a particular product.
Paper bag address environmental, economic, and hygienic concerns while providing several benefits to different industries. It includes foodservice, retail, e-commerce, agriculture, and building & construction industries across North America. These markets are constantly looking for more dependable and environmentally responsible packaging choices.
Paper-based packaging such as paper bag, in addition to meeting regulatory standards, is part of a fully sustainable approach that matches consumers’ rising awareness of environmental obligations. This makes them an ideal replacement for plastic-based packaging across several applications.
Advancement in paper bag manufacturing technology is another factor that has led to improved durability and versatility of the products. It helps drive their adoption in various industries, such as retail, food service, and hospitality. These factors collectively influence the demand for paper bag in North America.
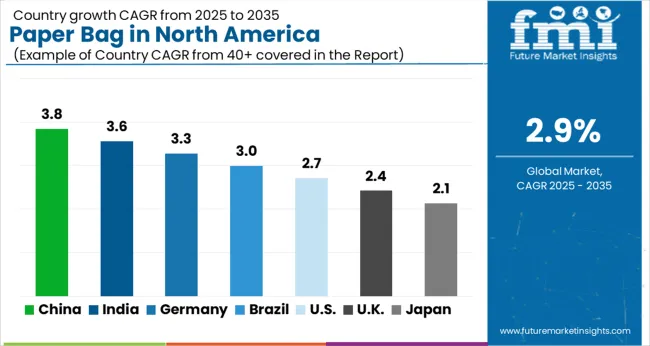
The table below shows the growth potential of demand for paper bag in North America regarding CAGR. Based on this, it is expected that Canada is set to monopolize sales during the forecast period. It is likely to expand at 3.3% CAGR between 2025 and 2035. It is followed by the United Sates, projected to propel at 2.9% CAGR from 2025 to 2035.
| Countries | Value-based CAGR (2025 to 2035) |
|---|---|
| United States | 2.9% |
| Canada | 3.3% |
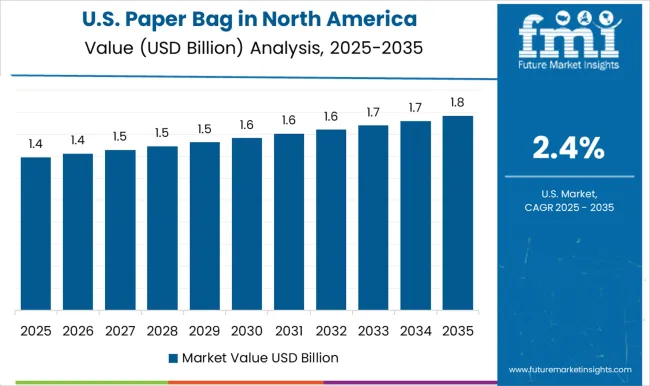
The demand for paper bag in the United States is projected to witness a CAGR of 2.9% between 2025 and 2035. It is anticipated to generate revenue of USD 3,362.9 million by 2035 end.
The demand for paper bags in the United States is driven by increasing awareness and a shift away from single-use plastic bags. Various states and municipalities in United States have implemented plastic bag bans and fees. It will further aid in driving demand for paper bag as an eco-friendly alternative.
Businesses in the United States opt for custom-printed paper bag to promote their brand. This trend has led to a growing demand for personalized and branded paper bag. Paper bag are favored for their recyclability, which aligns with sustainability goals and regulations.
Manufacturers continuously innovate in design, incorporating features such as handles and reinforced bottoms for added convenience and durability. Key players in the United States include International Paper Company, WestRock, Grorgia-Paific, and others.
Canada is expected to propel at a CAGR of 3.3% from 2025 to 2035. It is poised to generate revenue of USD 932.2 million by 2035.
Demand for paper bag in Canada is growing due to rising concerns about plastic pollution. Paper bag is seen as an eco-friendly option and a perfect alternative to plastic bag. The retail industry, including grocery stores and boutiques, is a significant consumer of paper bag in Canada.
Growing trends towards customized and branded paper bag in the Canada will drive growth for paper bag. Businesses use paper bags as a marketing tool, with unique designs and branding to enhance their image. Manufacturers in Canada are crafting paper bags with different materials, such as recycled and kraft paper. The choice of material can impact cost and environmental footprint of the bag.
The table below highlights the demand for paper bag in North America based on different categories. Under the product segment, the pinched bottom open mouth is set to register a 1.9% CAGR through 2035. It is followed by the sewn open mouth segment and pasted value segment.
Based on the material, the demand for brown kraft is estimated to surpass at 2.5% CAGR between 2025 and 2035. It is followed by the white kraft bag and recycled fiber segment during the forecast period
| Product | Pinched Bottom Open Mouth |
|---|---|
| Value CAGR | 1.9% |
Based on the product type, the pinched bottom open mouth segment is anticipated to hold around 25.4% of the share by 2035. Pinched bottom open mouth paper bag are used by several end users such as retail stores, restaurants and cafes, farmers’ markets, and bakeries.
Compared to conventional paper bag, PBOMs often have a bigger base, making them more robust and unlikely to topple over. This makes them a preferred option for several food & beverage and e-commerce applications. Increasing demand for online grocery delivery services is another factor driving the segment.
These bag offer customizable options, catering to various industries and product types. Retailers might opt for this packaging solution due to its ease of display and customer accessibility. Positive perception of paper packaging will contribute to growing demand for paper bag in North America.
| Material Type | Brown Kraft |
|---|---|
| Value CAGR | 2.5% |
The brown kraft segment is estimated to hold about 56.0% share by 2035. It is expected to register USD 2,407.2 million by 2035.
Brown kraft paper bag is renowned for their strength and durability, and most are also resistant to moisture penetration and other environmental complications. Compared to other types of paper, its relative inexpensiveness makes it an ideal choice for use across several industries. Brown kraft paper bag has been witnessing high demand for the packaging of food products such as flour and sugar, among others.
Brown kraft paper bags are often perceived as eco-friendly compared to plastic bags. It helps align with the growing preference for sustainable and environmentally responsible packaging options. Retailers and grocery stores have switched to brown kraft paper bag as part of their commitment to sustainability, further increasing demand for these bag in North America.
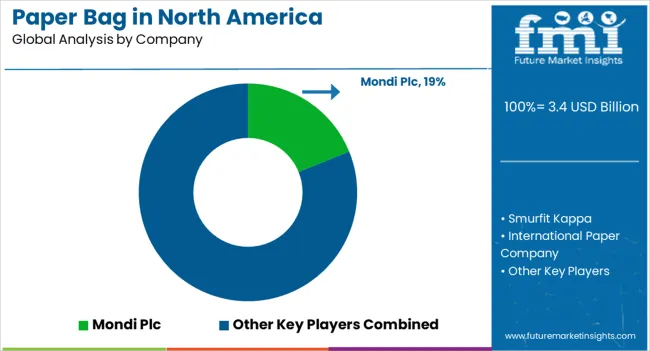
Key manufacturers are trying to focus on increasing their production capacity to meet the increasing demand for paper bag. They are increasing their product portfolio to cater to North America's growing demand for paper bags.
Key players are exploring alternative packaging materials and designs to reduce environmental impact. This includes using paper based raw materials. They are shifting towards eco-friendly production methods, using recycled materials, and reducing their carbon footprint. This aligns with the growing consumer preference for sustainable products. They offer customizable paper bag options for businesses to help manufacturers attract clients looking to promote their brands. Custom printing and unique designs are common strategies to differentiate products.
Recent Developments observed in the North America Paper Bag Industry:
| Attribute | Details |
|---|---|
| Estimated Industry Size in 2025 | USD 3.4 billion |
| Projected Industry Size in 2035 | USD 4.5 billion |
| Anticipated CAGR Growth Rate between 2025 and 2035 | CAGR of 2.9% |
| Base Year for Estimation | 2025 |
| Historical Data | 2020 to 2025 |
| Forecast Period | 2025 to 2035 |
| Quantitative Units | Revenue in USD Million, Volume in Units and CAGR from 2025 to 2035 |
| Report Coverage | Revenue Forecast, Volume Forecast, Company Ranking, Competitive Landscape, Growth Factors, Trends and Pricing Analysis |
| Segments Covered | Product Type, Material Type, Thickness, Distribution Channel, End-use, Region |
| Key Countries Covered |
United States, Canada |
| Key Companies Profiled | Mondi Plc; Smurfit Kappa; International Paper Company; JohnPac Inc; ProAmpac LLC; Stora Enso Oyj; Oji Holdings Inc; Novolex Holdings Inc; Conitex Sonoco; Ronopac Inc; Atlas Paper Bag Co Ltd; Huhtamki OYJ; Global-Pac Inc; United Bag, Inc; Material Motion Inc. |
The global industry analysis of paper bag in North America is estimated to be valued at USD 3.4 billion in 2025.
The market size for the industry analysis of paper bag in North America is projected to reach USD 4.5 billion by 2035.
The industry analysis of paper bag in North America is expected to grow at a 2.9% CAGR between 2025 and 2035.
The key product types in industry analysis of paper bag in North America are sewn open mouth, pinched bottom open mouth, pasted valve, pasted open mouth and flat bottom.
In terms of material type, brown kraft segment to command 42.7% share in the industry analysis of paper bag in North America in 2025.


Our Research Products

The "Full Research Suite" delivers actionable market intel, deep dives on markets or technologies, so clients act faster, cut risk, and unlock growth.

The Leaderboard benchmarks and ranks top vendors, classifying them as Established Leaders, Leading Challengers, or Disruptors & Challengers.

Locates where complements amplify value and substitutes erode it, forecasting net impact by horizon

We deliver granular, decision-grade intel: market sizing, 5-year forecasts, pricing, adoption, usage, revenue, and operational KPIs—plus competitor tracking, regulation, and value chains—across 60 countries broadly.

Spot the shifts before they hit your P&L. We track inflection points, adoption curves, pricing moves, and ecosystem plays to show where demand is heading, why it is changing, and what to do next across high-growth markets and disruptive tech

Real-time reads of user behavior. We track shifting priorities, perceptions of today’s and next-gen services, and provider experience, then pace how fast tech moves from trial to adoption, blending buyer, consumer, and channel inputs with social signals (#WhySwitch, #UX).

Partner with our analyst team to build a custom report designed around your business priorities. From analysing market trends to assessing competitors or crafting bespoke datasets, we tailor insights to your needs.
Supplier Intelligence
Discovery & Profiling
Capacity & Footprint
Performance & Risk
Compliance & Governance
Commercial Readiness
Who Supplies Whom
Scorecards & Shortlists
Playbooks & Docs
Category Intelligence
Definition & Scope
Demand & Use Cases
Cost Drivers
Market Structure
Supply Chain Map
Trade & Policy
Operating Norms
Deliverables
Buyer Intelligence
Account Basics
Spend & Scope
Procurement Model
Vendor Requirements
Terms & Policies
Entry Strategy
Pain Points & Triggers
Outputs
Pricing Analysis
Benchmarks
Trends
Should-Cost
Indexation
Landed Cost
Commercial Terms
Deliverables
Brand Analysis
Positioning & Value Prop
Share & Presence
Customer Evidence
Go-to-Market
Digital & Reputation
Compliance & Trust
KPIs & Gaps
Outputs
Full Research Suite comprises of:
Market outlook & trends analysis
Interviews & case studies
Strategic recommendations
Vendor profiles & capabilities analysis
5-year forecasts
8 regions and 60+ country-level data splits
Market segment data splits
12 months of continuous data updates
DELIVERED AS:
PDF EXCEL ONLINE
North America Silo Bags Market Size and Share Forecast Outlook 2025 to 2035
Europe Retail Paper Bag Market Trends – Growth & Forecast 2023-2033
Europe Ecommerce Paper Bags Market Analysis – Trends & Forecast 2024-2034
Snowplow Industry Analysis in North America Size and Share Forecast Outlook 2025 to 2035
Toilet Seat Industry Analysis in North America Size and Share Forecast Outlook 2025 to 2035
Cosmetic Jar Industry Analysis in North America Size and Share Forecast Outlook 2025 to 2035
Carbon Steel Industry Analysis in North America Forecast & Analysis: 2025 to 2035
North America Booklet Label Market Growth – Trends & Forecast 2023-2033
Injectable Drug Industry Analysis in North America Forecast Outlook 2025 to 2035
North America Cement Packaging Industry Analysis – Trends & Forecast 2024-2034
Palletizing Robot Industry Analysis in North America Size and Share Forecast Outlook 2025 to 2035
Potassium Formate Industry Analysis in North America - Size, Share & Forecast 2025 to 2035
Organic Fertilizer Industry Analysis in North America Analysis – Size, Share, and Forecast Outlook 2025 to 2035
North America Vertical Turbine Pump Market Analysis & Forecast by Head, Material Type, Stages, Power Rating, End-use, and Region Through 2035
Luxury Interior Fabric Industry Analysis in North America and Europe Growth, Trends and Forecast from 2025 to 2035
Home Healthcare Software Industry Analysis in North America Size and Share Forecast Outlook 2025 to 2035
Hardware Asset Management Industry Analysis in North America Forecast Outlook 2025 to 2035
Yoga & Meditation Product Industry analysis in North America Size and Share Forecast Outlook 2025 to 2035
Medium Voltage Transformer Industry Analysis in North America Size and Share Forecast Outlook 2025 to 2035
Walk-In Cooler and Freezer Market Growth – Trends & Forecast 2024-2034

Thank you!
You will receive an email from our Business Development Manager. Please be sure to check your SPAM/JUNK folder too.
Chat With
MaRIA