Reports

- Global Locations -

Headquarters

Future Market Insights, Inc.

Christiana Corporate, 200
Continental Drive, Suite 401,
Newark, Delaware - 19713,
United States

T: +1-347-918-3531

Americas

Future Market Insights, Inc.

616 Corporate Way, Suite 2-9018,
Valley Cottage, NY 10989, United States

MEA

Future Market Insights

1602-6 Jumeirah Bay X2 Tower, Plot No: JLT-PH2-X2A,
Jumeirah Lakes Towers, Dubai,
United Arab Emirates

Europe

Future Market Insights

3rd Floor, 207 Regent Street,
W1B 3HH London
United Kingdom

T: + 44 (0) 20 8123 9659

Asia Pacific

Future Market Insights

IndiaLand Global Tech Park, Unit UG-1, Behind Grand HighStreet, Phase 1, Hinjawadi, MH, Pune – 411057, India

United States Automotive Lightweight Body Panel Industry Analysis for 2023 to 2033

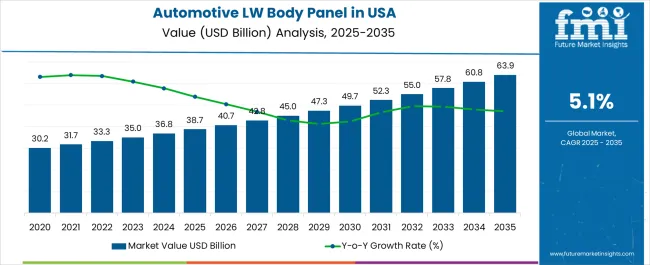
The United States lightweight body panel industry analysis reveals a projected CAGR of 4.5% from 2023 to 2033. Sales are anticipated to reach US$ 34,867.8 million in 2023. It is projected to secure US$ 54,359.1 million by 2033. Revenue stood at a valuation of US$ 32,314.3 million in 2022.

Lightweight automotive body panels continue to gain traction in the United States due to their potential to reduce vehicle weight and improve fuel efficiency. The growing emphasis on sustainability is driving a trend towards recyclable and eco-friendly polymer materials for automotive body panels in the United States.

Sustainability is a dominant trend driving the polymer-based automotive lightweight body panel sales in the United States. Automakers increasingly prioritize eco-friendly materials and production processes to meet consumer demand for sustainable transportation. Polymer-based materials align well with this trend as they often have a lower environmental footprint than traditional steel.

Lightweight materials are renowned for greater design flexibility compared to traditional metals. This makes it popular among automakers, enabling them to create innovative and aerodynamic vehicle designs. It also appeals to consumers seeking visually appealing and efficient vehicles.

Lightweight body panel is known for its durability and corrosion resistance, which extends the lifespan of cars and reduces maintenance costs. This is particularly valuable in regions with harsh weather conditions. These are substantial factors projected to drive demand during the forecast period.

Attributes Key Insights
United States Automotive Lightweight Body Panel Industry Analysis (2022A) US$ 32,314.3 million
United States Automotive Lightweight Body Panel Industry Analysis Estimated Year Value (2023E) US$ 34,867.8 million
United States Automotive Lightweight Body Panel Industry Analysis Projected Year Value (2033F) US$ 54,359.1 million
Value-based CAGR (2023 to 2033) 4.5%

Don't pay for what you don't need

Customize your report by selecting specific countries or regions and save 30%!

2018 to 2022 United States Automotive Lightweight Body Panel Sales Insights vs. 2023 to 2033 Forecast

The United States automotive lightweight body panel sales stood at US$ 32,314.3 million in 2022. In the forecast period, between 2023 and 2033, demand will likely grow at 4.5% CAGR.

Historical United States Automotive Lightweight Body Panel Sales (2022) US$ 32,314.3 million

Automotive manufacturers continue prioritizing lightweighting to enhance fuel efficiency and meet stringent emissions regulations. It has driven the demand for innovative polymer materials such as carbon fiber composites and advanced plastics. The rise of electric vehicles presents both opportunities and challenges, as weight reduction remains crucial, but EVs must also account for the weight of batteries.

Sustainability and recyclability are gaining prominence in material choices and advancements in manufacturing technologies. These technologies, including injection molding and 3D printing, are poised to impact production.

Advancement of intelligent and functional polymer-based lightweight body panels encompass integrated sensors, lighting components, and advanced functionalities to enhance vehicle performance and aesthetics. For instance, certain automakers are exploring the integration of LED lighting within these panels to improve visibility and communication. Others are incorporating real-time structural integrity sensors, providing valuable data for maintenance and safety.

These technological innovations hold great promise and bolster the overall value proposition of polymer-based body panels. As vehicles increasingly embrace connectivity and autonomy, the demand for intelligent and functional panels is anticipated to rise. It will likely foster product innovation and new prospects for manufacturers. There is a growing emphasis on the circular economy, which promotes materials' reuse and recycling. Lightweight body panels, known for their recyclability, contribute to manufacturers' shift towards such materials.

Manufacturers are exploring closed-loop recycling systems, where end-of-life polymer components can be recycled and reintegrated into new vehicle parts, reducing waste and conserving resources. As sustainability becomes a key selling point for automakers, the demand for polymer-based lightweight body panels is expected to continue its upward trajectory.

Key United States Automotive Lightweight Body Panel Consumption Trends

  • Increased Demand for Fuel Efficiency:

With a growing emphasis on fuel efficiency and reduced emissions, automakers are incorporating lightweight body panels to decrease the overall vehicle weight.

  • Materials Innovation:

The landscape is seeing advancements in composition of materials such as carbon fiber, aluminum, and composite materials. These are lighter than traditional steel, while maintaining strength and safety standards.

  • Electric Vehicle (EV) Adoption:

The rise of electric vehicles has led to a greater need for lightweight materials, as lighter body panels can extend the driving range of electric cars.

  • 3D Printing and Advanced Manufacturing:

Technologies like 3D printing and advanced manufacturing techniques are being explored to create lightweight body panels more efficiently.

  • Recycling and Sustainability:

There is a growing focus on the recyclability and sustainability of lightweight materials to reduce their environmental impact.

Nikhil Kaitwade
Nikhil Kaitwade

Principal Consultant

Talk to Analyst

Find your sweet spots for generating winning opportunities in this market.

Challenges Hindering United States Lightweight Body Panel Revenue Growth

  • Environmental Concerns:

Lightweight materials like carbon fiber have significant environmental concerns related to their production and disposal.

  • Energy Intensive Production:

Producing lightweight materials can be energy-intensive, potentially offsetting the environmental benefits of reduced vehicle weight.

  • Recycling and Disposal:

Proper recycling and disposal methods for lightweight materials are not as established as those for traditional materials including steel.

Comparative View of Adjacent Businesses

The United States automotive lightweight body panel sales are likely to be impacted by peer ecosystems in the automotive domain. These include other businesses such as the global lightweight automotive body panel business and automotive cowl panel business. Out of the three, the automotive cowl panel ecosystem is projected to dominate growth at 7% CAGR through 2033. The global automotive lightweight body panel sales are anticipated to follow at a close second, growing at 4.6% CAGR through 2033. All three businesses will likely benefit from growing demand for electric vehicles.

United States Automotive Lightweight Body Panel Landscape:

Attributes Key Insights
Value-based CAGR (2023 to 2033) 4.5%
Projected Sales (2033) US$ 54,359.1 million
Key Trends
  • Polymer based automotive lightweight body panel to gain traction
  • Increasing demand for electric vehicle
Growth Factors
  • Growing emphasis on sustainable solutions for automotive body panels

Lightweight Automotive Body Panel Landscape:

Attributes Key Insights
Value-based CAGR (2023 to 2033) 4.6%
Projected Sales (2033) US$ 191,369.2 million
Key Trends
  • Rising production of commercial vehicles
  • Increasing demand for electric vehicle
Growth Factors
  • Growing need for energy efficient vehicles

Automotive Cowl Panel Landscape:

Attributes Key Insights
Value-based CAGR (2023 to 2033) 7%
Projected Sales Value (2033) US$ 785 million
Key Trends
  • Rising production of commercial vehicles
  • Increasing demand for electric vehicle
Growth Factors
  • Wide proliferation of electric vehicles

Get the data you need at a Fraction of the cost

Personalize your report by choosing insights you need
and save 40%!

Country-wise Insights

The table below explains the demand for the United States automotive lightweight body panels in the top three regions. The forecast provides the revenue generated by these regions during the forecast period. South United States is anticipated to remain in the forefront by registering US$ 25086 million by 2033.

Midwest United States will likely reach US$ 17524 million by 2033. West United States is set to generate a revenue potential of US$ 5700 million by 2033.

Countries Projected Valuation (2033)
South United States US$ 25086 million
Midwest United States US$ 17524 million
West United States US$ 5700 million

Growth of Electrical Vehicles to Fuel Demand in the United States

The South United States automotive lightweight body panel ecosystem is anticipated to total US$ 25086 million by 2033. It is expected to witness a size of US$ 15742 million in 2023. The automotive industry in the southern United States is driven by growing demand for lightweight materials to improve fuel efficiency and reduce emissions. This has led to a rise in the adoption of lightweight body panels.

Aluminum remains the dominant lightweight material used in body panels. Manufacturers in the region have invested in aluminum production capabilities to meet the demand for lighter and more fuel-efficient vehicles.

While still relatively expensive, carbon fiber-reinforced composites are gaining traction, especially in high-performance and luxury car segments. Few manufacturers are exploring using carbon fiber for lightweight body panels to enhance performance. Southern United States has a well-established network of automotive suppliers, including those specializing in lightweight body panels. This network supports local and global automakers in sourcing lightweight components.

The growth of the electric vehicles (EV) space is also influencing sales of lightweight body panel. Electric vehicles benefit from lightweight materials to maximize range and efficiency. The supply chain disruptions experienced in recent years have prompted manufacturers to assess and diversify their supply chains to ensure a steady flow of lightweight materials.

Flourishing Automotive Industry to Uplift Sales in the Midwest United States

The Midwest United States automotive lightweight body panel revenue is expected to reach US$ 11786 million in 2023. The demand for lightweight body panels is increasing due to the automotive industry's focus on fuel efficiency and emissions reduction. Aluminum and carbon fiber-reinforced composites are the prominent materials in the Midwest for lightweight body panels, owing to their favorable weight-to-strength ratio.

Key automotive original equipment manufacturers (OEMs) in the Midwest are investing in research and production of lightweight body panels to meet regulatory standards and improve vehicle performance. With the rise of electric vehicles, lightweight body panels have become crucial to offset the weight of batteries, further boosting the demand for lightweight materials.

Key suppliers and manufacturers of lightweight body panels are strategically locating their facilities in the Midwest to cater to the local automotive industry and streamline supply chains. Ongoing advancements in manufacturing processes and technologies are enhancing the production efficiency and cost-effectiveness of lightweight body panels.

Presence of Aerospace Manufacturing to Gain Impetus in Western United States

The West United States automotive lightweight body panel ecosystem is anticipated to reach US$ 3441 million in 2023. Growing demand for lightweight body panels, such as aluminum, carbon fiber, and composites will likely fuel growth in Western United States. This is due to their ability to improve fuel efficiency and reduce vehicle emissions. Stringent emissions regulations in states such as California have pushed automakers to adopt lightweight materials to meet fuel efficiency standards, driving the adoption of lightweight body panels.

The presence of aerospace manufacturing in the region has led to the development of advanced lightweight materials and manufacturing techniques that are now being applied in the automotive sector. California is home to several key automotive manufacturers, research institutions, and startups focused on lightweight materials and electric vehicle production, contributing to sales growth.

Carbon fiber-reinforced composites have gained significant traction, especially in high-performance and luxury vehicle segments, owing to their exceptional strength-to-weight ratio. Aluminum remains a popular choice for lightweight body panels in mass-produced vehicles. Companies such as Tesla have utilized aluminum extensively in their electric vehicle designs.

Category-wise Insights

Bumper Segment to Expand through 2033 due to its Lightweight Material

The table below highlights the demand in the United States automotive lightweight body panel business. Demand for bumpers remains high during the forecast period, followed by the bonnet and door.

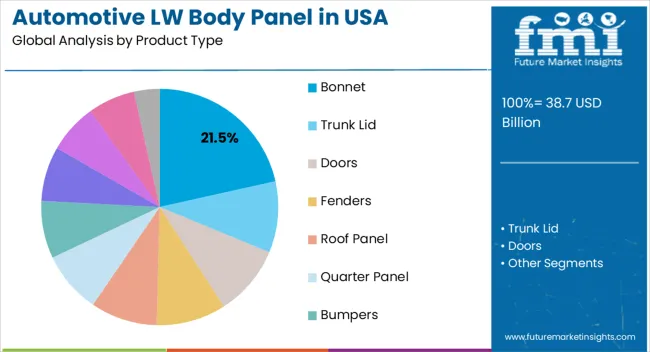
The bumper segment is set to hold about 21.4% shares in the United States automotive lightweight body panel space. It is expected to register a growth of US$ 10,126.5 million by 2033.

Category Product Type
Sub-Category Bumpers
Projected Valuation (2033) US$ 10,126.5 million

Regarding product type, the bumper segment is projected to hold around 21.4% shares in the United States automotive lightweight body panel ecosysyem. Revenue is anticipated to reach a total of US$ 7,228.3 million in 2023. Bumpers made from lightweight materials, such as aluminum or composite materials, can significantly reduce the weight of a vehicle. This is crucial for meeting stricter fuel efficiency and emissions regulations.

Bumpers also play a critical role in vehicle safety. Advancements in materials and design can improve impact absorption, protecting both the vehicle's occupants and pedestrians. Various consumers seek customized and stylish bumpers for their cars. The bumper segment can dominate by offering multiple design options and materials to meet these demands.

With growing environmental awareness, lightweight materials such as aluminum are being preferred due to their recyclability. Bumpers made from these materials align with sustainability goals. Incorporating technology into bumpers, such as sensors for parking assistance or adaptive cruise control, can further enhance their appeal and functionality.

Polypropylene-Based Body Panel to Witness High Demand

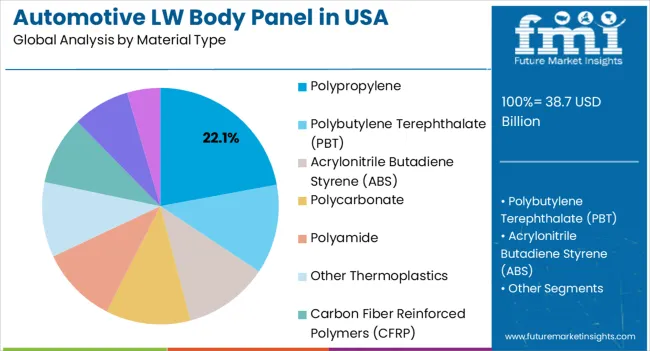
The table below highlights the United States automotive lightweight body panel sales by categories. Under material type, the polypropylene segment will likely dominate in the assessment period. The segment is anticipated to own around 29.6% of shares in 2023. It is anticipated to register a sum of US$ 13,930.4 million by 2033.

Category Product Type
Sub-Category Polypropylene
Projected Valuation (2033) US$ 13,930.4 million

By material type, the polypropylene segment recorded a considerable amount of US$ 10.098.5 million in 2023. It is anticipated to generate a revenue potential of US$ 13,930.4 million by 2033.

Polypropylene is cost-effective to produce and process, making it an economically attractive option for manufacturers. Polypropylene can be molded into various shapes and sizes, allowing greater design flexibility in creating aesthetically pleasing and aerodynamic body panels. This design flexibility is driving its adoption in the luxury car segment.

It offers good impact resistance, enhancing the safety of vehicles and reducing the likelihood of damage in minor collisions, making it highly sought-after by consumers. Unlike some metals, polypropylene is not prone to corrosion, which can extend the lifespan of body panels and reduce maintenance costs. Polypropylene can help dampen vibrations and reduce noise inside the vehicle, leading to a quieter and more comfortable driving experience. Polypropylene is recyclable, aligning with sustainability goals and reducing the environmental footprint of vehicle manufacturing.

Using lightweight materials such as polypropylene can help automakers meet stringent fuel efficiency and emissions regulations. Reducing the weight of body panels can improve the vehicle's overall handling and agility.

Competitive Landscape

Leading manufacturers focus on developing and using advanced lightweight materials like carbon fiber composites and aluminum alloys. This will help reduce body panels' weight while maintaining structural integrity. They are implementing advanced manufacturing processes such as automated stamping, hydroforming, and 3D printing to reduce production costs and improve quality. They also embrace eco-friendly practices by recycling materials, reducing waste, and promoting energy-efficient manufacturing processes.

Recent Developments in the United States Automotive Lightweight Body Panel Ecosystem:

  • In April 2023, Teijin Automotive Technologies reveals that it will supply the right- and left-hand doors, as well as the inner, outer, and lower shell for the tailgate, as well as the right- and left-side rear body panels.
  • In April 2022, the stylish Toyota bZ4X SUV is an all-electric vehicle that seeks to strengthen Toyota's commitment to a future without carbon emissions. Prepared to create a new mark in the Battery Electric Vehicle (BEV) landscape
  • In September 2022, according to the volunteer organization's technical director, Alumobility has created technical specifications for fabricating one-piece automobile body side exterior panels from aluminum sheet and has presented its results to an array of OEMs and Tier 1 suppliers.

Scope of Report

Attribute Details
Estimated Size (2023) US$ 34,867.8 million
Projected Valuation (2033) US$ 54,359.1 million
Value-based CAGR (2023 to 2033) 4.5%
Forecast Period 2023 to 2033
Historical Data Available for 2018 to 2022
Industry Analysis US$ million for Value and Units for Volume
Key Regions Covered Northeast United States, Midwest United States, West United States, South United States
Key Segments Covered By Product Type, By Material Type, By Operation Type, By Vehicle Type, By Sales Channel, and By Regions
Key Companies Profiled
  • Solvay S.A.
  • Magna International, Inc.
  • Gestamp
  • Teijin Limited
  • Owens Corning
  • Lanxess AG
  • Covestro AG
  • Toray Industries, Inc.
  • Hexcel Corporation
  • Plastic Omnium Auto Exteriors, LLC
  • PlastiComp
  • ABC Group, Inc.
  • FLEX-N-GATE CORPORATION
Report Coverage Industry Forecast, Company Share Analysis, Competition Intelligence, DROT Analysis, Sales Dynamics and Challenges, and Strategic Growth Initiatives

United States Automotive Lightweight Body Panel Industry Outlook by Category

By Product Type:

  • Bonnet
  • Trunk Lid
  • Doors
    • Exterior
    • Interior
  • Fenders
  • Roof Panel
  • Quarter Panel
  • Bumpers
  • Rocker Panel
  • Tail Gate
  • Cowl Panel
  • Dashboard / Instrument Panel

By Material Type:

  • Polypropylene
  • Polybutylene
  • Terephthalate
  • Acrylonitrile Butadiene Styrene (ABS)
  • Polycarbonate
  • Polyamide
  • Other Thermoplastics
  • Carbon Fiber Reinforced Polymers (CFRP)
  • Glass Fiber Reinforced Polymers (GFRP)
  • Other Plastic Composites

By Vehicle Type:

  • Passenger Cars
  • Electric Cars
  • Light Commercial Vehicle
  • Heavy Commercial Vehicle
  • Recreational Vehicles

By Sales Channel:

  • Original Equipment Manufacturer (OEM)
  • Aftermarket

By Countries:

  • Northeast United States
  • Midwest United States
  • West United States
  • South United States

Frequently Asked Questions

How big is the United States automotive lightweight body panel space?

Sales in the United States are expected to hit US$ 54,359.1 million by 2023.

What is the demand outlook for United States automotive lightweight body panel ecosystem?

Sales are set to expand at 4.5% CAGR through 2033.

What is the valuation of the United States automotive lightweight body panel sales by 2023?

Sales are predicted to surge to US$ 34,867.8 million by 2023.

What are the trends in the United States automotive lightweight body panel landscape?

Increasing demand for fuel efficiency vehicle is anticipated to drive demand through 2033.

Who are the key players in the United States automotive lightweight body panel ecosystem?

Solvay S.A, Covestro AG etc. are the leading players in the business.

Table of Content

1. Executive Summary

    1.1. Sales Outlook

    1.2. Demand Side Trends

    1.3. Supply Side Trends

    1.4. Technology Roadmap

    1.5. Analysis and Recommendations

2. Sales Overview

    2.1. Sales Coverage / Taxonomy

    2.2. Sales Definition / Scope / Limitations

3. Key Sales Trends

    3.1. Key Trends Impacting the Sales

    3.2. Product Innovation / Development Trends

4. Key Success Factors

    4.1. Product Adoption / Usage Analysis

    4.2. Product USPs / Features

    4.3. Strategic Promotional Strategies

5. Sales Demand Analysis 2018 to 2022 and Forecast, 2023 to 2033

    5.1. Historical Sales Volume ('000 Tons) Analysis, 2018 to 2022

    5.2. Current and Future Sales Volume ('000 Tons) Projections, 2023 to 2033

    5.3. Y-o-Y Growth Trend Analysis

6. Sales - Pricing Analysis

    6.1. Regional Pricing Analysis By Product Type

    6.2. United States Average Pricing Analysis Benchmark

7. Sales Demand (in Value or Size in US$ million) Analysis 2018 to 2022 and Forecast, 2023 to 2033

    7.1. Historical Sales Value (US$ million) Analysis, 2018 to 2022

    7.2. Current and Future Sales Value (US$ million) Projections, 2023 to 2033

        7.2.1. Y-o-Y Growth Trend Analysis

        7.2.2. Absolute $ Opportunity Analysis

8. Sales Background

    8.1. Macro-Economic Factors

        8.1.1. United States GDP Growth Outlook

        8.1.2. United States Chemical industry Overview

        8.1.3. Manufacturing Value-Added

        8.1.4. Industry Value Added

        8.1.5. Parent Sales Outlook

        8.1.6. Other Macro-Economic Factors

    8.2. Forecast Factors - Relevance & Impact

        8.2.1. Government Regulation and Emission Standards

        8.2.2. Electric Vehicle (EV) Sales Growth

        8.2.3. Consumer Preferences and Sustainability

        8.2.4. Material Technology Advancements

        8.2.5. Manufacturing Innovations

        8.2.6. Global Economic Factors

    8.3. Value Chain

        8.3.1. Product Manufacturers

        8.3.2. End Users

        8.3.3. Avg. Profitability Margins

    8.4. COVID-19 Crisis – Impact Assessment

        8.4.1. Current Statistics

        8.4.2. Short-Mid-Long Term Outlook

        8.4.3. Likely Rebound

    8.5. Sales Dynamics

        8.5.1. Drivers

        8.5.2. Restraints

        8.5.3. Opportunity Analysis

    8.6. United States Supply Demand Analysis

9. Sales Analysis 2018 to 2022 and Forecast 2023 to 2033, By Product Type

    9.1. Introduction / Key Findings

    9.2. Historical Sales Size (US$ million) and Volume Analysis By Product Type, 2018 to 2022

    9.3. Current and Future Sales Size (US$ million) and Volume Analysis and Forecast By Product Type, 2023 to 2033

        9.3.1. Bonnet

        9.3.2. Trunk Lid

        9.3.3. Doors

            9.3.3.1. Exterior

            9.3.3.2. Interior

        9.3.4. Fenders

        9.3.5. Roof Panel

        9.3.6. Quarter Panel

        9.3.7. Bumpers

        9.3.8. Rocker Panel

        9.3.9. Tail Gate

        9.3.10. Cowl Panel

        9.3.11. Dashboard / Instrument Panel

    9.4. Sales Attractiveness Analysis By Product Type

10. Sales Analysis 2018 to 2022 and Forecast 2023 to 2033, By Material Type

    10.1. Introduction / Key Findings

    10.2. Historical Sales Size (US$ million) and Volume Analysis By Material Type, 2018 to 2022

    10.3. Current and Future Sales Size (US$ million) and Volume Analysis and Forecast By Material Type, 2023 to 2033

        10.3.1. Polypropylene

        10.3.2. Polybutylene

        10.3.3. Terephthalate

        10.3.4. Acrylonitrile Butadiene Styrene (ABS)

        10.3.5. Polycarbonate

        10.3.6. Polyamide

        10.3.7. Other Thermoplastics

        10.3.8. Carbon Fiber Reinforced Polymers (CFRP)

        10.3.9. Glass Fiber Reinforced Polymers (GFRP)

        10.3.10. Other Plastic Composites

    10.4. Sales Attractiveness Analysis By Material Type

11. Sales Analysis 2018 to 2022 and Forecast 2023 to 2033, By Vehicle Type

    11.1. Introduction / Key Findings

    11.2. Historical Sales Size (US$ million) and Volume Analysis By Vehicle Type, 2018 to 2022

    11.3. Current and Future Sales Size (US$ million) and Volume Analysis and Forecast By Vehicle Type, 2023 to 2033

        11.3.1. Passenger Cars

        11.3.2. Electric Cars

        11.3.3. Light Commercial Vehicle

        11.3.4. Heavy Commercial Vehicle

        11.3.5. Recreational Vehicles

    11.4. Sales Attractiveness Analysis By Vehicle Type

12. Sales Analysis 2018 to 2022 and Forecast 2023 to 2033, By Sales Channel

    12.1. Introduction / Key Findings

    12.2. Historical Sales Size (US$ million) and Volume Analysis By Sales Channel, 2018 to 2022

    12.3. Current and Future Sales Size (US$ million) and Volume Analysis and Forecast By Sales Channel, 2023 to 2033

        12.3.1. OEM

        12.3.2. AfterSales

    12.4. Sales Attractiveness Analysis By Sales Channel

13. Sales Analysis 2018 to 2022 and Forecast 2023 to 2033, by Region

    13.1. Introduction

    13.2. Historical Sales Size (US$ million) and Volume Analysis By Region, 2018 to 2022

    13.3. Current Sales Size (US$ million) and Volume Analysis and Forecast By Region, 2023 to 2033

        13.3.1. Northeast United States

        13.3.2. Midwest United States

        13.3.3. West United States

        13.3.4. South United States

    13.4. Sales Attractiveness Analysis By Region

14. Northeast Sales Analysis 2018 to 2022 and Forecast 2023 to 2033

    14.1. Introduction

    14.2. Pricing Analysis

    14.3. Historical Sales Size (US$ million) and Volume Trend Analysis By Sales Taxonomy, 2018 to 2022

    14.4. Sales Size (US$ million) and Volume Forecast By Sales Taxonomy, 2023 to 2033

        14.4.1. By Product Type

        14.4.2. By Material Type

        14.4.3. By Vehicle Type

        14.4.4. By Sales Channel

    14.5. Sales Attractiveness Analysis

        14.5.1. By Product Type

        14.5.2. By Material Type

        14.5.3. By Vehicle Type

        14.5.4. By Sales Channel

    14.6. Sales Trends

    14.7. Key Sales Participants - Intensity Mapping

    14.8. Drivers and Restraints - Impact Analysis

15. Midwest Sales Analysis 2018 to 2022 and Forecast 2023 to 2033

    15.1. Introduction

    15.2. Pricing Analysis

    15.3. Historical Sales Size (US$ million) and Volume Trend Analysis By Sales Taxonomy, 2018 to 2022

    15.4. Sales Size (US$ million) and Volume Forecast By Sales Taxonomy, 2023 to 2033

        15.4.1. By Product Type

        15.4.2. By Material Type

        15.4.3. By Vehicle Type

        15.4.4. By Sales Channel

    15.5. Sales Attractiveness Analysis

        15.5.1. By Product Type

        15.5.2. By Material Type

        15.5.3. By Vehicle Type

        15.5.4. By Sales Channel

    15.6. Sales Trends

    15.7. Key Sales Participants - Intensity Mapping

    15.8. Drivers and Restraints - Impact Analysis

16. West Sales Analysis 2018 to 2022 and Forecast 2023 to 2033

    16.1. Introduction

    16.2. Pricing Analysis

    16.3. Historical Sales Size (US$ million) and Volume Trend Analysis By Sales Taxonomy, 2018 to 2022

    16.4. Sales Size (US$ million) and Volume Forecast By Sales Taxonomy, 2023 to 2033

        16.4.1. By Product Type

        16.4.2. By Material Type

        16.4.3. By Vehicle Type

        16.4.4. By Sales Channel

    16.5. Sales Attractiveness Analysis

        16.5.1. By Product Type

        16.5.2. By Material Type

        16.5.3. By Vehicle Type

        16.5.4. By Sales Channel

    16.6. Sales Trends

    16.7. Key Sales Participants - Intensity Mapping

    16.8. Drivers and Restraints - Impact Analysis

17. South Sales Analysis 2018 to 2022 and Forecast 2023 to 2033

    17.1. Introduction

    17.2. Pricing Analysis

    17.3. Historical Sales Size (US$ million) and Volume Trend Analysis By Sales Taxonomy, 2018 to 2022

    17.4. Sales Size (US$ million) and Volume Forecast By Sales Taxonomy, 2023 to 2033

        17.4.1. By Product Type

        17.4.2. By Material Type

        17.4.3. By Vehicle Type

        17.4.4. By Sales Channel

    17.5. Sales Attractiveness Analysis

        17.5.1. By Product Type

        17.5.2. By Material Type

        17.5.3. By Vehicle Type

        17.5.4. By Sales Channel

    17.6. Sales Trends

    17.7. Key Sales Participants - Intensity Mapping

    17.8. Drivers and Restraints - Impact Analysis

18. State-wise Polymer Based Sales Analysis

    18.1. Introduction

        18.1.1. Sales Value Proportion Analysis, By Key Countries

        18.1.2. United States Vs. Country Growth Comparison

    18.2. California Polymer Based Automotive Lightweight Body Panel Sales Analysis

        18.2.1. By Product Type

        18.2.2. By Material Type

        18.2.3. By Vehicle Type

        18.2.4. By Sales Channel

    18.3. Texas Polymer Based Automotive Lightweight Body Panel Sales Analysis

        18.3.1. By Product Type

        18.3.2. By Material Type

        18.3.3. By Vehicle Type

        18.3.4. By Sales Channel

    18.4. New York Polymer Based Automotive Lightweight Body Panel Sales Analysis

        18.4.1. By Product Type

        18.4.2. By Material Type

        18.4.3. By Vehicle Type

        18.4.4. By Sales Channel

    18.5. Florida Polymer Based Automotive Lightweight Body Panel Sales Analysis

        18.5.1. By Product Type

        18.5.2. By Material Type

        18.5.3. By Vehicle Type

        18.5.4. By Sales Channel

    18.6. Illinois Polymer Based Automotive Lightweight Body Panel Sales Analysis

        18.6.1. By Product Type

        18.6.2. By Material Type

        18.6.3. By Vehicle Type

        18.6.4. By Sales Channel

    18.7. Pennsylvania Polymer Based Automotive Lightweight Body Panel Sales Analysis

        18.7.1. By Product Type

        18.7.2. By Material Type

        18.7.3. By Vehicle Type

        18.7.4. By Sales Channel

    18.8. Ohio Polymer Based Automotive Lightweight Body Panel Sales Analysis

        18.8.1. By Product Type

        18.8.2. By Material Type

        18.8.3. By Vehicle Type

        18.8.4. By Sales Channel

    18.9. Georgia Polymer Based Automotive Lightweight Body Panel Sales Analysis

        18.9.1. By Product Type

        18.9.2. By Material Type

        18.9.3. By Vehicle Type

        18.9.4. By Sales Channel

    18.10. North Carolina Polymer Based Automotive Lightweight Body Panel Sales Analysis

        18.10.1. By Product Type

        18.10.2. By Material Type

        18.10.3. By Vehicle Type

        18.10.4. By Sales Channel

19. Sales Structure Analysis

    19.1. Sales Analysis by Tier of Companies (Polymer Based Automotive Lightweight Body Panel)

    19.2. Sales Concentration

    19.3. Sales Share Analysis of Top Players

    19.4. Production Capacity Analysis

    19.5. Sales Presence Analysis

        19.5.1. By Vehicle Type Footprint of Players

        19.5.2. By Regional Footprint of Players

        19.5.3. By Channel Footprint of Players

20. Competition Analysis

    20.1. Competition Dashboard

    20.2. Competition Benchmarking

    20.3. Competition Deep Dive

        20.3.1. Solvay S.A.

            20.3.1.1. Overview

            20.3.1.2. Product Portfolio

            20.3.1.3. Profitability by Sales Segments (Product/Channel/Region)

            20.3.1.4. Sales Footprint

            20.3.1.5. Strategy Overview

        20.3.2. Magna International, Inc.

            20.3.2.1. Overview

            20.3.2.2. Product Portfolio

            20.3.2.3. Profitability by Sales Segments (Product/Channel/Region)

            20.3.2.4. Sales Footprint

            20.3.2.5. Strategy Overview

        20.3.3. Gestamp

            20.3.3.1. Overview

            20.3.3.2. Product Portfolio

            20.3.3.3. Profitability by Sales Segments (Product/Channel/Region)

            20.3.3.4. Sales Footprint

            20.3.3.5. Strategy Overview

        20.3.4. Teijin Limited

            20.3.4.1. Overview

            20.3.4.2. Product Portfolio

            20.3.4.3. Profitability by Sales Segments (Product/Channel/Region)

            20.3.4.4. Sales Footprint

            20.3.4.5. Strategy Overview

        20.3.5. Owens Corning

            20.3.5.1. Overview

            20.3.5.2. Product Portfolio

            20.3.5.3. Profitability by Sales Segments (Product/Channel/Region)

            20.3.5.4. Sales Footprint

            20.3.5.5. Strategy Overview

        20.3.6. Lanxess AG

            20.3.6.1. Overview

            20.3.6.2. Product Portfolio

            20.3.6.3. Profitability by Sales Segments (Product/Channel/Region)

            20.3.6.4. Sales Footprint

            20.3.6.5. Strategy Overview

        20.3.7. Covestro AG

            20.3.7.1. Overview

            20.3.7.2. Product Portfolio

            20.3.7.3. Profitability by Sales Segments (Product/Channel/Region)

            20.3.7.4. Sales Footprint

            20.3.7.5. Strategy Overview

        20.3.8. Toray Industries, Inc.

            20.3.8.1. Overview

            20.3.8.2. Product Portfolio

            20.3.8.3. Profitability by Sales Segments (Product/Channel/Region)

            20.3.8.4. Sales Footprint

            20.3.8.5. Strategy Overview

        20.3.9. Hexcel Corporation

            20.3.9.1. Overview

            20.3.9.2. Product Portfolio

            20.3.9.3. Profitability by Sales Segments (Product/Channel/Region)

            20.3.9.4. Sales Footprint

            20.3.9.5. Strategy Overview

        20.3.10. Plastic Omnium Auto Exteriors, LLC

            20.3.10.1. Overview

            20.3.10.2. Product Portfolio

            20.3.10.3. Profitability by Sales Segments (Product/Channel/Region)

            20.3.10.4. Sales Footprint

            20.3.10.5. Strategy Overview

        20.3.11. PlastiComp

            20.3.11.1. Overview

            20.3.11.2. Product Portfolio

            20.3.11.3. Profitability by Sales Segments (Product/Channel/Region)

            20.3.11.4. Sales Footprint

            20.3.11.5. Strategy Overview

        20.3.12. ABC Group, Inc.

            20.3.12.1. Overview

            20.3.12.2. Product Portfolio

            20.3.12.3. Profitability by Sales Segments (Product/Channel/Region)

            20.3.12.4. Sales Footprint

            20.3.12.5. Strategy Overview

        20.3.13. FLEX-N-GATE CORPORATION

            20.3.13.1. Overview

            20.3.13.2. Product Portfolio

            20.3.13.3. Profitability by Sales Segments (Product/Channel/Region)

            20.3.13.4. Sales Footprint

            20.3.13.5. Strategy Overview

21. Assumptions and Acronyms Used

22. Research Methodology

List of Tables

Table 01: Sales Volume ('000 Tons) Historical Data 2018 to 2022 and Forecast 2023 to 2033 By Product Type

Table 02: Sales Value (US$ million)) Historical Data 2018 to 2022 and Forecast 2023 to 2033 By Product Type

Table 03: Sales Volume ('000 Tons) Historical Data 2018 to 2022 and Forecast 2023 to 2033 By Material Type

Table 04: Sales Value (US$ million) Historical Data 2018 to 2022 and Forecast 2023 to 2033 By Material Type

Table 05: Sales Value (US$ million) and Volume ('000 Tons) Historical Data 2018 to 2022 and Forecast 2023 to 2033 By Vehicle Type

Table 06: Sales Value (US$ million) and Volume ('000 Tons) Historical Data 2018 to 2022 and Forecast 2023 to 2033 By Sales Channel

Table 07: Sales Value (US$ million) and Volume ('000 Units) Historical Data 2018 to 2022 and Forecast 2023 to 2033 By Regions

Table 08: Northeast Sales Volume ('000 Tons) Historical Data 2018 to 2022 and Forecast 2023 to 2033 By Region

Table 09: Northeast Sales Value (US$ million) Historical Data 2018 to 2022 and Forecast 2023 to 2033 By Region

Table 10: Northeast Sales Volume ('000 Tons) Historical Data 2018 to 2022 and Forecast 2023 to 2033 By Product Type

Table 11: Northeast Sales Value (US$ million)) Historical Data 2018 to 2022 and Forecast 2023 to 2033 By Product Type

Table 12: Northeast Sales Volume ('000 Tons) Historical Data 2018 to 2022 and Forecast 2023 to 2033 By Material Type

Table 13: Northeast Sales Value (US$ million) Historical Data 2018 to 2022 and Forecast 2023 to 2033 By Material Type

Table 14: Northeast Sales Value (US$ million) and Volume ('000 Tons) Historical Data 2018 to 2022 and Forecast 2023 to 2033 By Vehicle Type

Table 15: Northeast Sales Value (US$ million) and Volume ('000 Tons) Historical Data 2018 to 2022 and Forecast 2023 to 2033 By Sales Channel

Table 16: Midwest Sales Volume ('000 Tons) Historical Data 2018 to 2022 and Forecast 2023 to 2033 By Region

Table 17: Midwest Sales Value (US$ million) Historical Data 2018 to 2022 and Forecast 2023 to 2033 By Region

Table 18: Midwest Sales Volume ('000 Tons) Historical Data 2018 to 2022 and Forecast 2023 to 2033 By Product Type

Table 19: Midwest Sales Value (US$ million) Historical Data 2018 to 2022 and Forecast 2023 to 2033 By Product Type

Table 20: Midwest Sales Volume ('000 Tons) Historical Data 2018 to 2022 and Forecast 2023 to 2033 By Material Type

Table 21: Midwest Sales Value (US$ million)) Historical Data 2018 to 2022 and Forecast 2023 to 2033 By Material Type

Table 22: Midwest Sales Value (US$ million) and Volume ('000 Tons) Historical Data 2018 to 2022 and Forecast 2023 to 2033 By Vehicle Type

Table 23: Midwest Sales Value (US$ million) and Volume ('000 Tons) Historical Data 2018 to 2022 and Forecast 2023 to 2033 By Sales Channel

Table 24: West Sales Volume ('000 Tons) Historical Data 2018 to 2022 and Forecast 2023 to 2033 By Region

Table 25: West Sales Value (US$ million) Historical Data 2018 to 2022 and Forecast 2023 to 2033 By Region

Table 26: West Sales Volume ('000 Tons) Historical Data 2018 to 2022 and Forecast 2023 to 2033 By Product Type

Table 27: West Sales Value (US$ million) Historical Data 2018 to 2022 and Forecast 2023 to 2033 By Product Type

Table 28: West Sales Volume ('000 Tons) Historical Data 2018 to 2022 and Forecast 2023 to 2033 By Material Type

Table 29: West Sales Value (US$ million) Historical Data 2018 to 2022 and Forecast 2023 to 2033 By Material Type

Table 30: West Sales Value (US$ million) and Volume ('000 Tons) Historical Data 2018 to 2022 and Forecast 2023 to 2033 By Vehicle Type

Table 31: West Sales Value (US$ million) and Volume ('000 Tons) Historical Data 2018 to 2022 and Forecast 2023 to 2033 By Sales Channel

Table 32: South Sales Volume ('000 Tons) Historical Data 2018 to 2022 and Forecast 2023 to 2033 By Region

Table 33: South Sales Value (US$ million) Historical Data 2018 to 2022 and Forecast 2023 to 2033 By Region

Table 34: South Sales Volume ('000 Tons) Historical Data 2018 to 2022 and Forecast 2023 to 2033 By Product Type

Table 35: South Sales Value (US$ million) Historical Data 2018 to 2022 and Forecast 2023 to 2033 By Product Type

Table 36: South Sales Volume ('000 Tons) Historical Data 2018 to 2022 and Forecast 2023 to 2033 By Material Type

Table 37: South Sales Value (US$ million) Historical Data 2018 to 2022 and Forecast 2023 to 2033 By Material Type

Table 38: South Sales Value (US$ million) and Volume ('000 Tons) Historical Data 2018 to 2022 and Forecast 2023 to 2033 By Vehicle Type

Table 39: South Sales Value (US$ million) and Volume ('000 Tons) Historical Data 2018 to 2022 and Forecast 2023 to 2033 By Sales Channel

List of Charts

Figure 01: Sales Historical Volume ('000 Tons), 2018 to 2022

Figure 02: Sales Current and Forecast Volume ('000 Tons), 2023 to 2033

Figure 03: Historical Sales Size (US$ million) (2018 to 2022)

Figure 04: Sales Absolute $ Opportunity Analysis (2018 to 2033)

Figure 05: Sales Size (US$ million) & YOY Growth (%) (2023 to 2033)

Figure 06: United States Automotive Lightweight Body Panels Sales Volume Y-o-Y Growth, 2018 to 2033

Figure 07: Sales Share and BPS Analysis by Product Type 2023 to 2033

Figure 08: Sales Y-o-Y Growth Projections by Product Type, 2022 to 2033

Figure 09: Sales Attractiveness by Product Type, 2023 to 2033

Figure 10: Incremental $ Opportunity By Product Type, 2023 to 2033

Figure 11: Sales Share and BPS Analysis by Material Type 2023 to 2033

Figure 12: Sales Y-o-Y Growth Projections by Material Type, 2022 to 2033

Figure 13: Sales Attractiveness by Material Type, 2023 to 2033

Figure 14: Incremental $ Opportunity By Product Type, 2023 to 2033

Figure 15: Sales Share and BPS Analysis by Vehicle Type 2023 to 2033

Figure 16: Sales Y-o-Y Growth Projections by Vehicle Type, 2022 to 2033

Figure 17: Sales Attractiveness by Vehicle Type, 2023 to 2033

Figure 18: Incremental $ Opportunity By Process, 2023 to 2033

Figure 19: Sales Share and BPS Analysis by Sales Channel 2023 to 2033

Figure 20: Sales Y-o-Y Growth Projections by Sales Channel, 2022 to 2033

Figure 21: Sales Attractiveness by Sales Channel, 2023 to 2033

Figure 22: Incremental $ Opportunity By Sales Channel, 2023 to 2033

Figure 23: Sales Share and BPS Analysis by Regions 2023 to 2033

Figure 24: Sales Y-o-Y Growth Projections by Regions, 2022 to 2033

Figure 25: Sales Attractiveness by Regions, 2023 to 2033

Figure 26: Northeast Sales Share and BPS Analysis by Region 2023 to 2033

Figure 27: Northeast Sales Y-o-Y Growth Projections by Region, 2022 to 2033

Figure 28: Northeast Sales Attractiveness by Region, 2023 to 2033

Figure 29: Northeast Sales Share and BPS Analysis by Product Type 2023 to 2033

Figure 30: Northeast Sales Y-o-Y Growth Projections by Product Type, 2022 to 2033

Figure 31: Northeast Sales Attractiveness by Product Type, 2023 to 2033

Figure 32: Northeast Sales Share and BPS Analysis by Material Type 2023 to 2033

Figure 33: Northeast Sales Y-o-Y Growth Projections by Material Type, 2022 to 2033

Figure 34: Northeast Sales Attractiveness by Material Type, 2023 to 2033

Figure 35: Northeast Sales Share and BPS Analysis by Vehicle Type 2023 to 2033

Figure 36: Northeast Sales Y-o-Y Growth Projections by Vehicle Type, 2022 to 2033

Figure 37: Northeast Sales Attractiveness by Vehicle Type, 2023 to 2033

Figure 38: Northeast Sales Share and BPS Analysis by Sales Channel 2023 to 2033

Figure 39: Northeast Sales Y-o-Y Growth Projections by Sales Channel, 2022 to 2033

Figure 40: Northeast Sales Attractiveness by Sales Channel, 2023 to 2033

Figure 41: Midwest Sales Y-o-Y Growth Projections by Vehicle Type, 2022 to 2033

Figure 42: Midwest Sales Attractiveness by Vehicle Type, 2023 to 2033

Figure 43: Midwest Sales Share and BPS Analysis by Sales Channel 2023 to 2033

Figure 44: Midwest Sales Y-o-Y Growth Projections by Sales Channel, 2022 to 2033

Figure 45: Midwest Sales Attractiveness by Sales Channel, 2023 to 2033

Figure 46: West Sales Share and BPS Analysis by Region 2023 to 2033

Figure 47: West Sales Y-o-Y Growth Projections by Region, 2022 to 2033

Figure 48: West Sales Attractiveness by Region, 2023 to 2033

Figure 49: West Sales Share and BPS Analysis by Product Type 2023 to 2033

Figure 50: West Sales Y-o-Y Growth Projections by Product Type, 2022 to 2033

Figure 51: West Sales Attractiveness by Product Type, 2023 to 2033

Figure 52: West Sales Share and BPS Analysis by Material Type 2023 to 2033

Figure 53: West Sales Y-o-Y Growth Projections by Material Type, 2022 to 2033

Figure 54: West Sales Attractiveness by Material Type, 2023 to 2033

Figure 55: West Sales Share and BPS Analysis by Vehicle Type 2023 to 2033

Figure 56: West Sales Y-o-Y Growth Projections by Vehicle Type, 2022 to 2033

Figure 57: West Sales Attractiveness by Vehicle Type, 2023 to 2033

Figure 58: West Sales Share and BPS Analysis by Sales Channel 2023 to 2033

Figure 59: West Sales Y-o-Y Growth Projections by Sales Channel, 2022 to 2033

Figure 60: West Sales Attractiveness by Sales Channel, 2023 to 2033

Figure 61: South Sales Share and BPS Analysis by Region 2023 to 2033

Figure 62: South Sales Y-o-Y Growth Projections by Region, 2022 to 2033

Figure 63: South Sales Attractiveness by Region, 2023 to 2033

Figure 64: South Sales Share and BPS Analysis by Product Type 2023 to 2033

Figure 65: South Sales Y-o-Y Growth Projections by Product Type, 2022 to 2033

Figure 66: South Sales Attractiveness by Product Type, 2023 to 2033

Figure 67: South Sales Share and BPS Analysis by Material Type 2023 to 2033

Figure 68: South Sales Y-o-Y Growth Projections by Material Type, 2022 to 2033

Figure 69: South Sales Attractiveness by Material Type, 2023 to 2033

Figure 70: South Sales Share and BPS Analysis by Vehicle Type 2023 to 2033

Figure 71: South Sales Y-o-Y Growth Projections by Vehicle Type, 2022 to 2033

Figure 72: South Sales Attractiveness by Vehicle Type, 2023 to 2033

Figure 73: South Sales Share and BPS Analysis by Sales Channel 2023 to 2033

Figure 74: South Sales Y-o-Y Growth Projections by Sales Channel, 2022 to 2033

Figure 75: South Sales Attractiveness by Sales Channel, 2023 to 2033

Recommendations

Automotive

Lightweight Automotive Body Panels Market

Published : July 2023

Automotive

Automotive Fuel Gauge Market

Published : July 2023

Automotive

Automotive Fuel Gauge Sending unit Market

Published : July 2023

Automotive

Automotive Cowl Panel Market

Published : February 2023

Explore Automotive Insights

View Reports

Industry Analysis of Automotive Lightweight Body Panel in the United States