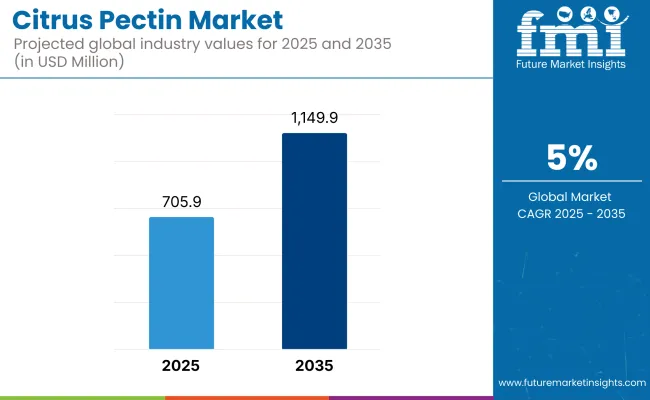
The global citrus pectin market is projected to expand from USD 705.9 million in 2025 to USD 1,149.9 million by 2035, growing consistently at a CAGR of 5% throughout the assessment period.
In 2025, the United States emerges as the most lucrative market, reflecting robust consumer preferences for natural food additives and fortified dietary supplements. Meanwhile, Asia-Pacific countries, notably China and Japan, are anticipated to exhibit the fastest growth rates between 2025 and 2035 due to rising health awareness, increasing disposable incomes, and shifting dietary patterns towards plant-based and functional ingredients.
The ongoing growth of the citrus pectin market is substantially driven by heightened consumer awareness regarding the health benefits associated with dietary fibers and the natural origins of citrus pectin. As consumers increasingly gravitate towards clean-label products, manufacturers are responding by integrating citrus pectin in diverse applications ranging from jams and confectionery to pharmaceutical and nutraceutical formulations.
Regulatory emphasis on food safety, particularly in developed markets, has further propelled adoption rates, as citrus pectin offers a natural alternative to synthetic stabilizers and emulsifiers. However, fluctuations in citrus fruit supply, price volatility, and sustainability concerns related to agricultural practices pose potential restraints on market growth.
Current trends indicate significant innovation in extraction techniques aimed at enhancing yield and purity levels, alongside strategic partnerships within the value chain to streamline sourcing and ensure traceability of raw materials.
Looking forward, the decade spanning 2025 to 2035 is likely to witness an acceleration in citrus pectin's adoption across the pharmaceutical and nutraceutical sectors. Industry forecasts anticipate novel product development focused on specialized health claims, including cardiovascular wellness, digestive health, and weight management.
Technological advancements, especially in enzymatic extraction and membrane filtration techniques, are expected to drive improvements in product quality and cost-effectiveness. Manufacturers will increasingly prioritize sustainability through eco-friendly production processes, reduced chemical usage, and responsible sourcing strategies. Consequently, the market will likely witness enhanced consumer confidence, further reinforcing demand growth and opening opportunities in previously untapped emerging markets.
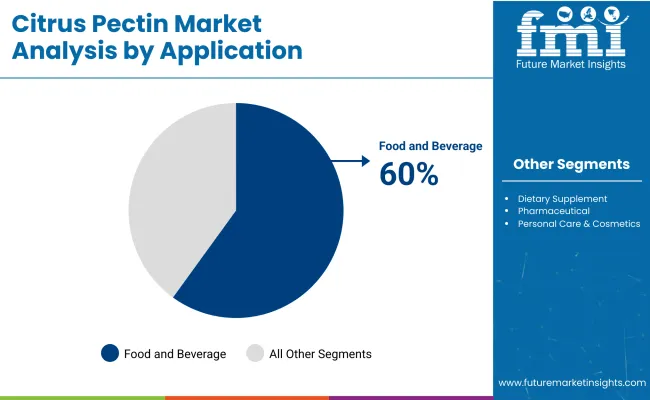
Food & beverage applications hold a dominant 60% share of the global citrus pectin market in 2025, underpinned by consistent end-use demand and growing clean-label preferences. The segment is forecast to maintain a stable trajectory through 2035, as global food processors increasingly favor natural emulsifiers, thickeners, and stabilizers over synthetic counterparts.
The versatility of citrus pectin in both acidic and low-sugar environments-especially in jams, fruit-based beverages, and dairy-alternative formats-continues to sustain its value proposition. Regulatory alignment in North America and Europe on labeling and additive safety has further reinforced industry reliance on citrus-derived hydrocolloids.
While technical challenges such as solubility and process tolerance remain, innovation in enzyme-assisted extraction and formulation science is addressing these limitations, paving the way for broader adoption across newer beverage categories and reduced-sugar reformulations.
Food manufacturers are also leveraging citrus pectin’s fiber content to support nutrition-forward positioning, particularly in gut health and satiety claims. As Asia-Pacific food processing capacities mature, demand is expected to rise rapidly in emerging economies where Western-style convenience and wellness cues are gaining traction.
Consequently, the food & beverage segment will remain strategically central-not just as the largest consumer of citrus pectin, but also as the primary driver of product standardization, functional diversification, and cost optimization initiatives.
The pharmaceutical and nutraceutical segment is projected to grow at a CAGR of 6.3% between 2025 and 2035, making it the fastest-growing application area in the global citrus pectin market. This momentum is driven by rising interest in its bioactive potential and fiber-linked health benefits.
Although currently smaller in volume compared to food applications, this segment is undergoing transformation from incidental usage to deliberate formulation design, especially in gastrointestinal, cardiovascular, and metabolic health products.
Clinical research validating citrus pectin’s role in modulating gut microbiota, improving lipid profiles, and supporting detoxification pathways has catalyzed formulation interest in functional supplements, prebiotic blends, and medical nutrition. Additionally, regulatory openness to naturally sourced excipients and carriers has expanded pectin’s role in controlled-release and chewable dosage forms.
As pharmaceutical firms seek differentiation in an increasingly competitive OTC and preventive health market, citrus pectin is being positioned as a clean-label excipient with functional benefits. Supply chain collaborations with citrus processors and extraction technology firms are enabling quality consistency and bioavailability enhancements, critical to gaining trust among formulators.
With demand expected to rise from health-conscious middle-class consumers in China, India, and Southeast Asia, this segment is anticipated to become a strategic value lever for manufacturers-offering margin expansion, portfolio diversification, and potential entry into regulated therapeutic nutrition markets.
Challenge
Supply Chain Constraints and Price Volatility
Citrus pectin market is already facing issues with supply chain disruptions and disruptions in production of citrus fruits. Because citrus pectin is derived from citrus peels, it is scarcer than apple pectin (which is driven by higher seasonal juice processing industries) and is plagued by market fluctuations, climate changes, and crop diseases like citrus greening.
Geopolitical trade restrictions and transportation costs also exacerbate price volatility. Manufacturers’ ability to two, maintain stable production is at risk, as the reliance on a limited number of citrus-producing regions increases supply risk. Long-term, to ensure market stability, companies should look into diversifying sourcing strategies, investing in extraction processes, and promising alternative sources of fruit-derived pectin.
Opportunity
Expanding Applications in Health and Functional Foods
Increasing consumer demand for natural, plant-based, and clean-label ingredients is turning citrus pectin into a popular ingredient for functional foods,beverages, and dietary supplements.Citrus pectin has a beneficial prebiotic feature and is being incorporated into gut health formulations, low-sugar jams, dairy alternatives, and plant-based meat products.
Furthermore, pharmaceutical applications are being explored, such as the use of modified citrus pectin for detoxification and immune health. This opens up room for manufacturers to improve their pectin formulations to increase solubility, bioavailability, and multifunctional properties suited for food and healthcare applications. Consumers are looking at natural options, investing in organic and non-GMO citrus pectin will complement market growth.
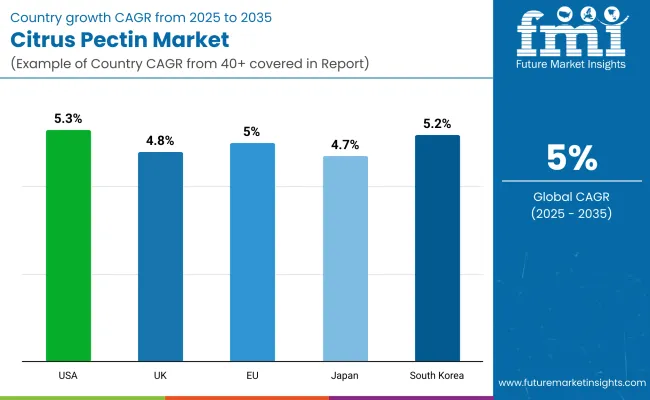
Since there is a growing demand from the food and beverage, pharmaceutical, and personal care industries, the USA citrus pectin market is stable. The frequent use of citrus pectin for the purpose of gel, thickener, and stabilizer for jams, dairy, and drinks is inducing the market growth.
The increasing acceptance of natural and clean-label ingredients in ready-to-eat foods is driving demand for citrus pectin across diverse formulations. In addition, demand is being boosted due to soaring usage of citrus pectin in the pharmaceutical industry for the preparation of drug delivery systems and cholesterol-lowering supplements.
country | CAGR (2025 to 2035) |
---|---|
USA | 5.3% |
The UK citrus pectin market is slowly increasing as there is a growing demand for natural-based plant and functional food ingredients. Market Trend: The growing trend for low sugar and sugar free food formulations is driving the demand for the usage of citrus pectin as a fat replacer and sugar substitute in bakery and confectionery applications.
Besides, in the cosmetic segment, the personal care industry is adopting more amounts of citrus pectin due to its skin-conditioning and emulsifying properties which are used in toiletries and beauty products including moisturizers, anti-aging creams, and hair care. Additionally, the increasing consumer demand for sustainable and natural additives is also driving the demand for the market.
country | CAGR (2025 to 2035) |
---|---|
UK | 4.8% |
Germany, France and Italy are leading the demand in the European lemon pectin market. However the market for lemon pectin in Europe is growing at a stable rate. With applications in jams, dairy items and fruit-based drinks, the food and refreshment industry is still the biggest shopper segment.
The rising emphasis on dietary fibers and functional ingredients is further encouraging the use of citrus pectin in health supplements and digestive health products. Also, with increasing consumption of vegan and plant-based food products is also positively influencing market growth, as it is used as a natural substitute for gelatine in diverse food applications.
country | CAGR (2025 to 2035) |
---|---|
European Union (EU) | 5.0% |
Japan’s citrus pectin market expands because it finds growing applications in functional foods together with pharmaceuticals and nutraceuticals products.The market demand for digestive supplements with prebiotic content and fiber-enriched beverages is increasing due to rising consumer preference for gut health products.
Industrial applications of citrus pectin within the pharmaceutical sector result in drug encapsulation and both cosmetic and pharmaceutical development of skincare products and anti-aging formulations. The movement toward natural biodegradable ingredients promotes manufacturers to investigate new applications of citrus pectin.
country | CAGR (2025 to 2035) |
---|---|
Japan | 4.7% |
The market for citrus pectin in South Korea continues its expansion because manufacturers seek dietary fibers and clean-label food additives simultaneously. The growth of functional beverages along with health supplements stimulates demand for citrus pectin as it appears in multiple weight management products as well as energy drinks and detox juices.
The market for cosmetics utilizes citrus pectin as they incorporate it into moisturizers while using it for both skincare and hair brand serums to block pollutants. Sustainable food processing together with eco-friendly packaging stimulates research into citrus pectin as key component of natural emulsifiers and biodegradable coatings.
country | CAGR (2025 to 2035) |
---|---|
South Korea | 5.2% |
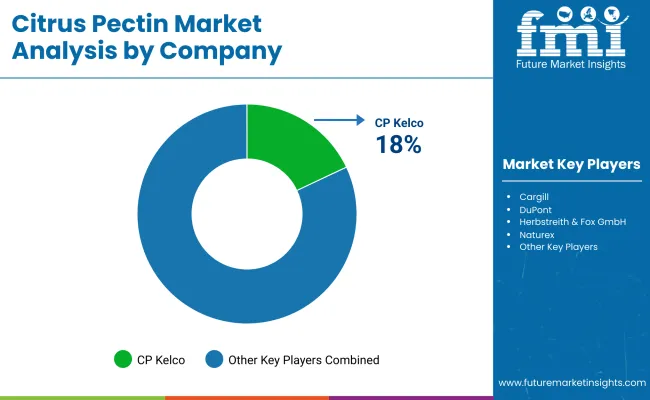
CP Kelco (J.M. Huber Corporation) (18-22%)
CP Kelco is a leading supplier of citrus pectin, offering high-performance gelling and stabilizing solutions for food and pharmaceutical applications.
Cargill, Incorporated (15-19%)
Cargill specializes in citrus pectin formulations for enhanced texture and dietary benefits, catering to food and nutraceutical industries.
DuPont (IFF) (12-16%)
DuPont (now part of IFF) focuses on citrus pectin as a natural stabilizer, with clean-label and high-functional properties for dairy, beverages, and confectionery.
Herbstreith & Fox GmbH (9-13%)
Herbstreith & Fox provides customized pectin solutions for food manufacturing, particularly for jams, fruit fillings, and plant-based alternatives.
Naturex (Givaudan) (7-11%)
Naturex offers organic and natural citrus pectin extracts, targeting the growing demand for functional food ingredients and clean-label formulations.
Other Key Players (30-40% Combined)
The market incorporates various manufacturer participation through creation of sustainable organic solutions and specialized pectin products. Notable players include:
Table 1: Global Market Value (US$ Million) Forecast by Region, 2018 to 2033
Table 2: Global Market Volume (MT) Forecast by Region, 2018 to 2033
Table 3: Global Market Value (US$ Million) Forecast by Product Type, 2018 to 2033
Table 4: Global Market Volume (MT) Forecast by Product Type, 2018 to 2033
Table 5: Global Market Value (US$ Million) Forecast by Source, 2018 to 2033
Table 6: Global Market Volume (MT) Forecast by Source, 2018 to 2033
Table 7: Global Market Value (US$ Million) Forecast by Application, 2018 to 2033
Table 8: Global Market Volume (MT) Forecast by Application, 2018 to 2033
Table 9: North America Market Value (US$ Million) Forecast by Country, 2018 to 2033
Table 10: North America Market Volume (MT) Forecast by Country, 2018 to 2033
Table 11: North America Market Value (US$ Million) Forecast by Product Type, 2018 to 2033
Table 12: North America Market Volume (MT) Forecast by Product Type, 2018 to 2033
Table 13: North America Market Value (US$ Million) Forecast by Source, 2018 to 2033
Table 14: North America Market Volume (MT) Forecast by Source, 2018 to 2033
Table 15: North America Market Value (US$ Million) Forecast by Application, 2018 to 2033
Table 16: North America Market Volume (MT) Forecast by Application, 2018 to 2033
Table 17: Latin America Market Value (US$ Million) Forecast by Country, 2018 to 2033
Table 18: Latin America Market Volume (MT) Forecast by Country, 2018 to 2033
Table 19: Latin America Market Value (US$ Million) Forecast by Product Type, 2018 to 2033
Table 20: Latin America Market Volume (MT) Forecast by Product Type, 2018 to 2033
Table 21: Latin America Market Value (US$ Million) Forecast by Source, 2018 to 2033
Table 22: Latin America Market Volume (MT) Forecast by Source, 2018 to 2033
Table 23: Latin America Market Value (US$ Million) Forecast by Application, 2018 to 2033
Table 24: Latin America Market Volume (MT) Forecast by Application, 2018 to 2033
Table 25: Western Europe Market Value (US$ Million) Forecast by Country, 2018 to 2033
Table 26: Western Europe Market Volume (MT) Forecast by Country, 2018 to 2033
Table 27: Western Europe Market Value (US$ Million) Forecast by Product Type, 2018 to 2033
Table 28: Western Europe Market Volume (MT) Forecast by Product Type, 2018 to 2033
Table 29: Western Europe Market Value (US$ Million) Forecast by Source, 2018 to 2033
Table 30: Western Europe Market Volume (MT) Forecast by Source, 2018 to 2033
Table 31: Western Europe Market Value (US$ Million) Forecast by Application, 2018 to 2033
Table 32: Western Europe Market Volume (MT) Forecast by Application, 2018 to 2033
Table 33: Eastern Europe Market Value (US$ Million) Forecast by Country, 2018 to 2033
Table 34: Eastern Europe Market Volume (MT) Forecast by Country, 2018 to 2033
Table 35: Eastern Europe Market Value (US$ Million) Forecast by Product Type, 2018 to 2033
Table 36: Eastern Europe Market Volume (MT) Forecast by Product Type, 2018 to 2033
Table 37: Eastern Europe Market Value (US$ Million) Forecast by Source, 2018 to 2033
Table 38: Eastern Europe Market Volume (MT) Forecast by Source, 2018 to 2033
Table 39: Eastern Europe Market Value (US$ Million) Forecast by Application, 2018 to 2033
Table 40: Eastern Europe Market Volume (MT) Forecast by Application, 2018 to 2033
Table 41: South Asia and Pacific Market Value (US$ Million) Forecast by Country, 2018 to 2033
Table 42: South Asia and Pacific Market Volume (MT) Forecast by Country, 2018 to 2033
Table 43: South Asia and Pacific Market Value (US$ Million) Forecast by Product Type, 2018 to 2033
Table 44: South Asia and Pacific Market Volume (MT) Forecast by Product Type, 2018 to 2033
Table 45: South Asia and Pacific Market Value (US$ Million) Forecast by Source, 2018 to 2033
Table 46: South Asia and Pacific Market Volume (MT) Forecast by Source, 2018 to 2033
Table 47: South Asia and Pacific Market Value (US$ Million) Forecast by Application, 2018 to 2033
Table 48: South Asia and Pacific Market Volume (MT) Forecast by Application, 2018 to 2033
Table 49: East Asia Market Value (US$ Million) Forecast by Country, 2018 to 2033
Table 50: East Asia Market Volume (MT) Forecast by Country, 2018 to 2033
Table 51: East Asia Market Value (US$ Million) Forecast by Product Type, 2018 to 2033
Table 52: East Asia Market Volume (MT) Forecast by Product Type, 2018 to 2033
Table 53: East Asia Market Value (US$ Million) Forecast by Source, 2018 to 2033
Table 54: East Asia Market Volume (MT) Forecast by Source, 2018 to 2033
Table 55: East Asia Market Value (US$ Million) Forecast by Application, 2018 to 2033
Table 56: East Asia Market Volume (MT) Forecast by Application, 2018 to 2033
Table 57: Middle East and Africa Market Value (US$ Million) Forecast by Country, 2018 to 2033
Table 58: Middle East and Africa Market Volume (MT) Forecast by Country, 2018 to 2033
Table 59: Middle East and Africa Market Value (US$ Million) Forecast by Product Type, 2018 to 2033
Table 60: Middle East and Africa Market Volume (MT) Forecast by Product Type, 2018 to 2033
Table 61: Middle East and Africa Market Value (US$ Million) Forecast by Source, 2018 to 2033
Table 62: Middle East and Africa Market Volume (MT) Forecast by Source, 2018 to 2033
Table 63: Middle East and Africa Market Value (US$ Million) Forecast by Application, 2018 to 2033
Table 64: Middle East and Africa Market Volume (MT) Forecast by Application, 2018 to 2033
Figure 1: Global Market Value (US$ Million) by Product Type, 2023 to 2033
Figure 2: Global Market Value (US$ Million) by Source, 2023 to 2033
Figure 3: Global Market Value (US$ Million) by Application, 2023 to 2033
Figure 4: Global Market Value (US$ Million) by Region, 2023 to 2033
Figure 5: Global Market Value (US$ Million) Analysis by Region, 2018 to 2033
Figure 6: Global Market Volume (MT) Analysis by Region, 2018 to 2033
Figure 7: Global Market Value Share (%) and BPS Analysis by Region, 2023 to 2033
Figure 8: Global Market Y-o-Y Growth (%) Projections by Region, 2023 to 2033
Figure 9: Global Market Value (US$ Million) Analysis by Product Type, 2018 to 2033
Figure 10: Global Market Volume (MT) Analysis by Product Type, 2018 to 2033
Figure 11: Global Market Value Share (%) and BPS Analysis by Product Type, 2023 to 2033
Figure 12: Global Market Y-o-Y Growth (%) Projections by Product Type, 2023 to 2033
Figure 13: Global Market Value (US$ Million) Analysis by Source, 2018 to 2033
Figure 14: Global Market Volume (MT) Analysis by Source, 2018 to 2033
Figure 15: Global Market Value Share (%) and BPS Analysis by Source, 2023 to 2033
Figure 16: Global Market Y-o-Y Growth (%) Projections by Source, 2023 to 2033
Figure 17: Global Market Value (US$ Million) Analysis by Application, 2018 to 2033
Figure 18: Global Market Volume (MT) Analysis by Application, 2018 to 2033
Figure 19: Global Market Value Share (%) and BPS Analysis by Application, 2023 to 2033
Figure 20: Global Market Y-o-Y Growth (%) Projections by Application, 2023 to 2033
Figure 21: Global Market Attractiveness by Product Type, 2023 to 2033
Figure 22: Global Market Attractiveness by Source, 2023 to 2033
Figure 23: Global Market Attractiveness by Application, 2023 to 2033
Figure 24: Global Market Attractiveness by Region, 2023 to 2033
Figure 25: North America Market Value (US$ Million) by Product Type, 2023 to 2033
Figure 26: North America Market Value (US$ Million) by Source, 2023 to 2033
Figure 27: North America Market Value (US$ Million) by Application, 2023 to 2033
Figure 28: North America Market Value (US$ Million) by Country, 2023 to 2033
Figure 29: North America Market Value (US$ Million) Analysis by Country, 2018 to 2033
Figure 30: North America Market Volume (MT) Analysis by Country, 2018 to 2033
Figure 31: North America Market Value Share (%) and BPS Analysis by Country, 2023 to 2033
Figure 32: North America Market Y-o-Y Growth (%) Projections by Country, 2023 to 2033
Figure 33: North America Market Value (US$ Million) Analysis by Product Type, 2018 to 2033
Figure 34: North America Market Volume (MT) Analysis by Product Type, 2018 to 2033
Figure 35: North America Market Value Share (%) and BPS Analysis by Product Type, 2023 to 2033
Figure 36: North America Market Y-o-Y Growth (%) Projections by Product Type, 2023 to 2033
Figure 37: North America Market Value (US$ Million) Analysis by Source, 2018 to 2033
Figure 38: North America Market Volume (MT) Analysis by Source, 2018 to 2033
Figure 39: North America Market Value Share (%) and BPS Analysis by Source, 2023 to 2033
Figure 40: North America Market Y-o-Y Growth (%) Projections by Source, 2023 to 2033
Figure 41: North America Market Value (US$ Million) Analysis by Application, 2018 to 2033
Figure 42: North America Market Volume (MT) Analysis by Application, 2018 to 2033
Figure 43: North America Market Value Share (%) and BPS Analysis by Application, 2023 to 2033
Figure 44: North America Market Y-o-Y Growth (%) Projections by Application, 2023 to 2033
Figure 45: North America Market Attractiveness by Product Type, 2023 to 2033
Figure 46: North America Market Attractiveness by Source, 2023 to 2033
Figure 47: North America Market Attractiveness by Application, 2023 to 2033
Figure 48: North America Market Attractiveness by Country, 2023 to 2033
Figure 49: Latin America Market Value (US$ Million) by Product Type, 2023 to 2033
Figure 50: Latin America Market Value (US$ Million) by Source, 2023 to 2033
Figure 51: Latin America Market Value (US$ Million) by Application, 2023 to 2033
Figure 52: Latin America Market Value (US$ Million) by Country, 2023 to 2033
Figure 53: Latin America Market Value (US$ Million) Analysis by Country, 2018 to 2033
Figure 54: Latin America Market Volume (MT) Analysis by Country, 2018 to 2033
Figure 55: Latin America Market Value Share (%) and BPS Analysis by Country, 2023 to 2033
Figure 56: Latin America Market Y-o-Y Growth (%) Projections by Country, 2023 to 2033
Figure 57: Latin America Market Value (US$ Million) Analysis by Product Type, 2018 to 2033
Figure 58: Latin America Market Volume (MT) Analysis by Product Type, 2018 to 2033
Figure 59: Latin America Market Value Share (%) and BPS Analysis by Product Type, 2023 to 2033
Figure 60: Latin America Market Y-o-Y Growth (%) Projections by Product Type, 2023 to 2033
Figure 61: Latin America Market Value (US$ Million) Analysis by Source, 2018 to 2033
Figure 62: Latin America Market Volume (MT) Analysis by Source, 2018 to 2033
Figure 63: Latin America Market Value Share (%) and BPS Analysis by Source, 2023 to 2033
Figure 64: Latin America Market Y-o-Y Growth (%) Projections by Source, 2023 to 2033
Figure 65: Latin America Market Value (US$ Million) Analysis by Application, 2018 to 2033
Figure 66: Latin America Market Volume (MT) Analysis by Application, 2018 to 2033
Figure 67: Latin America Market Value Share (%) and BPS Analysis by Application, 2023 to 2033
Figure 68: Latin America Market Y-o-Y Growth (%) Projections by Application, 2023 to 2033
Figure 69: Latin America Market Attractiveness by Product Type, 2023 to 2033
Figure 70: Latin America Market Attractiveness by Source, 2023 to 2033
Figure 71: Latin America Market Attractiveness by Application, 2023 to 2033
Figure 72: Latin America Market Attractiveness by Country, 2023 to 2033
Figure 73: Western Europe Market Value (US$ Million) by Product Type, 2023 to 2033
Figure 74: Western Europe Market Value (US$ Million) by Source, 2023 to 2033
Figure 75: Western Europe Market Value (US$ Million) by Application, 2023 to 2033
Figure 76: Western Europe Market Value (US$ Million) by Country, 2023 to 2033
Figure 77: Western Europe Market Value (US$ Million) Analysis by Country, 2018 to 2033
Figure 78: Western Europe Market Volume (MT) Analysis by Country, 2018 to 2033
Figure 79: Western Europe Market Value Share (%) and BPS Analysis by Country, 2023 to 2033
Figure 80: Western Europe Market Y-o-Y Growth (%) Projections by Country, 2023 to 2033
Figure 81: Western Europe Market Value (US$ Million) Analysis by Product Type, 2018 to 2033
Figure 82: Western Europe Market Volume (MT) Analysis by Product Type, 2018 to 2033
Figure 83: Western Europe Market Value Share (%) and BPS Analysis by Product Type, 2023 to 2033
Figure 84: Western Europe Market Y-o-Y Growth (%) Projections by Product Type, 2023 to 2033
Figure 85: Western Europe Market Value (US$ Million) Analysis by Source, 2018 to 2033
Figure 86: Western Europe Market Volume (MT) Analysis by Source, 2018 to 2033
Figure 87: Western Europe Market Value Share (%) and BPS Analysis by Source, 2023 to 2033
Figure 88: Western Europe Market Y-o-Y Growth (%) Projections by Source, 2023 to 2033
Figure 89: Western Europe Market Value (US$ Million) Analysis by Application, 2018 to 2033
Figure 90: Western Europe Market Volume (MT) Analysis by Application, 2018 to 2033
Figure 91: Western Europe Market Value Share (%) and BPS Analysis by Application, 2023 to 2033
Figure 92: Western Europe Market Y-o-Y Growth (%) Projections by Application, 2023 to 2033
Figure 93: Western Europe Market Attractiveness by Product Type, 2023 to 2033
Figure 94: Western Europe Market Attractiveness by Source, 2023 to 2033
Figure 95: Western Europe Market Attractiveness by Application, 2023 to 2033
Figure 96: Western Europe Market Attractiveness by Country, 2023 to 2033
Figure 97: Eastern Europe Market Value (US$ Million) by Product Type, 2023 to 2033
Figure 98: Eastern Europe Market Value (US$ Million) by Source, 2023 to 2033
Figure 99: Eastern Europe Market Value (US$ Million) by Application, 2023 to 2033
Figure 100: Eastern Europe Market Value (US$ Million) by Country, 2023 to 2033
Figure 101: Eastern Europe Market Value (US$ Million) Analysis by Country, 2018 to 2033
Figure 102: Eastern Europe Market Volume (MT) Analysis by Country, 2018 to 2033
Figure 103: Eastern Europe Market Value Share (%) and BPS Analysis by Country, 2023 to 2033
Figure 104: Eastern Europe Market Y-o-Y Growth (%) Projections by Country, 2023 to 2033
Figure 105: Eastern Europe Market Value (US$ Million) Analysis by Product Type, 2018 to 2033
Figure 106: Eastern Europe Market Volume (MT) Analysis by Product Type, 2018 to 2033
Figure 107: Eastern Europe Market Value Share (%) and BPS Analysis by Product Type, 2023 to 2033
Figure 108: Eastern Europe Market Y-o-Y Growth (%) Projections by Product Type, 2023 to 2033
Figure 109: Eastern Europe Market Value (US$ Million) Analysis by Source, 2018 to 2033
Figure 110: Eastern Europe Market Volume (MT) Analysis by Source, 2018 to 2033
Figure 111: Eastern Europe Market Value Share (%) and BPS Analysis by Source, 2023 to 2033
Figure 112: Eastern Europe Market Y-o-Y Growth (%) Projections by Source, 2023 to 2033
Figure 113: Eastern Europe Market Value (US$ Million) Analysis by Application, 2018 to 2033
Figure 114: Eastern Europe Market Volume (MT) Analysis by Application, 2018 to 2033
Figure 115: Eastern Europe Market Value Share (%) and BPS Analysis by Application, 2023 to 2033
Figure 116: Eastern Europe Market Y-o-Y Growth (%) Projections by Application, 2023 to 2033
Figure 117: Eastern Europe Market Attractiveness by Product Type, 2023 to 2033
Figure 118: Eastern Europe Market Attractiveness by Source, 2023 to 2033
Figure 119: Eastern Europe Market Attractiveness by Application, 2023 to 2033
Figure 120: Eastern Europe Market Attractiveness by Country, 2023 to 2033
Figure 121: South Asia and Pacific Market Value (US$ Million) by Product Type, 2023 to 2033
Figure 122: South Asia and Pacific Market Value (US$ Million) by Source, 2023 to 2033
Figure 123: South Asia and Pacific Market Value (US$ Million) by Application, 2023 to 2033
Figure 124: South Asia and Pacific Market Value (US$ Million) by Country, 2023 to 2033
Figure 125: South Asia and Pacific Market Value (US$ Million) Analysis by Country, 2018 to 2033
Figure 126: South Asia and Pacific Market Volume (MT) Analysis by Country, 2018 to 2033
Figure 127: South Asia and Pacific Market Value Share (%) and BPS Analysis by Country, 2023 to 2033
Figure 128: South Asia and Pacific Market Y-o-Y Growth (%) Projections by Country, 2023 to 2033
Figure 129: South Asia and Pacific Market Value (US$ Million) Analysis by Product Type, 2018 to 2033
Figure 130: South Asia and Pacific Market Volume (MT) Analysis by Product Type, 2018 to 2033
Figure 131: South Asia and Pacific Market Value Share (%) and BPS Analysis by Product Type, 2023 to 2033
Figure 132: South Asia and Pacific Market Y-o-Y Growth (%) Projections by Product Type, 2023 to 2033
Figure 133: South Asia and Pacific Market Value (US$ Million) Analysis by Source, 2018 to 2033
Figure 134: South Asia and Pacific Market Volume (MT) Analysis by Source, 2018 to 2033
Figure 135: South Asia and Pacific Market Value Share (%) and BPS Analysis by Source, 2023 to 2033
Figure 136: South Asia and Pacific Market Y-o-Y Growth (%) Projections by Source, 2023 to 2033
Figure 137: South Asia and Pacific Market Value (US$ Million) Analysis by Application, 2018 to 2033
Figure 138: South Asia and Pacific Market Volume (MT) Analysis by Application, 2018 to 2033
Figure 139: South Asia and Pacific Market Value Share (%) and BPS Analysis by Application, 2023 to 2033
Figure 140: South Asia and Pacific Market Y-o-Y Growth (%) Projections by Application, 2023 to 2033
Figure 141: South Asia and Pacific Market Attractiveness by Product Type, 2023 to 2033
Figure 142: South Asia and Pacific Market Attractiveness by Source, 2023 to 2033
Figure 143: South Asia and Pacific Market Attractiveness by Application, 2023 to 2033
Figure 144: South Asia and Pacific Market Attractiveness by Country, 2023 to 2033
Figure 145: East Asia Market Value (US$ Million) by Product Type, 2023 to 2033
Figure 146: East Asia Market Value (US$ Million) by Source, 2023 to 2033
Figure 147: East Asia Market Value (US$ Million) by Application, 2023 to 2033
Figure 148: East Asia Market Value (US$ Million) by Country, 2023 to 2033
Figure 149: East Asia Market Value (US$ Million) Analysis by Country, 2018 to 2033
Figure 150: East Asia Market Volume (MT) Analysis by Country, 2018 to 2033
Figure 151: East Asia Market Value Share (%) and BPS Analysis by Country, 2023 to 2033
Figure 152: East Asia Market Y-o-Y Growth (%) Projections by Country, 2023 to 2033
Figure 153: East Asia Market Value (US$ Million) Analysis by Product Type, 2018 to 2033
Figure 154: East Asia Market Volume (MT) Analysis by Product Type, 2018 to 2033
Figure 155: East Asia Market Value Share (%) and BPS Analysis by Product Type, 2023 to 2033
Figure 156: East Asia Market Y-o-Y Growth (%) Projections by Product Type, 2023 to 2033
Figure 157: East Asia Market Value (US$ Million) Analysis by Source, 2018 to 2033
Figure 158: East Asia Market Volume (MT) Analysis by Source, 2018 to 2033
Figure 159: East Asia Market Value Share (%) and BPS Analysis by Source, 2023 to 2033
Figure 160: East Asia Market Y-o-Y Growth (%) Projections by Source, 2023 to 2033
Figure 161: East Asia Market Value (US$ Million) Analysis by Application, 2018 to 2033
Figure 162: East Asia Market Volume (MT) Analysis by Application, 2018 to 2033
Figure 163: East Asia Market Value Share (%) and BPS Analysis by Application, 2023 to 2033
Figure 164: East Asia Market Y-o-Y Growth (%) Projections by Application, 2023 to 2033
Figure 165: East Asia Market Attractiveness by Product Type, 2023 to 2033
Figure 166: East Asia Market Attractiveness by Source, 2023 to 2033
Figure 167: East Asia Market Attractiveness by Application, 2023 to 2033
Figure 168: East Asia Market Attractiveness by Country, 2023 to 2033
Figure 169: Middle East and Africa Market Value (US$ Million) by Product Type, 2023 to 2033
Figure 170: Middle East and Africa Market Value (US$ Million) by Source, 2023 to 2033
Figure 171: Middle East and Africa Market Value (US$ Million) by Application, 2023 to 2033
Figure 172: Middle East and Africa Market Value (US$ Million) by Country, 2023 to 2033
Figure 173: Middle East and Africa Market Value (US$ Million) Analysis by Country, 2018 to 2033
Figure 174: Middle East and Africa Market Volume (MT) Analysis by Country, 2018 to 2033
Figure 175: Middle East and Africa Market Value Share (%) and BPS Analysis by Country, 2023 to 2033
Figure 176: Middle East and Africa Market Y-o-Y Growth (%) Projections by Country, 2023 to 2033
Figure 177: Middle East and Africa Market Value (US$ Million) Analysis by Product Type, 2018 to 2033
Figure 178: Middle East and Africa Market Volume (MT) Analysis by Product Type, 2018 to 2033
Figure 179: Middle East and Africa Market Value Share (%) and BPS Analysis by Product Type, 2023 to 2033
Figure 180: Middle East and Africa Market Y-o-Y Growth (%) Projections by Product Type, 2023 to 2033
Figure 181: Middle East and Africa Market Value (US$ Million) Analysis by Source, 2018 to 2033
Figure 182: Middle East and Africa Market Volume (MT) Analysis by Source, 2018 to 2033
Figure 183: Middle East and Africa Market Value Share (%) and BPS Analysis by Source, 2023 to 2033
Figure 184: Middle East and Africa Market Y-o-Y Growth (%) Projections by Source, 2023 to 2033
Figure 185: Middle East and Africa Market Value (US$ Million) Analysis by Application, 2018 to 2033
Figure 186: Middle East and Africa Market Volume (MT) Analysis by Application, 2018 to 2033
Figure 187: Middle East and Africa Market Value Share (%) and BPS Analysis by Application, 2023 to 2033
Figure 188: Middle East and Africa Market Y-o-Y Growth (%) Projections by Application, 2023 to 2033
Figure 189: Middle East and Africa Market Attractiveness by Product Type, 2023 to 2033
Figure 190: Middle East and Africa Market Attractiveness by Source, 2023 to 2033
Figure 191: Middle East and Africa Market Attractiveness by Application, 2023 to 2033
Figure 192: Middle East and Africa Market Attractiveness by Country, 2023 to 2033
The overall market size for Citrus Pectin Market was USD 705.9 Million in 2025.
The Citrus Pectin Market is expected to reach USD 1,149.9 Million in 2035.
The demand for the citrus pectin market will grow due to increasing applications in food and beverage as a natural gelling agent, rising demand for clean-label and plant-based ingredients, expanding use in pharmaceuticals and cosmetics, and growing consumer preference for functional and dietary fiber-rich products.
The top 5 countries which drives the development of Citrus Pectin Market are USA, UK, Europe Union, Japan and South Korea.
On the basis of Oranges and Dairy Products & Frozen Desserts Form to command significant share over the forecast period.
Explore Similar Insights
Thank you!
You will receive an email from our Business Development Manager. Please be sure to check your SPAM/JUNK folder too.