Reports

- Global Locations -

Headquarters

Future Market Insights, Inc.

Christiana Corporate, 200
Continental Drive, Suite 401,
Newark, Delaware - 19713,
United States

T: +1-845-579-5705

Americas

Future Market Insights, Inc.

616 Corporate Way, Suite 2-9018,
Valley Cottage, NY 10989, United States

T: +1-347-918-3531

MEA

Future Market Insights

1602-6 Jumeirah Bay X2 Tower, Plot No: JLT-PH2-X2A,
Jumeirah Lakes Towers, Dubai,
United Arab Emirates

Europe

Future Market Insights

3rd Floor, 207 Regent Street,
W1B 3HH London
United Kingdom

T: + 44 (0) 20 8123 9659
D: +44 (0) 20 3287 4268

Asia Pacific

Future Market Insights

Office No. 401-A, 4th Floor,
VANTAGE 9, S.No. 36/1/1,
Baner, Pune 411045, India

Citrus Oils Market Outlook (2022 to 2032)

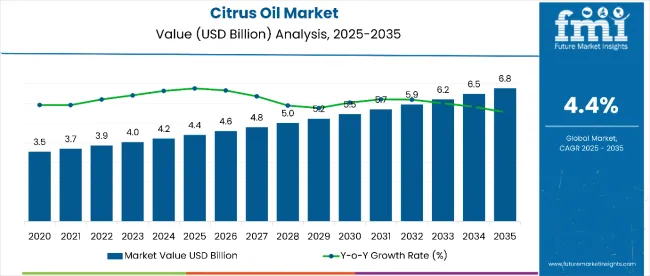
The citrus oils market is estimated to be valued at US$ 3.9 Billion in 2022. As per Future Market Insights (FMI), the overall market value is expected to reach a valuation of US$ 5.8 Billion by 2032, rising at a CAGR of 4% from 2022 to 2032. This growth can be attributed to the following factors:

  • Increasing need for natural goods to improve the nutritional content of foods and beverages
  • The product is used in a variety of diverse fields, including personal care, cosmetics, healthcare, and homecare
  • Citrus oils, which are high in limonene, a monoterpene with potent antifungal and antibacterial properties have become a crucial alternative to synthetic natural preservatives.
Attribute Details
Market Size Value in 2021 USD 3.8 Billion
Market Forecast Value in 2032 USD 5.8 Billion
Global Growth Rate 4%
Forecast Period 2022 to 2032

Increased usage of Citrus Oils in the Food and Beverage Industry

In 2021, foods and beverages accounted for a considerable portion of the market. Tea, smoothies, bottled water, and baked goods like muffins and cookies can all benefit from the invigorating and delicious flavor that citrus oils can offer. Citrus oils are often used to flavor other items, such as yogurt and dips. This element is anticipated to fuel the segment's expansion in the ensuing years.

Food producers have chosen citrus oil as a prime alternative for food preservation in response to customers' rising awareness of food quality, ingredient origin, safety, and traceability. Citrus oil's use in the food sector has grown over the past few years as a result of its useful qualities and endorsement by the Food and Drug Association (FDA).

Citrus oil's use in the food sector has grown over the past few years as a result of its useful qualities and endorsement by the Food and Drug Association (FDA). Additionally, because citrus oil is generally accepted as safe (GRAS), the food sector has indicated a strong interest in using the product for a variety of purposes.

Don't pay for what you don't need

Customize your report by selecting specific countries or regions and save 30%!

Orange Oil is becoming Popular for its Benefits

In 2021, the orange oil category had the biggest market share, with over 31%. It is projected that the increase in demand for skincare and cosmetics used for healthy skin would favor the segment's growth. Orange oil is the best component for skin and hair care because of its antibacterial and anti-inflammatory characteristics. According to research, using these items often improves collagen formation, vitamin C absorption, and blood circulation - all of which are crucial for delaying the onset of aging symptoms. Additionally, these goods aid to strengthen the health of the nails, skin, and hair. Growing consumer knowledge of these benefits is anticipated to be positive for category growth.

Citrus Oils Market

Europe to be the Dominant Market for Citrus Oils

As a result of rising consumer demand and awareness for natural cosmetics, beauty goods, and medications, Europe held the greatest market share in 2021, accounting for 42% of global sales. In terms of product consumption, it is projected that Germany will continue to be the largest market, followed by the United Kingdom

In recent years, the use of citrus oil throughout the food business has significantly increased in Europe. Citrus oils are becoming more and more in demand as a result of the booming food industries in countries like Germany, France, and Spain. The increased consumer knowledge of the advantages of utilizing citrus oils, such as their ability to lower blood pressure, regulate mood, and relieve stress, to name a few, is another factor impacting market expansion in the area.

This growth is primarily attributed to the rising adoption of citrus oils in the food and beverage industry not just as a flavoring and fragrance agent but also as a preservative. Moreover, the product finds its application in other industries as well ranging from cosmetics, personal care, home care, and healthcare.

Even though citrus oils account for a 20% share of the overall organic oils market, it is still in its introductory stage as there is limited awareness about the benefits of the product globally.

Nandini Roy Choudhury

Principal Consultant

Talk to Analyst

Find your sweet spots for generating winning opportunities in this market.

How The Market Progressed Till June 2022?

Particulars Details
H1 2021 4.0%
H1 2022 Projected 4.0%
H1 2022 Expected 4.4%
BPS Change - 44 ↓

FMI provides an evaluation and comparison of the market growth rates and future development possibilities on a half-yearly basis for the global market. The expansion of the global citrus oil market is anticipated to be aided by the growing demands for plant extracts and natural foods in food & beverage products to also be utilized as flavorings, colorants, and other additives.

Citrus oil market expansion is anticipated to be aided in the future years by rising consumer awareness of citrus oil as a useful food ingredient. There have been a number of recent changes in this market.

  • A renowned European supplier of natural citrus flavor components, the Ziegler Group, will be acquired by Archer Daniels Midland Company, according to a statement.
  • The first vegan lip balm collection produced from recycled fruit extracts was introduced by FRUU Cosmetics. Mango butter, avocado cold-pressed oil, watermelon seed oil, and lemon seed oil are just a few of the moisturizing recycled fruit-based components used in the new delectable vegan Fruitilicious lip balms.
  • Bacterial Asian Citrus Psyllid is a disease that prevents nutrients from getting from the roots of the tree. Citrus greening and other illnesses are the results, and they have a direct effect on the size, character, and yield of the fruit. Manufacturers of citrus flavors are seeing a decline in supply and a lack of citrus fruits as a result of these diseases.

The global market for Citrus Oils is expected to rise by 4.0% in the first half of 2021. However, the distribution of this increase is not equal across all geographical areas. The expected growth rate of the market is around 4.4%. Consequently, during H1 2022, there will be a -44 BPS point difference between expected and projected growth.

Over the forecast period, rising demand for plant-based extracts in products including food and drink, cosmetics, and medicines is anticipated to drive market expansion. Rising consumer awareness of the advantages of plant-based goods is also predicted to have a beneficial impact on demand in the second half of the forecast period.

Despite these promising predictions, the market expansion for citrus oil is anticipated to be constrained by growing pesticide and fertilizer usage on farms to increase production output. Additionally, the use of pesticides is not just limited to farming; while shipping, chemicals are frequently sprayed on fruits to extend their shelf lives and prevent spoiling.

Because synthetic chemicals are bad for people's health, this aspect is predicted to diminish the demand for citrus oil and slow the market's expansion for the product.

2017 to 2021 Citrus Oils Market Outlook in Comparison to 2022 to 2032 Growth Forecast

Historically, the use of synthetic antimicrobials and preservatives was prevalent among F&B companies to prevent spoilage and allow longer shelf-life of products to keep up with the modern-day trade practices that involve time-intensive transportation of products across borders and oceans.

However, recent discoveries showed the high risk of chronic disease from a number of commonly-used synthetic preservatives which resulted in a persisting challenge for the industry.

For instance, butylated hydroxytoluene (BHT) and butylated hydroxyanisole (BHA) have been found to cause the risk of lung inflammation and cancer, which are used to reduce oxidation and block the growth of bacteria on food items.

This induced a paradigm shift in consumer preference toward food & beverage products based on natural ingredients and preservatives in recent years.

Citrus oils emerged as a key solution to replace synthetic food preservatives, owing to their rich limonene content, a monoterpene that exhibits strong antibacterial and antifungal properties.

This resulted in the adoption of citrus oils due to their potential application in biodegradable food packaging solutions, and in gelatin or chitosan for improving the physicochemical properties of packaging.

Get the data you need at a Fraction of the cost

Personalize your report by choosing insights you need
and save 40%!

Country-wise Analysis

Demand Scenario of Citrus Oils in France

The adoption of citrus oil in the food industry has witnessed significant growth in Europe in recent years. The flourishing food industry in nations including, France, Germany, and Spain has resulted in the growing demand for citrus oils. Another factor influencing the market growth in the region is the growing awareness among consumers regarding the benefits of using citrus oils such as reducing blood pressure, stabilizing mood, and stress relief to mention a few.

As a result, flavor manufacturers in France are gradually shifting towards producing citrus oil from natural ingredients like peels, pulps, and leaves of oranges, limes, and lemons. In addition, the ‘clean label’ movement has picked up significant momentum in the country which in turn, has increased the demand for citrus oil in recent years.

Market Scenario of Citrus Oils in India

Demand for citrus oils is directly related to the demand for end-products and the awareness of the functional properties of the respective oil. Apart from the notion of flavor and fragrance, the therapeutic and antioxidant properties of citrus oils are not well known in several emerging countries like India. This low awareness is limiting the market from reaching its full potential in South Asia.

The other important aspect of product awareness is the limited access to the respective product and market in the country. Retail outlets also serve the purpose of familiarizing consumers with citrus oil products, as the fragmented nature of the market limits the marketing capabilities of manufacturers in India.

Since much of the retail infrastructure in the country is limited to urban areas, a large part of the consumer base is relatively unaware of the various products currently available in the market.

Category-wise Insights

Significant Demand from Aromatherapy to Boost Global Citrus Oils Market

In the current scenario, the aromatherapy sector as well as the essential oils market are at a nascent stage. However, both verticals are gaining a significant amount of popularity worldwide, owing to evolving consumer trends and growing awareness among consumers. Further, essential oils such as citrus oils have proven their capabilities in enhancing physical, spiritual, and mental health among patients in several cultures.

In recent years, citrus oils are gradually finding applications in aromatherapy albeit their adoption remains slow-paced. With strategic planning, promotion, and awareness programs, market players operating in the citrus oil market are likely to establish a strong foothold in the market. Further, with the consistent surge in demand for essential oils for relaxation therapies, manufacturers are tuning their market entry and expansion strategies accordingly.

This has further escalated the popularity of citrus oils as an effective alternative for treating chronic diseases devoid of damage to healthy tissues or cells of the body.

As the awareness about the multi-pronged benefits of aromatherapy rises among the masses, the demand for citrus oils will witness a notable increase in parallel.

Increased Application of Citrus Oils in the Food & Beverage Industry

In the last couple of decades, consumer trends and preferences have played an imperative role in the development of multiple industries including, food & beverage, cosmetics & fragrance, home products, and more. In sequence with the evolving consumer landscape, citrus oils have garnered a significant amount of popularity in recent years, especially in the food and beverage industry.

Citrus oils are primarily used to enhance the flavor and aroma of food products including, beverages, and bakery & confectionary items, among others. Furthermore, apart from picking up momentum as a flavor enhancer, citrus oils are gaining popularity for their functional properties. In recent years, the demand for fortified and value-added food has surged which has positively impacted the demand for citrus oils.

In response to the growing awareness among consumers over food safety, quality, ingredient sourcing, and traceability, food manufacturers have identified citrus oil as food preservation as an ideal candidate. The adoption of citrus oil in the food industry has increased in the last few years owing to its functional properties and acceptance by the Food and Drug Association (FDA). Further, as citrus oil is Generally Recognized as Safe (GRAS), the food industry expressed significant interest to use the product for an array of applications.

Competition Landscape: Top Citrus Oils Companies

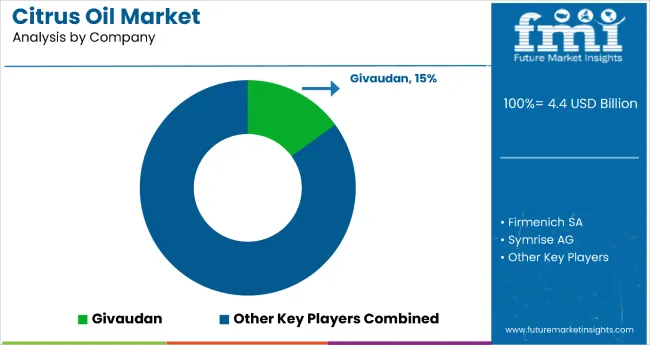
Some of the key players in the citrus oils market include Phoenix Aromas & Essential Oils, Ultra-International B.V., LLC, Firmenich SA, Citrus Oleo, Givaudan, Symrise AG, Lionel Hitchen (Essential Oils) Ltd, Citrus and Allied Essences Ltd., Bontoux S.A.S., Mountain Rose Herbs, Inc., doTERRA International, LLC, Citromax S.A.C.I., Young Living Essential Oils LC, Citrosuco among others.

Rising demand for citrus oils among consumers due to their beneficial properties has convinced manufacturers to sign long-term agreements with food & beverage and cosmetic & personal care companies to capture a wider customer base and subsequently expand their market share. Moreover, key players are focusing on inorganic strategies like partnerships and acquisitions to diversify their product portfolio and subsequently better serve the growing demand for citrus oils globally.

For instance:

  • In March 2019, Archer Daniels Midland Company (ADM) acquired a European citrus oil manufacturer, Ziegler Group in an attempt to expand its citrus oil offerings in the market.

Scope of Report

Attribute Details
Market Size Value in 2021 USD 3.8 Billion
Market Forecast Value in 2032 USD 5.8 Billion
Global Growth Rate 4%
Forecast Period 2022 to 2032
Historical Data Available for 2017 to 2021
Market Analysis Tons for Volume and USD Billion for Value
Key Regions Covered North America, Latin America, Europe, East Asia, South Asia, Oceania, and Middle East and Africa(MEA)
Key Countries Covered USA, Canada, Brazil, Mexico, Germany, United Kingdom, France, Italy, Spain, Nordic, Russia, Poland, China, India, Thailand, Indonesia, Australia and New Zealand, Japan, GCC countries, North Africa, South Africa, and others.
Key Market Segments Covered Source, Extraction Method, Fold Type, Grade Type, End-Use Industry, Sales Channel, and Regions
Key Companies Profiled
  • Ultra-International B.V.
  • Phoenix Aromas & Essential Oils, LLC
  • Firmenich SA
  • Givaudan
  • Symrise AG
  • Citrus Oleo
  • Lionel Hitchen (Essential Oils) Ltd
  • Bontoux S.A.S.
  • Citrus and Allied Essences Ltd.
  • Mountain Rose Herbs, Inc.
  • Citromax S.A.C.I.
  • doTERRA International, LLC
  • Young Living Essential Oils LC
  • Citrosuco
  • Other Key Players
Pricing Available upon Request

Market Segments Covered in Citrus Oils Industry Analysis

By Source:

  • Oranges
  • Tangerines/Mandarins
  • Grapefruit
  • Lemon and Lime

By Extraction Method:

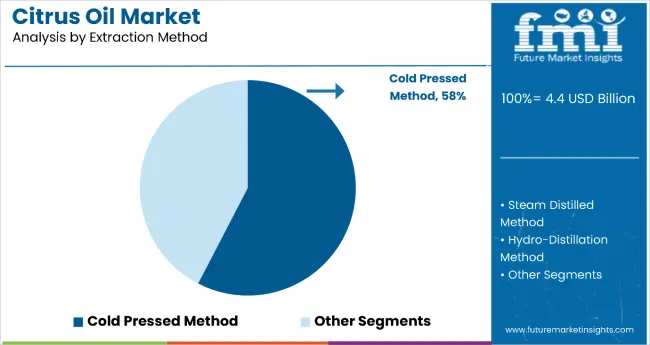
  • Steam Distilled Method
  • Cold Pressed Method
  • Hydro-Distillation Method

By Fold Type:

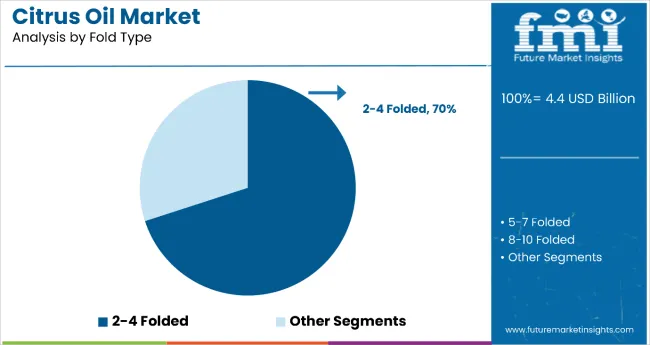
  • 2-4 Folded
  • 5-7 Folded
  • 8-10 Folded
  • Above 10 Folded

By Grade Type:

  • Deterpenated Oil
    • Terpenless Oil
    • Concentrated Oil
  • Terpene Oil

By End-Use Industry:

  • Food & Beverage
  • Personal Care & Beauty Products
  • Home Care Products
  • Aromatherapy
  • Health Care Products

By Sales Channel:

  • Offline Sales Channel
    • Supermarkets/Hypermarkets
    • Departmental Stores
    • Convenience Store
    • Other Sales Channel
  • Online Sales Channel
    • Company Website
    • E-commerce Platform

Region:

  • North America
  • Latin America
  • Europe
  • East Asia
  • South Asia
  • Oceania
  • Middle East & Africa

Frequently Asked Questions

The citrus oils market was worth more than USD 3.8 Billion in 2021.

Citrus oils consumption is expected to grow at a CAGR of around 4% during the period 2022 to 2032.

The citrus oils market is anticipated to reach a valuation of USD 5.8 Billion by 2032.

Ultra-International B.V., Phoenix Aromas & Essential Oils, LLC, Firmenich SA, Givaudan, Symrise AG, Citrus Oleo, and Lionel Hitchen (Essential Oils) Ltd are the prominent players in the market.

The USA, France, Germany, and China are the major countries driving demand for citrus oils.

The report presents a detailed cost analysis of citrus oils based on source i.e. oranges, tangerines/mandarins, grapefruit, lemon, and lime.

Table of Content

1. Market Overview | Citrus Oils Market

    1.1. Market Coverage / Taxonomy

    1.2. Market Definition / Scope / Limitations

2. The Massive Impact of the Crisis

    2.1. Global Market Forecast Scenario Comparison of Annual Growth Rates for Short Term (2022 to 2025) and Long Term (2026 to 2032)

        2.1.1. Optimistic Scenario

            2.1.1.1. China

            2.1.1.2. USA

            2.1.1.3. India

            2.1.1.4. Euro Zone

            2.1.1.5. Asia Pacific

            2.1.1.6. Rest of the World

        2.1.2. Likely Scenario

            2.1.2.1. China

            2.1.2.2. USA

            2.1.2.3. India

            2.1.2.4. Euro Zone

            2.1.2.5. Asia Pacific

            2.1.2.6. Rest of the World

        2.1.3. Pessimistic Scenario

            2.1.3.1. China

            2.1.3.2. USA

            2.1.3.3. India

            2.1.3.4. Euro Zone

            2.1.3.5. Asia Pacific

            2.1.3.6. Rest of the World

    2.2. Key Factors Impacting the Market

    Note: Market Assessment shall be Provided for Likely Scenario

3. Market Background

    3.1. Global Functional Beverages Market Overview

    3.2. Product Launches

    3.3. Consumption of Alcoholic Beverages V/s Non-alcoholic Beverages

    3.4. Product Claims & Nutritional Information Scan by Buyers

    3.5. Macro-Economic Factors

    3.6. Forecast Factors - Relevance & Impact

    3.7. Consumers Survey Analysis

    3.8. Market Dynamics

        3.8.1. Supply Side Drivers

        3.8.2. Demand Side drivers

        3.8.3. Economic Side Drivers

        3.8.4. Restraints

        3.8.5. Opportunity

        3.8.6. Trends

4. Key Regulations

    4.1. Specialized Processes FDA regulation

    4.2. FSI Regulation

    4.3. Packaging & Labelling Regulations

    4.4. Certifications and Certifying Agency Overview

    4.5. Import/Export Policies

5. Global Market- Production and Trade Analysis

    5.1. Total Production Volume (MT), (2022E)

        5.1.1. North America

        5.1.2. Latin America

        5.1.3. Europe

        5.1.4. East Asia

        5.1.5. South Asia

        5.1.6. Oceania

        5.1.7. Middle East and Africa (MEA)

    5.2. Market- Exports to the World

        5.2.1. Key Exporting Countries/Regions- Market Share Analysis (2022E)

        5.2.2. Value (USD Billion) of Export/ Volume (MT) of Export

    5.3. Market- Imports to the World

        5.3.1. Key importing Countries/Regions- Market Share Analysis (2022E)

        5.3.2. Value (USD Billion) of Import/ Volume (MT) of Import

    5.4. Comparative Analysis of Brands by Key Importing Countries

    5.5. Global Market- Supply Demand Scenario (Global Production, Sales, Import, Export)

6. Global Market Demand Analysis 2017 to 2021and Forecast, 2022 to 2032

    6.1. Historical Market Volume (Metric Tons) Analysis, 2017 to 2021

    6.2. Current and Future Market Volume (Metric Tons) Projections, 2022 to 2032

    6.3. Y-o-Y Growth Trend Analysis 2022 to 2032

7. Global Market - Pricing Analysis

    7.1. Regional Pricing Analysis (US$/Metric Ton) By Source (2017,2022,2032)

        7.1.1. Oranges

        7.1.2. Tangerines/Mandarins

        7.1.3. Lemon and Lime

        7.1.4. Grapefruit

    7.2. Pricing Break-up (2017,2022,2032)

        7.2.1. Producer-Level Pricing

        7.2.2. Distributor Level Pricing

        7.2.3. Retailer Level Pricing

    7.3. Global Average Pricing Analysis Benchmark

8. Global Market Demand (Size in USD Billion) Analysis 2017 to 2021 and Forecast, 2022 to 2032

    8.1. Historical Market Value (USD Billion) Analysis, 2017 to 2021

    8.2. Current and Future Market Value (USD Billion) Projections, 2022 to 2032

        8.2.1. Y-o-Y Growth Trend Analysis

        8.2.2. Absolute $ Opportunity Analysis

9. Global Market Analysis 2017 to 2021 and Forecast 2022 to 2032, By Source

    9.1. Introduction / Key Findings

    9.2. Historical Market Size (USD Billion) and Volume Analysis By Source, 2017 to 2021

    9.3. Current and Future Market Size (USD Billion) and Volume Analysis and Forecast By Source, 2022 to 2032

        9.3.1. Oranges

        9.3.2. Tangerines/Mandarins

        9.3.3. Lemon and Lime

        9.3.4. Grapefruit

    9.4. Market Attractiveness Analysis By Source

10. Global Market Analysis 2017 to 2021 and Forecast 2022 to 2032, By Extraction Method

    10.1. Introduction / Key Findings

    10.2. Historical Market Size (USD Billion) and Volume Analysis By Extraction Method, 2017 - 2021

    10.3. Current and Future Market Size (USD Billion) and Volume Analysis and Forecast By Extraction Method, 2022 to 2032

        10.3.1. Steam Distilled Method

        10.3.2. Cold Pressed Method

        10.3.3. Hydro-Distillation Method

    10.4. Market Attractiveness Analysis By Extraction Method

11. Global Market Analysis 2017 to 2021 and Forecast 2022 to 2032, By Fold Type

    11.1. Introduction / Key Findings

    11.2. Historical Market Size (USD Billion) and Volume Analysis By Fold Type, 2017 to 2021

    11.3. Current and Future Market Size (USD Billion) and Volume Analysis and Forecast By Fold Type, 2022 to 2032

        11.3.1. 2-4 Folded

        11.3.2. 5-7 Folded

        11.3.3. 8-10 Folded

        11.3.4 Above 10 Folded

    11.4. Market Attractiveness Analysis By Fold Type

12. Global Market Analysis 2017 to 2021 and Forecast 2022 to 2032, By Grade Type

    12.1. Introduction / Key Findings

    12.2. Historical Market Size (USD Billion) and Volume Analysis By Grade Type, 2017 to 2021

    12.3. Current and Future Market Size (USD Billion) and Volume Analysis and Forecast By Grade Type, 2022 to 2032

        12.3.1. Deterpenated Oil

            12.3.1.1. Terpenless Oil

            12.3.1.2. Concentrated Oil

        12.3.2. Terpene Oil

    12.4. Market Attractiveness Analysis By Grade Type

13. Global Market Analysis 2017 to 2021 and Forecast 2022 to 2032, By End-Use Industry

    13.1. Introduction / Key Findings

    13.2. Historical Market Size (USD Billion) and Volume Analysis By End-Use Industry, 2017 to 2021

    13.3. Current and Future Market Size (USD Billion) and Volume Analysis and Forecast By End- Use Industry, 2022 to 2032

        13.3.1. Food & Beverage

        13.3.2. Personal Care & Beauty Products

        13.3.3. Home Care Products

        13.3.4. Aromatherapy

        13.3.5. Health Care Products

        Market Attractiveness Analysis By End-Use Industry

14. Global Market Analysis 2017 to 2021 and Forecast 2022 to 2032, By Sales Channel

    14.1. Introduction / Key Findings

    14.2. Historical Market Size (USD Billion) and Volume Analysis By Sales Channel, 2017 to 2021

    14.3. Current and Future Market Size (USD Billion) and Volume Analysis and Forecast By Sales Channel, 2022 to 2032

        14.3.1. Offline Sales Channel

            14.3.1.1. Supermarkets/Hypermarkets

            14.3.1.2. Departmental Stores

            14.3.1.3. Convenience Store

            14.3.1.4. Other Sales Channel

        14.3.2. Online Sales Channel

            14.3.2.1. Company Website

            14.3.2.2. E-commerce Platform

    14.4. Market Attractiveness Analysis By Sales Channel

15. Global Market Analysis 2017 to 2021 and Forecast 2022 to 2032, By Region

    15.1. Introduction / Key Findings

    15.2. Historical Market Size (USD Billion) and Volume Analysis By Region, 2017 to 2021

    15.3. Current and Future Market Size (USD Billion) and Volume Analysis and Forecast By Region, 2022 to 2032

        15.3.1. North America

        15.3.2. South America

        15.3.3. Europe

        15.3.4. East Asia

        15.3.5. South Asia

        15.3.6. Oceania

        15.3.7. Middle East and Africa(MEA)

    15.4. Market Attractiveness Analysis By Region

16. North America Market Analysis 2017 to 2021 and Forecast 2022 to 2032

    16.1. Introduction

    16.2. Pricing Analysis

    16.3. Historical Market Size (USD Billion) and Volume Trend Analysis By Market Taxonomy, 2017 to 2021

    16.4. Market Size (USD Billion) and Volume Forecast By Market Taxonomy, 2022 to 2032

        16.4.1. By Country

            16.4.1.1. USA

            16.4.1.2. Canada

        16.4.2. By Source

        16.4.3. By Extraction Method

        16.4.4. By Fold Type

        16.4.5. By Grade Type

        16.4.6. By End-Use Industry

        16.4.7. By Sales Channel

    16.5. Market Attractiveness Analysis

        16.5.1. By Source

        16.5.2. By Extraction Method

        16.5.3. By Fold Type

        16.5.4. By Grade Type

        16.5.5. By End-Use Industry

        16.5.6. By Sales Channel /p>

    16.6. Market Trends

    16.7. Key Market Participants - Intensity Mapping

    16.8. Drivers and Restraints - Impact Analysis

17. Latin America Market Analysis 2017 to 2021 and Forecast 2022 to 2032

    17.1. Introduction

    17.2. Pricing Analysis

    17.3. Historical Market Size (USD Billion) and Volume Trend Analysis By Market Taxonomy, 2017 to 2021

    17.4. Market Size (USD Billion) and Volume Forecast By Market Taxonomy, 2022 to 2032

        17.4.1. By Country

            17.4.1.1. Brazil

            17.4.1.2. Mexico

            17.4.1.3. Argentina

            17.4.1.4. Chile

            17.4.1.5. Peru

            17.4.1.6. Rest of Latin America

        17.4.2. By Source

        17.4.3. By Extraction Method

        17.4.4. By Fold Type

        17.4.5. By Grade Type

        17.4.6. By End-Use Industry

        17.4.7. By Sales Channel Market Attractiveness Analysis

        17.4.8. By Source

        17.4.9. By Extraction Method

        17.4.10. By Fold Type

        17.4.11. By Grade Type

        17.4.12. By End-Use Industry

        17.4.13. By Sales Channel

    17.5. Market Trends

    17.6. Key Market Participants - Intensity Mapping

    17.7. Drivers and Restraints - Impact Analysis

18. Europe Market Analysis 2017 to 2021and Forecast 2022 to 2032

    18.1. Introduction

    18.2. Pricing Analysis

    18.3. Historical Market Size (USD Billion) and Volume Trend Analysis By Market Taxonomy, 2017 to 2021

    18.4. Market Size (USD Billion) and Volume Forecast By Market Taxonomy, 2022 to 2032

        18.4.1. By Country

            18.4.1.1. Germany

            18.4.1.2. Italy

            18.4.1.3. France

            18.4.1.4. United Kingdom

            18.4.1.5. Spain

            18.4.1.6. BENELUX

            18.4.1.7. Nordic

            18.4.1.8. Russia

            18.4.1.9. Poland

            18.4.1.10. Rest of Europe

        18.4.2. By Source

        18.4.3. By Extraction Method

        18.4.4. By Fold Type

        18.4.5. By Grade Type

        18.4.6. By End-Use Industry

        18.4.7. By Sales Channel

    18.5. Market Attractiveness Analysis

        18.5.1. By Source

        18.5.2. By Extraction Method

        18.5.3. By Fold Type

        18.5.4. By Grade Type

        18.5.5. By End-Use Industry

        18.5.6. By Sales Channel

    18.6. Market Trends

    18.7. Key Market Participants - Intensity Mapping

    18.8. Drivers and Restraints - Impact Analysis

19. East Asia Market Analysis 2017 to 2021 and Forecast 2022 to 2032

    19.1. Introduction

    19.2. Pricing Analysis

    19.3. Historical Market Size (USD Billion) and Volume Trend Analysis By Market Taxonomy, 2017 to 2021

    19.4. Market Size (USD Billion) and Volume Forecast By Market Taxonomy, 2022 to 2032

        19.4.1. By Country

            19.4.1.1. China

            19.4.1.2. Japan

            19.4.1.3. South Korea

        19.4.2. By Source

        19.4.3. By Extraction Method

        19.4.4. By Fold Type

        19.4.5. By Grade Type

        19.4.6. By End-Use Industry

        19.4.7. By Sales Channel

    19.5. Market Attractiveness Analysis

        19.5.1. By Source

        19.5.2. By Extraction Method

        19.5.3. By Fold Type

        19.5.4. By Grade Type

        19.5.5. By End-Use Industry

        19.5.6. By Sales Channel

    19.6. Market Trends

    19.7. Key Market Participants - Intensity Mapping

    19.8. Drivers and Restraints - Impact Analysis

20. South Asia Market Analysis 2017 to 2021 and Forecast 2022 to 2032

    20.1. Introduction

    20.2. Pricing Analysis

    20.3. Historical Market Size (USD Billion) and Volume Trend Analysis By Market Taxonomy, 2017 to 2021

    20.4. Market Size (USD Billion) and Volume Forecast By Market Taxonomy, 2022 to 2032

        20.4.1. By Country

            20.4.1.1. India

            20.4.1.2. Indonesia

            20.4.1.3. Malaysia

            20.4.1.4. Thailand

            20.4.1.5. Rest of South Asia

        20.4.2. By Source

        20.4.3. By Extraction Method

        20.4.4. By Fold Type

        20.4.5. By Grade Type

        20.4.6. By End-Use Industry

        20.4.7. By Sales Channel

    20.5. Market Attractiveness Analysis

        20.5.1. By Source ;

        20.5.2. By Extraction Method

        20.5.3. By Fold Type

        20.5.4. By Grade Type

        20.5.5. By End-Use Industry

        20.5.6. By Sales Channel

    20.6. Market Trends

    20.7. Key Market Participants - Intensity Mapping

    20.8. Drivers and Restraints - Impact Analysis

21. Oceania Market Analysis 2017 to 2021 and Forecast 2022 to 2032

    21.1. Introduction

    21.2. Pricing Analysis

    21.3. Historical Market Size (USD Billion) and Volume Trend Analysis By Market Taxonomy, 2017 to 2021

    21.4. Market Size (USD Billion) and Volume Forecast By Market Taxonomy, 2022 to 2032

        21.4.1. By Country

            21.4.1.1. Australia

            21.4.1.2. New-Zealand

        21.4.2. By Source

        21.4.3. By Extraction Method

        21.4.4. By Fold Type

        21.4.5. By Grade Type

        21.4.6. By End-Use Industry

        21.4.7. By Sales Channel

    21.5. Market Attractiveness Analysis

        21.5.1. By Source

        21.5.2. By Extraction Method

        21.5.3. By Fold Type

        21.5.4. By Grade Type

        21.5.5. By End-Use Industry

        21.5.6. By Sales Channel

    21.6. Market Trends

    21.7. Key Market Participants - Intensity Mapping

    21.8. Drivers and Restraints - Impact Analysis

22. Middle East and Africa Market Analysis 2017 to 2021 and Forecast 2022 to 2032

    22.1. Introduction

    22.2. Pricing Analysis

    22.3. Historical Market Size (USD Billion) and Volume Trend Analysis By Market Taxonomy, 2017 to 2021

    22.4. Market Size (USD Billion) and Volume Forecast By Market Taxonomy, 2022 to 2032

        22.4.1. By Country

            22.4.1.1. GCC Countries

            22.4.1.2. North Africa

            22.4.1.3. South Africa

            22.4.1.4. Turkey

            22.4.1.5. Rest of Middle East and Africa(MEA)

        22.4.2. By Source

        22.4.3. By Extraction Method

        22.4.4. By Fold Type

        22.4.5. By Grade Type

        22.4.6. By End-Use Industry

        22.4.7. By Sales Channel

    22.5. Market Attractiveness Analysis

        22.5.1. By Source

        22.5.2. By Extraction Method

        22.5.3. By Fold Type

        22.5.4. By Grade Type

        22.5.5. By End-Use Industry

        22.5.6. By Sales Channel

    22.6. Market Trends

    22.7. Key Market Participants - Intensity Mapping

    22.8. Drivers and Restraints - Impact Analysis

23. Key Countries Bulk Ingredients Market Analysis 2017 to 2021 and Forecast 2022 to 2032

    23.1. USA

        23.1.1. Pricing Analysis (2017, 2022, 2032)

        23.1.2. Market Value and Volume Analysis 2017 to 2021 and Forecast 2022 to 2032

            23.1.2.1. By Source

            23.1.2.2. By Extraction Method

            23.1.2.3. By Fold Type

            23.1.2.4. By Grade Type

            23.1.2.5. By End-Use Industry

            23.1.2.6. By Sales Channel

    23.2. Canada

        23.2.1. Pricing Analysis (2017, 2022, 2032)

        23.2.2. Market Value and Volume Analysis 2017 to 2021 and Forecast 2022 to 2032

            23.2.2.1. By Source

            23.2.2.2. By Extraction Method

            23.2.2.3. By Fold Type

            23.2.2.4. By Grade Type

            23.2.2.5. By End-Use Industry

            23.2.2.6. By Sales Channel

    23.3. Brazil

        23.3.1. Pricing Analysis (2017, 2022, 2032)

        23.3.2. Market Value and Volume Analysis 2017 to 2021 and Forecast 2022 to 2032

            23.3.2.1. By Source

            23.3.2.2. By Extraction Method

            23.3.2.3. By Fold Type

            23.3.2.4. By Grade Type

            23.3.2.5. By End-Use Industry

            23.3.2.6. By Sales Channel

    23.4. Mexico

        23.4.1. Pricing Analysis (2017, 2022, 2032)

        23.4.2. Market Value and Volume Analysis 2017 to 2021 and Forecast 2022 to 2032

            23.4.2.1. By Source ;

            23.4.2.2. By Extraction Method

            23.4.2.3. By Fold Type

            23.4.2.4. By Grade Type

            23.4.2.5. By End-Use Industry

            23.4.2.6. By Sales Channel

    23.5. Russia

        23.5.1. Pricing Analysis (2017, 2022, 2032)

        23.5.2. Market Value and Volume Analysis 2017 to 2021 and Forecast 2022 to 2032

            23.5.2.1. By Source

            23.5.2.2. By Extraction Method

            23.5.2.3. By Fold Type

            23.5.2.4. By Grade Type

            23.5.2.5. By End-Use Industry

            23.5.2.6. By Sales Channel

    23.6. Poland

        23.6.1. Pricing Analysis (2017, 2022, 2032)

        23.6.2. Market Value and Volume Analysis 2017 to 2021 and Forecast 2022 to 2032

            23.6.2.1. By Source

            23.6.2.2. By Extraction Method

            23.6.2.3. By Fold Type

            23.6.2.4. By Grade Type

            23.6.2.5. By End-Use Industry

            23.6.2.6. By Sales Channel

    23.7. Germany

        23.7.1. Pricing Analysis (2017, 2022, 2032)

        23.7.2. Market Value and Volume Analysis 2017 to 2021 and Forecast 2022 to 2032

            23.7.2.1. By Source

            23.7.2.2. By Extraction Method

            23.7.2.3. By Fold Type

            23.7.2.4. By Grade Type

            23.7.2.5. By End-Use Industry

            23.7.2.6. By Sales Channel

    23.8. United Kingdom

        23.8.1. Pricing Analysis (2017, 2022, 2032)

        23.8.2. Market Value and Volume Analysis 2017 to 2021 and Forecast 2022 to 2032

            23.8.2.1. By Source

            23.8.2.2. By Extraction Method

            23.8.2.3. By Fold Type

            23.8.2.4. By Grade Type

            23.8.2.5. By End-Use Industry

            23.8.2.6. By Sales Channel

    23.9. France

        23.9.1. Pricing Analysis (2017, 2022, 2032)

        23.9.2. Market Value and Volume Analysis 2017 to 2021 and Forecast 2022 to 2032

            23.9.2.1. By Source

            23.9.2.2. By Extraction Method

            23.9.2.3. By Fold Type

            23.9.2.4. By Grade Type

            23.9.2.5. By End-Use Industry

            23.9.2.6. By Sales Channel

    23.10. Italy

        23.10.1. Pricing Analysis (2017, 2022, 2032)

        23.10.2. Market Value and Volume Analysis 2017 to 2021 and Forecast 2022 to 2032

            23.10.2.1. By Source

            23.10.2.2. By Extraction Method

            23.10.2.3. By Fold Type

            23.10.2.4. By Grade Type

            23.10.2.5. By End-Use Industry

            23.10.2.6. By Sales Channel

    23.11. Spain

        23.11.1. Pricing Analysis (2017, 2022, 2032)

        23.11.2. Market Value and Volume Analysis 2017 to 2021 and Forecast 2022 to 2032

            23.11.2.1. By Source

            23.11.2.2. By Extraction Method

            23.11.2.3. By Fold Type

            23.11.2.4. By Grade Type

            23.11.2.5. By End-Use Industry

            23.11.2.6. By Sales Channel

    23.12. China

        23.12.1. Pricing Analysis (2017, 2022, 2032)

        23.12.2. Market Value and Volume Analysis 2017 to 2021 and Forecast 2022 to 2032

            23.12.2.1. By Source

            23.12.2.2. By Extraction Method

            23.12.2.3. By Fold Type

            23.12.2.4. By Grade Type

            23.12.2.5. By End-Use Industry

            23.12.2.6. By Sales Channel

    23.13. India

        23.13.1. Pricing Analysis (2017, 2022, 2032)

        23.13.2. Market Value and Volume Analysis 2017 to 2021 and Forecast 2022 to 2032

            23.13.2.1. By Source

            23.13.2.2. By Extraction Method

            23.13.2.3. By Fold Type

            23.13.2.4. By Grade Type

            23.13.2.5. By End-Use Industry

            23.13.2.6. By Sales Channel

    23.14. Australia and New Zealand

        23.14.1. Pricing Analysis (2017, 2022, 2032)

        23.14.2. Market Value and Volume Analysis 2017 to 2021 and Forecast 2022 to 2032

            23.14.2.1. By Source

            23.14.2.2. By Extraction Method

            23.14.2.3. By Fold Type

            23.14.2.4. By Grade Type

            23.14.2.5. By End-Use Industry

            23.14.2.6. By Sales Channel

    23.15. ASEAN

        23.15.1. Pricing Analysis (2017, 2022, 2032)

        23.15.2. Market Value and Volume Analysis 2017 to 2021 and Forecast 2022 to 2032

            23.15.2.1. By Source

            23.15.2.2. By Extraction Method

            23.15.2.3. By Fold Type

            23.15.2.4. By Grade Type

            23.15.2.5. By End-Use Industry

            23.15.2.6. By Sales Channel

    23.16. Japan

        23.16.1. Pricing Analysis (2017, 2022, 2032)

        23.16.2. Market Value and Volume Analysis 2017 to 2021 and Forecast 2022 to 2032

            23.16.2.1. By Source

            23.16.2.2. By Extraction Method

            23.16.2.3. By Fold Type

            23.16.2.4. By Grade Type

            23.16.2.5. By End-Use Industry

            23.16.2.6. By Sales Channel

    23.17. GCC Countries

        23.17.1. Pricing Analysis (2017, 2022, 2032)

        23.17.2. Market Value and Volume Analysis 2017 to 2021 and Forecast 2022 to 2032

            23.17.2.1. By Source

            23.17.2.2. By Extraction Method

            23.17.2.3. By Fold Type

            23.17.2.4. By Grade Type

            23.17.2.5. By End-Use Industry

            23.17.2.6. By Sales Channel

    23.18. South Africa

        23.18.1. Pricing Analysis (2017, 2022, 2032)

        23.18.2. Market Value and Volume Analysis 2017 to 2021 and Forecast 2022 to 2032

            23.18.2.1. By Source

            23.18.2.2. By Extraction Method

            23.18.2.3. By Fold Type

            23.18.2.4. By Grade Type

            23.18.2.5. By End-Use Industry

            23.18.2.6. By Sales Channel

24. Market Structure Analysis

    24.1. Market Analysis by Tier of Companies

    24.2. Company Share Analysis of Top Players

        24.2.1. By Source

        24.2.2. By Region

    24.3. Market Presence Analysis

        24.3.1. By Regional Footprint of Players

        24.3.2. Product Footprint by Players

        24.3.3. Channel Footprint by Players

25. Competition Deep Dive (Tentative List)

    25.1. Makana Beverages LLC

            25.1.1.1. Overview

            25.1.1.2. Product Portfolio

            25.1.1.3. Profitability by Market Segments

            25.1.1.4. Sales Footprint

            25.1.1.5. SWOT Analysis

            25.1.1.6. Strategy Overview

                25.1.1.6.1. Product Strategy

                25.1.1.6.2. Channel Strategy

    25.2. Ultra-International B.V.

            25.2.1.1. Overview

            25.2.1.2. Product Portfolio

            25.2.1.3. Profitability by Market Segments

            25.2.1.4. Sales Footprint

            25.2.1.5. SWOT Analysis

            25.2.1.6. Strategy Overview

                25.2.1.6.1. Product Strategy

                25.2.1.6.2. Channel Strategy

    25.3. Phoenix Aromas & Essential Oils, LLC

            25.3.1.1. Overview

            25.3.1.2. Product Portfolio

            25.3.1.3. Profitability by Market Segments

            25.3.1.4. Sales Footprint

            25.3.1.5. SWOT Analysis

            25.3.1.6. Strategy Overview

                25.3.1.6.1. Product Strategy

                25.3.1.6.2. Channel Strategy

    25.4. Firmenich SA

            25.4.1.1. Overview

            25.4.1.2. Product Portfolio

            25.4.1.3. Profitability by Market Segments

            25.4.1.4. Sales Footprint

            25.4.1.5. SWOT Analysis

            25.4.1.6. Strategy Overview

                25.4.1.6.1. Product Strategy

                25.4.1.6.2. Channel Strategy

    25.5. Givaudan

            25.5.1.1. Overview

            25.5.1.2. Product Portfolio

            25.5.1.3. Profitability by Market Segments

            25.5.1.4. Sales Footprint

            25.5.1.5. SWOT Analysis

            25.5.1.6. Strategy Overview

                25.5.1.6.1. Product Strategy

                25.5.1.6.2. Channel Strategy

    25.6. Symrise AG

            25.6.1.1. Overview

            25.6.1.2. Product Portfolio

            25.6.1.3. Profitability by Market Segments

            25.6.1.4. Sales Footprint

            25.6.1.5. SWOT Analysis

            25.6.1.6. Strategy Overview

                25.6.1.6.1. Product Strategy

                25.6.1.6.2. Channel Strategy

    25.7. Citrus Oleo

            25.7.1.1. Overview

            25.7.1.2. Product Portfolio

            25.7.1.3. Profitability by Market Segments

            25.7.1.4. Sales Footprint

            25.7.1.5. SWOT Analysis

            25.7.1.6. Strategy Overview

                25.7.1.6.1. Product Strategy

                25.7.1.6.2. Channel Strategy

    25.8. Lionel Hitchen (Essential Oils) Ltd

            25.8.1.1. Overview

            25.8.1.2. Product Portfolio

            25.8.1.3. Profitability by Market Segments

            25.8.1.4. Sales Footprint

            25.8.1.5. SWOT Analysis

            25.8.1.6. Strategy Overview

                25.8.1.6.1. Product Strategy

                25.8.1.6.2. Channel Strategy

    25.9. Bontoux S.A.S.

            25.9.1.1. Overview

            25.9.1.2. Product Portfolio

            25.9.1.3. Profitability by Market Segments

            25.9.1.4. Sales Footprint

            25.9.1.5. SWOT Analysis

            25.9.1.6. Strategy Overview

                25.9.1.6.1. Product Strategy

                25.9.1.6.2. Channel Strategy

    25.10. Citrus and Allied Essences Ltd.

            25.10.1.1. Overview

            25.10.1.2. Product Portfolio

            25.10.1.3. Profitability by Market Segments

            25.10.1.4. Sales Footprint

            25.10.1.5. SWOT Analysis

            25.10.1.6. Strategy Overview

                25.10.1.6.1. Product Strategy

                25.10.1.6.2. Channel Strategy

    25.11. Mountain Rose Herbs, Inc.

            25.11.1.1. Overview

            25.11.1.2. Product Portfolio

            25.11.1.3. Profitability by Market Segments

            25.11.1.4. Sales Footprint

            25.11.1.5. SWOT Analysis

            25.11.1.6. Strategy Overview

                25.11.1.6.1. Product Strategy

                25.11.1.6.2. Channel Strategy

    25.12. Citromax S.A.C.I.

            25.12.1.1. Overview

            25.12.1.2. Product Portfolio

            25.12.1.3. Profitability by Market Segments

            25.12.1.4. Sales Footprint

            25.12.1.5. SWOT Analysis

            25.12.1.6. Strategy Overview

                25.12.1.6.1. Product Strategy

                25.12.1.6.2. Channel Strategy

    25.13. doTERRA International, LLC

            25.13.1.1. Overview

            25.13.1.2. Product Portfolio

            25.13.1.3. Profitability by Market Segments

            25.13.1.4. Sales Footprint

            25.13.1.5. SWOT Analysis

            25.13.1.6. Strategy Overview

                25.13.1.6.1. Product Strategy

                25.13.1.6.2. Channel Strategy

    25.14. Young Living Essential Oils LC

            25.14.1.1. Overview

            25.14.1.2. Product Portfolio

            25.14.1.3. Profitability by Market Segments

            25.14.1.4. Sales Footprint

            25.14.1.5. SWOT Analysis

            25.14.1.6. Strategy Overview

                25.14.1.6.1. Product Strategy

                25.14.1.6.2. Channel Strategy

    25.15. Citrosuco

            25.15.1.1. Overview

            25.15.1.2. Product Portfolio

            25.15.1.3. Profitability by Market Segments

            25.15.1.4. Sales Footprint

            25.15.1.5. SWOT Analysis

            25.15.1.6. Strategy Overview

                25.15.1.6.1. Product Strategy

                25.15.1.6.2. Channel Strategy

    Note: Above list is subject to change during the course of the study

26. Assumptions and Acronyms Used

27. Research Methodology

Don't pay for what you don't need

Customize your report by selecting specific countries or regions and save 30%!

List of Tables

Table 1: Global Market Value (USD Billion) & Volume, 2017 to 2021

Table 2: Global Market Value (USD Billion) & Volume, 2022 to 2032

Table 3: Global Market Value (USD Billion) & Volume and Y-o-Y, 2022 to 2032

Table 4: Global Regular Segment Value (USD Billion) & Volume, By Region 2017 to 2021

Table 5: Global Regular Segment Value (USD Billion) & Volume, By Region 2022 to 2032

Table 6: Global Regular Segment Market Share, By Region 2017 to 2021

Table 7: Global Regular Segment Market Share, By Region 2022 to 2032

Table 8: Global Regular Segment Y-o-Y, By Region 2022 to 2032

Table 9: Global Herbs & Spices Segment Value (USD Billion) & Volume, By Region 2017 to 2021

Table 10: Global Herbs & Spices Segment Value (USD Billion) & Volume, By Region 2022 to 2032

Table 11: Global Herbs & Spices Segment Market Share, By Region 2017 to 2021

Table 12: Global Herbs & Spices Segment Market Share, By Region 2022 to 2032

Table 13: Global Herbs & Spices Segment Y-o-Y, By Region 2022 to 2032

Table 14: Global Citrus Segment Value (USD Billion) & Volume, By Region 2017 to 2021

Table 15: Global Citrus Segment Value (USD Billion) & Volume, By Region 2022 to 2032

Table 16: Global Citrus Segment Market Share, By Region 2017 to 2021

Table 17: Global Citrus Segment Market Share, By Region 2022 to 2032

Table 18: Global Citrus Segment Y-o-Y, By Region 2022 to 2032

Table 19: Global Berries Segment Value (USD Billion) & Volume, By Region 2017 to 2021

Table 20: Global Berries Segment Value (USD Billion) & Volume, By Region 2022 to 2032

Table 21: Global Berries Segment Market Share, By Region 2017 to 2021

Table 22: Global Berries Segment Market Share, By Region 2022 to 2032

Table 23: Global Berries Segment Y-o-Y, By Region 2022 to 2032

Table 24: Global Apple Segment Value (USD Billion) & Volume, By Region 2017 to 2021

Table 25: Global Apple Segment Value (USD Billion) & Volume, By Region 2022 to 2032

Table 26: Global Apple Segment Market Share, By Region 2017 to 2021

Table 27: Global Apple Segment Market Share, By Region 2022 to 2032

Table 28: Global Apple Segment Y-o-Y, By Region 2022 to 2032

Table 29: Global Coconut & Mangoes Segment Value (USD Billion) & Volume, By Region 2017 to 2021

Table 30: Global Coconut & Mangoes Segment Value (USD Billion) & Volume, By Region 2022 to 2032

Table 31: Global Coconut & Mangoes Segment Market Share, By Region 2017 to 2021

Table 32: Global Coconut & Mangoes Segment Market Share, By Region 2022 to 2032

Table 33: Global Coconut & Mangoes Segment Y-o-Y, By Region 2022 to 2032

Table 34: Global Flowers Segment Value (USD Billion) & Volume, By Region 2017 to 2021

Table 35: Global Flowers Segment Value (USD Billion) & Volume, By Region 2022 to 2032

Table 36: Global Flowers Segment Market Share, By Region 2017 to 2021

Table 37: Global Flowers Segment Market Share, By Region 2022 to 2032

Table 38: Global Flowers Segment Y-o-Y, By Region 2022 to 2032

Table 39: Global Others Segment Value (USD Billion) & Volume, By Region 2017 to 2021

Table 40: Global Others Segment Value (USD Billion) & Volume, By Region 2022 to 2032

Table 41: Global Others Segment Market Share, By Region 2017 to 2021

Table 42: Global Others Segment Market Share, By Region 2022 to 2032

Table 43: Global Others Segment Y-o-Y, By Region 2022 to 2032

Table 44: Global Food and Drink Specialty Store Segment Value (USD Billion) & Volume, By Region 2017 to 2021

Table 45: Global Food and Drink Specialty Store Segment Value (USD Billion) & Volume, By Region 2022 to 2032

Table 46: Global Food and Drink Specialty Store Segment Market Share, By Region 2017 to 2021

Table 47: Global Food and Drink Specialty Store Segment Market Share, By Region 2022 to 2032

Table 48: Global Food and Drink Specialty Store Segment Y-o-Y, By Region 2022 to 2032

Table 49: Global Hypermarket/Supermarket Segment Value (USD Billion) & Volume, By Region 2017 to 2021

Table 50: Global Hypermarket/Supermarket Segment Value (USD Billion) & Volume, By Region 2022 to 2032

Table 51: Global Hypermarket/Supermarket Segment Market Share, By Region 2017 to 2021

Table 52: Global Hypermarket/Supermarket Segment Market Share, By Region 2022 to 2032

Table 53: Global Hypermarket/Supermarket Segment Y-o-Y, By Region 2022 to 2032

Table 54: Global Convenience Store Segment Value (USD Billion) & Volume, By Region 2017 to 2021

Table 55: Global Convenience Store Segment Value (USD Billion) & Volume, By Region 2022 to 2032

Table 56: Global Convenience Store Segment Market Share, By Region 2017 to 2021

Table 57: Global Convenience Store Segment Market Share, By Region 2022 to 2032

Table 58: Global Convenience Store Segment Y-o-Y, By Region 2022 to 2032

Table 59: Global Online Retail Segment Value (USD Billion) & Volume, By Region 2017 to 2021

Table 60: Global Online Retail Segment Value (USD Billion) & Volume, By Region 2022 to 2032

Table 61: Global Online Retail Segment Market Share, By Region 2017 to 2021

Table 62: Global Online Retail Segment Market Share, By Region 2022 to 2032

Table 63: Global Online Retail Segment Y-o-Y, By Region 2022 to 2032

Table 64: Global Glass Bottles Segment Value (USD Billion) & Volume, By Region 2017 to 2021

Table 65: Global Glass Bottles Segment Value (USD Billion) & Volume, By Region 2022 to 2032

Table 66: Global Glass Bottles Segment Market Share, By Region 2017 to 2021

Table 67: Global Glass Bottles Segment Market Share, By Region 2022 to 2032

Table 68: Global Glass Bottles Segment Y-o-Y, By Region 2022 to 2032

Table 69: Global Cans Segment Value (USD Billion) & Volume, By Region 2017 to 2021

Table 70: Global Cans Segment Value (USD Billion) & Volume, By Region 2022 to 2032

Table 71: Global Cans Segment Market Share, By Region 2017 to 2021

Table 72: Global Cans Segment Market Share, By Region 2022 to 2032

Table 73: Global Cans Segment Y-o-Y, By Region 2022 to 2032

Table 74: North America Market Value (USD Billion) & Volume, By Country 2017 to 2021

Table 75: North America Market Value (USD Billion) & Volume, By Country 2022 to 2032

Table 76: North America Market Value (USD Billion) & Volume, By Source 2017 to 2021

Table 77: North America Market Value (USD Billion) & Volume, By Source 2022 to 2032

Table 78: North America Market Value (USD Billion) & Volume, By Extraction Method 2017 to 2021

Table 79: North America Market Value (USD Billion) & Volume, By Extraction Method 2020 to 2030

Table 80: North America Market Value (USD Billion) & Volume, By Grade Type 2017 to 2021

Table 81: North America Market Value (USD Billion) & Volume, By Grade Type 2022 to 2032

Table 82: Latin America Market Value (USD Billion) & Volume, By Country 2017 to 2021

Table 83: Latin America Market Value (USD Billion) & Volume, By Country 2022 to 2032

Table 84: Latin America Market Value (USD Billion) & Volume, By Source 2017 to 2021

Table 85: Latin America Market Value (USD Billion) & Volume, By Source 2022 to 2032

Table 86: Latin America Market Value (USD Billion) & Volume, By Extraction Method 2017 to 2021

Table 87: Latin America Market Value (USD Billion) & Volume, By Extraction Method 2020 to 2030

Table 88: Latin America Market Value (USD Billion) & Volume, By Grade Type 2017 to 2021

Table 89: Latin America Market Value (USD Billion) & Volume, By Grade Type 2022 to 2032

Table 90: Europe Market Value (USD Billion) & Volume, By Country 2017 to 2021

Table 91: Europe Market Value (USD Billion) & Volume, By Country 2022 to 2032

Table 92: Europe Market Value (USD Billion) & Volume, By Source 2017 to 2021

Table 93: Europe Market Value (USD Billion) & Volume, By Source 2022 to 2032

Table 94: Europe Market Value (USD Billion) & Volume, By Extraction Method 2017 to 2021

Table 95: Europe Market Value (USD Billion) & Volume, By Extraction Method 2020 to 2030

Table 96: Europe Market Value (USD Billion) & Volume, By Grade Type 2017 to 2021

Table 97: Europe Market Value (USD Billion) & Volume, By Grade Type 2022 to 2032

Table 98: East Asia Market Value (USD Billion) & Volume, By Country 2017 to 2021

Table 99: East Asia Market Value (USD Billion) & Volume, By Country 2022 to 2032

Table 100: East Asia Market Value (USD Billion) & Volume, By Source 2017 to 2021

Table 101: East Asia Market Value (USD Billion) & Volume, By Source 2022 to 2032

Table 102: East Asia Market Value (USD Billion) & Volume, By Extraction Method 2017 to 2021

Table 103: East Asia Market Value (USD Billion) & Volume, By Extraction Method 2020 to 2030

Table 104: East Asia Market Value (USD Billion) & Volume, By Grade Type 2017 to 2021

Table 105: East Asia Market Value (USD Billion) & Volume, By Grade Type 2022 to 2032

Table 106: South Asia Market Value (USD Billion) & Volume, By Country 2017 to 2021

Table 107: South Asia Market Value (USD Billion) & Volume, By Country 2022 to 2032

Table 108: South Asia Market Value (USD Billion) & Volume, By Source 2017 to 2021

Table 109: South Asia Market Value (USD Billion) & Volume, By Source 2022 to 2032

Table 110: South Asia Market Value (USD Billion) & Volume, By Extraction Method 2017 to 2021

Table 111: South Asia Market Value (USD Billion) & Volume, By Extraction Method 2020 to 2030

Table 112: South Asia Market Value (USD Billion) & Volume, By Grade Type 2017 to 2021

Table 113: South Asia Market Value (USD Billion) & Volume, By Grade Type 2022 to 2032

Table 114: Oceania Market Value (USD Billion) & Volume, By Country 2017 to 2021

Table 115: Oceania Market Value (USD Billion) & Volume, By Country 2022 to 2032

Table 116: Oceania Market Value (USD Billion) & Volume, By Source 2017 to 2021

Table 117: Oceania Market Value (USD Billion) & Volume, By Source 2022 to 2032

Table 118: Oceania Market Value (USD Billion) & Volume, By Extraction Method 2017 to 2021

Table 119: Oceania Market Value (USD Billion) & Volume, By Extraction Method 2020 to 2030

Table 120: Oceania Market Value (USD Billion) & Volume, By Grade Type 2017 to 2021

Table 121: Oceania Market Value (USD Billion) & Volume, By Grade Type 2022 to 2032

Table 114: Oceania Market Value (USD Billion) & Volume, By Country 2017 to 2021

Table 115: MEA Market Value (USD Billion) & Volume, By Country 2022 to 2032

Table 116: MEA Market Value (USD Billion) & Volume, By Source 2017 to 2021

Table 117: MEA Market Value (USD Billion) & Volume, By Source 2022 to 2032

Table 118: MEA Market Value (USD Billion) & Volume, By Extraction Method 2017 to 2021

Table 119: MEA Market Value (USD Billion) & Volume, By Extraction Method 2020 to 2030

Table 120: MEA Market Value (USD Billion) & Volume, By Grade Type 2017 to 2021

Table 121: MEA Market Value (USD Billion) & Volume, By Grade Type 2022 to 2032
Nandini Roy Choudhury

Principal Consultant

Talk to Analyst

Find your sweet spots for generating winning opportunities in this market.

List of Charts

Figure 1: Global Market Value (USD Billion), 2017 to 2021

Figure 2: Global Market Value (USD Billion) Forecast, 2022 to 2032

Figure 3: Global Market Value (USD Billion) and Y-o-Y, 2022 to 2032

Figure 4: Global Regular Segment Market Value (USD Billion) By Region, 2017 to 2021

Figure 5: Global Regular Segment Market Value (USD Billion) By Region, 2022 to 2032

Figure 6: Global Regular Segment Y-o-Y Growth Rate, By Region, 2022 to 2032

Figure 7: Global Herbs & Spices Segment Market Value (USD Billion by Region, 2017 to 2021

Figure 8: Global Herbs & Spices Segment Market Value (USD Billion) By Region, 2022 to 2032

Figure 9: Global Herbs & Spices Segment Y-o-Y Growth Rate, By Region, 2022 to 2032

Figure 10: Global Citrus Segment Market Value (USD Billion) By Region, 2017 to 2021

Figure 11: Global Citrus Segment Market Value (USD Billion) By Region, 2022 to 2032

Figure 12: Global Citrus Segment Y-o-Y Growth Rate, By Region, 2022 to 2032

Figure 13: Global Berries Segment Market Value (USD Billion) By Region, 2017 to 2021

Figure 14: Global Berries Segment Market Value (USD Billion) By Region, 2022 to 2032

Figure 15: Global Berries Segment Y-o-Y Growth Rate, By Region, 2022 to 2032

Figure 16: Global Apple Segment Market Value (USD Billion) By Region, 2017 to 2021

Figure 17: Global Apple Segment Market Value (USD Billion) By Region, 2022 to 2032

Figure 18: Global Apple Segment Y-o-Y Growth Rate, By Region, 2022 to 2032

Figure 19: Global Coconut & Mangoes Segment Market Value (USD Billion) By Region, 2017 to 2021

Figure 20: Global Coconut & Mangoes Segment Market Value (USD Billion) By Region, 2022 to 2032

Figure 21: Global Coconut & Mangoes Segment Y-o-Y Growth Rate, By Region, 2022 to 2032

Figure 22: Global Flowers Segment Market Value (USD Billion) By Region, 2017 to 2021

Figure 23: Global Flowers Segment Market Value (USD Billion) By Region, 2022 to 2032

Figure 24: Global Flowers Segment Y-o-Y Growth Rate, By Region, 2022 to 2032

Figure 25: Global Others Segment Market Value (USD Billion) By Region, 2017 to 2021

Figure 26: Global Others Segment Market Value (USD Billion) By Region, 2022 to 2032

Figure 27: Global Others Segment Y-o-Y Growth Rate, By Region, 2022 to 2032

Figure 28: Global Food and Drink Specialty Store Segment Market Value (USD Billion) By Region, 2017 to 2021

Figure 29: Global Food and Drink Specialty Store Segment Market Value (USD Billion) By Region, 2022 to 2032

Figure 30: Global Food and Drink Specialty Store Segment Y-o-Y Growth Rate, By Region, 2022 to 2032

Figure 31: Global Hypermarket/Supermarket Segment Market Value (USD Billion) By Region, 2017 to 2021

Figure 32: Global Hypermarket/Supermarket Segment Market Value (USD Billion) By Region, 2022 to 2032

Figure 33: Global Hypermarket/Supermarket Segment Y-o-Y Growth Rate, By Region, 2022 to 2032

Figure 34: Global Convenience Store Segment Market Value (USD Billion) By Region, 2017 to 2021

Figure 35: Global Convenience Store Segment Market Value (USD Billion) By Region, 2022 to 2032

Figure 36: Global Convenience Store Segment Y-o-Y Growth Rate, By Region, 2022 to 2032

Figure 37: Global Online Retail Segment Market Value (USD Billion) By Region, 2017 to 2021

Figure 38: Global Online Retail Segment Market Value (USD Billion) By Region, 2022 to 2032

Figure 39: Global Online Retail Segment Y-o-Y Growth Rate, By Region, 2022 to 2032

Figure 40: Global Glass Bottles Segment Market Value (USD Billion) By Region, 2017 to 2021

Figure 41: Global Glass Bottles Segment Market Value (USD Billion) By Region, 2022 to 2032

Figure 42: Global Glass Bottles Segment Y-o-Y Growth Rate, By Region, 2022 to 2032

Figure 43: Global Cans Segment Market Value (USD Billion) By Region, 2017 to 2021

Figure 44: Global Cans Segment Market Value (USD Billion) By Region, 2022 to 2032

Figure 45: Global Cans Segment Y-o-Y Growth Rate, By Region, 2022 to 2032

Figure 46: North America Market Value (USD Billion), By Country 2017 to 2021

Figure 47: North America Market Value (USD Billion), By Country 2022 to 2032

Figure 48: North America Market Value (USD Billion), By Source 2017 to 2021

Figure 49: North America Market Value (USD Billion), By Source 2022 to 2032

Figure 50: North America Market Value (USD Billion), By Extraction Method2017 to 2021

Figure 51: North America Market Value (USD Billion), By Extraction Method2022 to 2032

Figure 52: North America Market Value (USD Billion), By Grade Type 2017 to 2021

Figure 53: North America Market Value (USD Billion), By Grade Type 2022 to 2032

Figure 54: Latin America Market Value (USD Billion), By Country 2017 to 2021

Figure 55: Latin America Market Value (USD Billion), By Country 2022 to 2032

Figure 56: Latin America Market Value (USD Billion), By Source 2017 to 2021

Figure 57: Latin America Market Value (USD Billion), By Source 2022 to 2032

Figure 58: Latin America Market Value (USD Billion), By Extraction Method 2017 to 2021

Figure 59: Latin America Market Value (USD Billion), By Extraction Method 2022 to 2032

Figure 60: Latin America Market Value (USD Billion), By Grade Type 2017 to 2021

Figure 61: Latin America Market Value (USD Billion), By Grade Type 2022 to 2032

Figure 62: Europe Market Value (USD Billion), By Country 2017 to 2021

Figure 63: Europe Market Value (USD Billion), By Country 2022 to 2032

Figure 64: Europe Market Value (USD Billion), By Source 2017 to 2021

Figure 65: Europe Market Value (USD Billion), By Source 2022 to 2032

Figure 66: Europe Market Value (USD Billion), By Extraction Method 2017 to 2021

Figure 67: Europe Market Value (USD Billion), By Extraction Method 2022 to 2032

Figure 68: Europe Market Value (USD Billion), By Grade Type 2017 to 2021

Figure 69: Europe Market Value (USD Billion), By Grade Type 2022 to 2032

Figure 70: East Asia Market Value (USD Billion), By Country 2017 to 2021

Figure 71: East Asia Market Value (USD Billion), By Country 2022 to 2032

Figure 72: East Asia Market Value (USD Billion), By Source 2017 to 2021

Figure 73: East Asia Market Value (USD Billion), By Source 2022 to 2032

Figure 74: East Asia Market Value (USD Billion), By Grade Type 2017 to 2021

Figure 75: East Asia Market Value (USD Billion), By Extraction Method2022 to 2032

Figure 76: East Asia Market Value (USD Billion), By Grade Type 2017 to 2021

Figure 77: East Asia Market Value (USD Billion), By Grade Type 2022 to 2032

Figure 78: South Asia Market Value (USD Billion), By Country 2017 to 2021

Figure 79: South Asia Market Value (USD Billion), By Country 2022 to 2032

Figure 80: South Asia Market Value (USD Billion), By Source 2017 to 2021

Figure 81: South Asia Market Value (USD Billion), By Source 2022 to 2032

Figure 82: South Asia Market Value (USD Billion), By Extraction Method2017 to 2021

Figure 83: South Asia Market Value (USD Billion), By Extraction Method2022 to 2032

Figure 84: South Asia Market Value (USD Billion), By Grade Type 2017 to 2021

Figure 85: South Asia Market Value (USD Billion), By Grade Type 2022 to 2032

Figure 86: Oceania Market Value (USD Billion), By Country 2017 to 2021

Figure 87: Oceania Market Value (USD Billion), By Country 2022 to 2032

Figure 88: Oceania Market Value (USD Billion), By Source 2017 to 2021

Figure 89: Oceania Market Value (USD Billion), By Source 2022 to 2032

Figure 90: Oceania Market Value (USD Billion), By Extraction Method2017 to 2021

Figure 91: Oceania Market Value (USD Billion), By Extraction Method2022 to 2032

Figure 92: Oceania Market Value (USD Billion), By Grade Type 2017 to 2021

Figure 93: Oceania Market Value (USD Billion), By Grade Type 2022 to 2032

Figure 94: MEA Market Value (USD Billion), By Country 2017 to 2021

Figure 95: MEA Market Value (USD Billion), By Country 2022 to 2032

Figure 96: MEA Market Value (USD Billion), By Source 2017 to 2021

Figure 97: MEA Market Value (USD Billion), By Source 2022 to 2032

Figure 98: MEA Market Value (USD Billion), By Extraction Method2017 to 2021

Figure 99: MEA Market Value (USD Billion), By Extraction Method2022 to 2032

Figure 100: MEA Market Value (USD Billion), By Grade Type 2017 to 2021

Figure 101: MEA Market Value (USD Billion), By Grade Type 2022 to 2032

Recommendations

Food and Beverage

Citrus Flavors Market

Published : August 2023

Food and Beverage

Citrus Seeds Market

Published : June 2023

Food and Beverage

Citrus Yogurt Market

Published : April 2023

Food and Beverage

Citrus bioflavonoid Market

Published : May 2018

Explore Food and Beverage Insights

View Reports