Plant-Based Ingredients Market Size and Share Forecast Outlook 2025 to 2035

The plant-based ingredients market is estimated to be valued at USD 10.1 billion in 2025 and is projected to reach USD 23.0 billion by 2035, registering a CAGR of 8.6% over the forecast period. The plant-based ingredients market is projected to add an absolute dollar opportunity of USD 12.9 billion over the forecast period, reflecting a 2.3 times growth at a compound annual growth rate of 8.6%.

Quick Stats for Plant-Based Ingredients Market
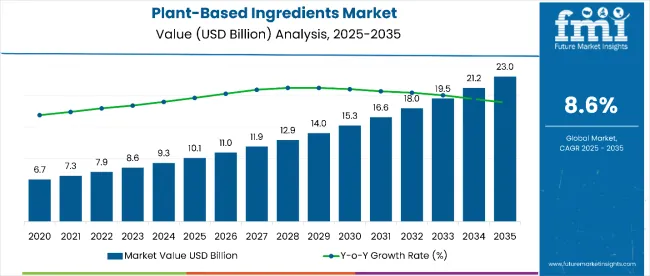
  • Plant-Based Ingredients Market Value (2025): USD 10.1 billion
  • Plant-Based Ingredients Market Forecast Value (2035): USD 23.0 billion
  • Plant-Based Ingredients Market Forecast CAGR: 8.6%
  • Leading End Use Segment in Plant-Based Ingredients Market in 2025: Food & Beverages (50%)
  • Key Growth Regions in Plant-Based Ingredients Market: North America, Asia-Pacific, Europe
  • Top Key Players in Plant-Based Ingredients Market: Ingredion Inc., Archer-Daniels-Midland Company, DuPont de Nemours, Inc., Cargill Inc.

Plant Based Ingredients Market

Metric Value
Plant-Based Ingredients Market Estimated Value in (2025E) USD 10.1 billion
Plant-Based Ingredients Market Forecast Value in (2035F) USD 23.0 billion
Forecast CAGR (2025 to 2035) 8.6%

The market's evolution is expected to be shaped by rising health consciousness, growing vegan population, and increasing demand for functional foods with clean-label ingredients.

By 2030, the market is likely to reach approximately USD 5.2 billion, accounting for USD 2.6 billion in incremental value over the first half of the decade. The remaining USD 5.3 billion is expected during the second half, suggesting a strongly back-loaded growth pattern. Product diversification across probiotics, plant proteins, and phytochemicals is gaining traction due to expanding applications in functional beverages, dietary supplements, and alternative protein formulations.

Companies such as Nestle SA and Danone S.A. are advancing their competitive positions through investment in fermentation technologies, plant protein extraction methods, and sustainable ingredient sourcing. Clean-label and natural ingredient procurement models are supporting expansion into premium organic segments, functional food applications, and personalized nutrition solutions.

The market holds approximately 42% of the functional food ingredients market, driven by growing consumer preference for natural, plant-derived alternatives to synthetic additives. It accounts for around 35% of the nutraceuticals market, supported by increasing awareness of the health benefits of plant-based compounds like probiotics, phytochemicals, and plant proteins.

The market contributes nearly 28% to the clean-label ingredients market, particularly for products requiring transparent, recognizable ingredient lists. It holds close to 32% of the sustainable ingredients market, where plant-based alternatives offer environmental benefits over animal-derived ingredients. The share in the specialty nutrition market reaches about 38%, reflecting growing demand for targeted nutritional solutions from plant sources.

The market is undergoing structural change driven by rising health consciousness, environmental sustainability concerns, and technological advances in plant-based ingredient extraction and processing. Advanced manufacturing methods using fermentation, enzyme technology, and precision extraction have enhanced ingredient functionality, bioavailability, and taste neutrality, making plant-based alternatives increasingly comparable to traditional ingredients.

Manufacturers are introducing specialized formulations for specific health conditions, age groups, and dietary preferences, expanding applications across functional foods, beverages, and dietary supplements.

Plant Based Ingredient Market Analysis by Top Investment Segments

The market is segmented by type, claims, sales channel, end use, buyer type, and region. By type, the market is segmented into staple food, specialty food, dairy substitutes, food additives, and nutrients & supplements. Based on claims, the market is divided into GMO, non-GMO, and organic.

In terms of sales channel, the market is classified into direct sales, modern trade, convenience stores, specialty stores, small groceries, online retail, and other sales channels. The end use segment includes food & beverages, cosmetics & personal care, nutraceuticals, and agricultural.

By buyer type, the market is characterized into HoReca, food processors & manufacturers, and household & residential. Regionally, the market is classified into North America, Latin America, Europe, East Asia, South Asia, Oceania, and the Middle East & Africa.
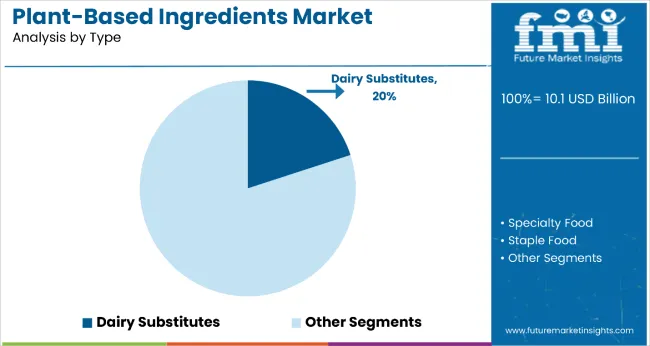
By Type, Dairy Substitutes Segment Accounts for 20% of the Market Share

Plant Based Ingredients Market Analysis By Type

The dairy substitutes segment holds a significant 20% share in the type category, driven by rising consumer demand for plant-based milk, yogurt, cheese, and cream alternatives derived from soy, oats, almonds, peas, and coconut. The segment’s rapid expansion is attributed to increasing lactose intolerance, growing vegan and flexitarian lifestyles, and preference for cholesterol-free and allergen-friendly products.

Key industry players such as Cargill, ADM, and Roquette are actively innovating in this space, focusing on clean-label, high-protein formulations that replicate the taste and functionality of traditional dairy.

As consumer values shift toward health, sustainability, and ethics, the segment is poised for sustained growth, supported by government-led dietary initiatives and ESG commitments from major food corporations. Greater product availability across retail, foodservice, and e-commerce channels, alongside breakthroughs in precision fermentation and enzyme-enhanced flavor technology, is expanding the appeal of dairy substitutes among mainstream consumers.
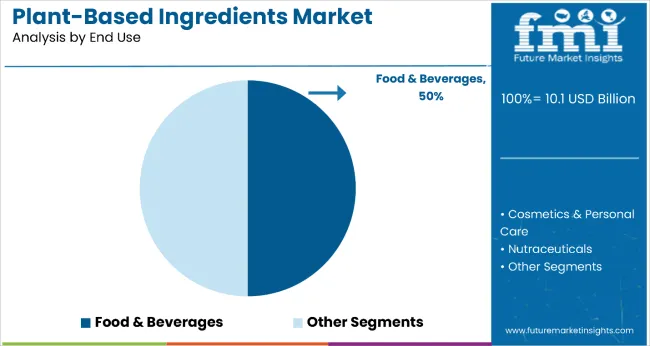
By End Use, Food & Beverages Segment Accounts for 50% of the Market Share

Plant Based Ingredients Market Analysis By End Use

The food and beverages segment leads with a commanding 50% share in the end-use category, making it the largest consumer of plant-based ingredients globally. Applications span a wide array of products including plant-based meats, functional drinks, protein bars, dairy-free beverages, and ready meals, reflecting the growing demand for health-forward and sustainable nutrition.

The segment’s dominance is further fueled by aggressive R&D investments, partnerships, and new product development by both established firms and plant-based startups.

Manufacturers are increasingly incorporating plant-based proteins, fibers, natural sweeteners, and emulsifiers to meet clean-label, fortified, and functional food trends. Additionally, the rise of plant-based offerings in quick-service restaurants, cafes, and institutional settings is creating robust new channels for ingredient deployment, reinforcing long-term segment growth.

Why is the Plant-Based Ingredients Market Growing?

The market growth is driven by increasing consumer awareness of the health benefits associated with plant-derived nutrients, including their role in preventing chronic diseases and supporting immune function. Rising prevalence of lactose intolerance, food allergies, and dietary restrictions has accelerated demand for plant-based alternatives that provide equivalent nutritional benefits without adverse effects.

Growing environmental consciousness among consumers is driving preference for sustainable ingredients with lower carbon footprints compared to animal-derived alternatives.

The expanding vegan and flexitarian population, particularly among millennials and Gen Z consumers, is creating sustained demand for plant-based ingredients that enable food manufacturers to develop products meeting these dietary preferences. Government initiatives promoting plant-based nutrition and functional foods, along with favorable regulatory frameworks for health claims, are enhancing market accessibility.

What are the Drivers, Restraints, and Key Trends of the Plant-Based Ingredients Market?

From 2025 to 2035, the plant-based ingredients market adopted advanced fermentation technologies and precision extraction methods to improve ingredient functionality and cost-effectiveness. Applications include functional beverages, alternative protein products, and specialized dietary supplements targeting specific health conditions.

Manufacturers are introducing personalized nutrition solutions and targeted probiotic strains that deliver enhanced bioavailability and health benefits. Clean-label and organic certification standards now support premium positioning and consumer trust.

Health Consciousness and Disease Prevention Drive Market Adoption

Growing consumer awareness of nutrition's role in disease prevention has been identified as the primary catalyst driving growth in the plant-based ingredients market. In 2024, rising incidence of cardiovascular disease, diabetes, and digestive disorders prompted widespread adoption of functional plant-based ingredients with proven health benefits. By 2025, health-conscious consumers were incorporating plant-based products containing probiotics, omega-3 fatty acids, and antioxidants to support immune function and overall wellness.

Technological Innovation Creates Functional Enhancement Opportunities

In 2024, advanced fermentation and extraction technologies enabled the development of plant-based ingredients with enhanced bioavailability and stability compared to traditional alternatives. By 2025, manufacturers were utilizing precision processing techniques to create targeted ingredient formulations that deliver specific health benefits while maintaining taste neutrality.

Manufacturers offering innovative processing technologies and specialized ingredient formulations are positioned to capture growing demand from food companies seeking to differentiate their products through superior nutritional profiles and clean-label positioning.
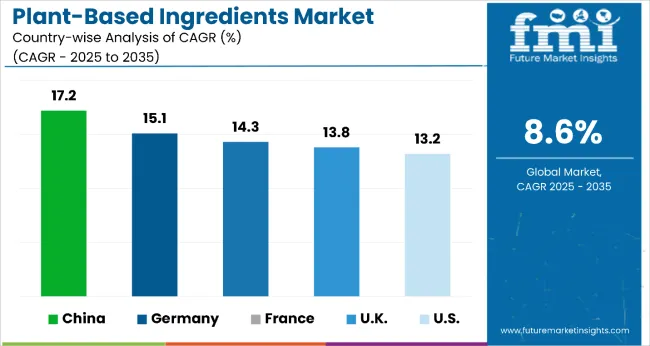
Analysis of Plant-Based Ingredients Market by Key Countries

Plant Based Ingredients Market Country Wise Analysis

Country CAGR
China 17.2%
Germany 15.1%
France 14.3%
UK 13.8%
USA 13.2%

Among the top global players in the plant-based ingredients market, China leads with the highest projected CAGR of 17.2% (2025 to 2035), driven by rapid urbanization, growing health awareness, and large-scale ingredient production facilities. Germany follows with a CAGR of 15.1%, fueled by its advanced biotechnology and strong regulatory support for organic and functional ingredients.

France comes next with a 14.3% CAGR, focusing on premium, natural-origin ingredients aligned with its culinary heritage and strict quality standards. The UK shows a slightly slower CAGR of 13.8%, influenced by health-driven demand and post-Brexit supply chain reforms encouraging domestic innovation. The USA, while being the volume leader and home to top companies, is projected to grow at a comparatively modest CAGR of 13.2%.

The report covers an in-depth analysis of 40+ countries; five top performing OECD countries are highlighted below.

Innovation Leadership in Plant-Based Ingredients Market in China

Plant-based ingredients market in China is projected to grow at a CAGR of 17.2% from 2025 to 2035, driven by massive urbanization and rapidly expanding middle-class population seeking healthier food options. Domestic manufacturers are establishing large-scale fermentation facilities and investing in advanced extraction technologies to produce high-quality plant-based ingredients for both domestic consumption and export markets.

Government initiatives supporting functional food development and traditional Chinese medicine integration are accelerating market growth and innovation.

  • 12.4 million tons of plant-based ingredients processed in China during 2024
  • 35% YoY growth in probiotic ingredient production between 2023 to 2024
  • 82% of China's plant-based ingredient facilities certified under international quality standards in 2024

Technology Advancement in Plant-Based Ingredients Market in Germany

Germany plant-based ingredients revenue is expected to grow at a CAGR of 15.1% from 2025 to 2035, exceeding the global rate by 0.3%. Growth is centered on premium organic and functionally-enhanced ingredients meeting strict EU quality and safety standards.

Advanced biotechnology and fermentation capabilities are driving innovation in specialized probiotic strains and plant protein formulations. Strong research partnerships between universities and industry are accelerating development of next-generation plant-based ingredients.

  • 3.2 million tons of plant-based ingredients consumed in Germany in 2024
  • 91% of ingredient imports met EU organic certification standards in 2024
  • 850 research projects focused on plant-based ingredient innovation in German institutions in 2024

Market Development in Plant-Based Ingredients Market in France

The French plant-based ingredients demand is forecast to grow at a CAGR of 14.3% from 2025 to 2035, slightly below the global average. Growth is concentrated in premium natural ingredients for high-end food applications, particularly in Lyon and Paris metropolitan areas.

French regulations emphasizing natural origin and traceability are supporting market expansion while maintaining traditional quality standards. Domestic suppliers are developing specialized formulations for artisanal and gourmet food manufacturers.

  • 2.1 million tons of plant-based ingredients consumed in France in 2024
  • 18% of premium food brands used locally sourced plant-based ingredients in 2024
  • 2,760 product launches incorporated French-grown functional ingredients in 2024

Outlook for Plant-Based Ingredients Market in the United Kingdom

The UK plant-based ingredients revenue is expected to grow at a CAGR of 13.8% from 2025 to 2035, underperforming the global average by 1.0%. Demand is driven by strong consumer interest in health and wellness products and growing vegan population. London-based food technology companies lead in innovative ingredient development. Brexit-related supply chain adjustments and sustainability mandates are reshaping sourcing patterns while creating opportunities for domestic ingredient production.

  • 1.8 million tons of plant-based ingredients consumed in UK markets in 2024
  • 65% of major food manufacturers expanded plant-based ingredient usage
  • 1,940 new plant-based ingredient applications launched in the UK in 2024

Demand Analysis for Plant-Based Ingredients Market in USA

Sales of plant-based ingredients in USA, accounting for around 13.2% CAGR of the total market share. Its dominance is fueled by a strong ecosystem of major manufacturers like ADM, Cargill, and Ingredion, along with widespread consumer demand for sustainable, allergen-free, and clean-label products. The growing popularity of flexitarian and vegan lifestyles, along with increasing lactose and gluten intolerance, has further accelerated adoption.

The USA food industry is witnessing a shift in formulation strategies, where plant-based proteins, dairy substitutes, and meat alternatives are replacing traditional ingredients. Robust R&D, favorable government labeling standards, and investor support in food-tech startups are also propelling the market forward. With advanced manufacturing, diverse raw material access, and a mature retail environment, the USA is expected to remain the innovation hub and volume leader for plant-based ingredients.
  • Growing awareness of health and fitness among the population
  • Rising demand for plant-based dairy and meat alternatives
  • Heavy investments from companies like Cargill and ADM

Competitive Landscape for Plant-Based Ingredients Market

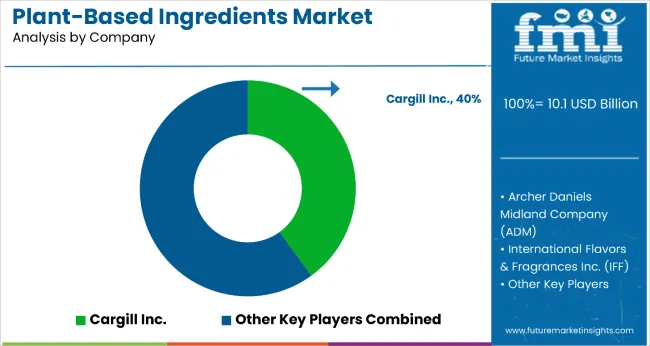
Plant Based Ingredients Market Analysis By Company

The market is moderately fragmented, led by Cargill Inc with a 40% market share. The company holds a leading position through its comprehensive R&D capabilities, global distribution network, and strong brand portfolio across plant-based nutrition and functional food segments.

Dominant player status is held exclusively by Nestle SA. Key players include Danone S.A., Beyond Meat Inc., Kerry Group, BASF SE, Ingredion Inc., Cargill Inc., Archer-Daniels-Midland Company, DuPont Nutrition & Biosciences, Chr. Hansen, Ajinomoto Co. Ltd., Tate & Lyle PLC, Beneo GmbH, Sensus B.V., and A & B Ingredients, each providing specialized plant-based ingredients for functional foods, beverages, dietary supplements, and alternative protein applications across diverse consumer markets.

Emerging players face barriers due to regulatory requirements, scientific validation needs, and established supplier relationships with major food manufacturers. Market demand is driven by health consciousness trends, sustainability concerns, and expanding applications in functional nutrition and personalized dietary solutions.

Key Developments in Plant-Based Ingredients Market

  • In February 2025, Beyond Meat introduced two new pre-seasoned Beyond Steak flavors, Chimichurri and Korean BBQ-Style, at Sprouts Farmers Market stores nationwide, enhancing its plant-based meat offerings with high-protein, low-saturated-fat products that meet key nutritional standards.
  • In March 2024, The Kraft Heinz Not Company launched Oscar Mayer’s first-ever plant-based NotHotDogs and NotSausages, marking the joint venture’s entry into plant-based meats and reimagining a 140-year-old brand with a modern, plant-based offering.

Scope of the Report - Plant-Based Ingredients Market

Item Value
Quantitative Units USD 10.1 Billion
Type Staple Food, Specialty Food, Dairy Substitutes, Food Additives, Nutrients & Supplements
Claims GMO, Non-GMO, Organic
Sales Channel Direct Sales, Modern Trade, Convenience Stores, Specialty Stores, Small Groceries, Online Retail, Other Sales Channel
End Use Food & Beverages, Cosmetics & Personal Care, Nutraceuticals, Agricultural
Buyer Type HoReca, Food Processors & Manufacturers, Household & Residential
Regions Covered North America, Europe, Asia-Pacific, Latin America, Middle East & Africa
Country Covered United States, Canada, Germany, France, United Kingdom, China, Japan, India, Brazil, South Africa, Australia, and 40+ countries
Key Companies Profiled Ingredion Inc., Archer-Daniels-Midland Company, DuPont de Nemours, Inc., Cargill Inc., Puris Proteins LLC, BI Nutraceuticals Inc., Olam International, SunOpta Inc., Dohler GmbH, The Scoular Company, Trader Joe’s, Simply Balanced, Sweet Earth Natural Foods, Lightlife.
Additional Attributes Dollar sales by product type and application sector, growing usage in functional foods and health-conscious applications, stable demand in plant-based alternatives and dietary supplements, innovations in fermentation technology and bioactive compounds improve ingredient functionality, nutritional profile, and consumer acceptance

Key Segments

By Type:

  • Staple Food
  • Specialty Food
  • Dairy Substitutes
  • Food Additives
  • Nutrients & Supplements

By Claims:

  • GMO
  • Non-GMO
  • Organic

By Sales Channel:

  • Direct Sales
  • Modern Trade
  • Convenience Stores
  • Specialty Stores
  • Small Groceries
  • Online Retail
  • Other Sales Channel

By End Use:

  • Food & Beverages
  • Cosmetics & Personal Care
  • Nutraceuticals
  • Agricultural

By Buyer Type:

  • HoReca
  • Food Processors & Manufacturers
  • Household & Residential

By Region:

  • North America
  • Latin America
  • Western Europe
  • Eastern Europe
  • East Asia
  • South Asia & Pacific
  • Middle East and Africa

Table of Content

  1. Executive Summary
    • Global Market Outlook
    • Demand-side Trends
    • Supply-side Trends
    • Technology Roadmap Analysis
    • Analysis and Recommendations
  2. Market Overview
    • Market Coverage / Taxonomy
    • Market Definition / Scope / Limitations
  3. Market Background
    • Market Dynamics
      • Drivers
      • Restraints
      • Opportunity
      • Trends
    • Scenario Forecast
      • Demand in Optimistic Scenario
      • Demand in Likely Scenario
      • Demand in Conservative Scenario
    • Opportunity Map Analysis
    • Product Life Cycle Analysis
    • Supply Chain Analysis
      • Supply Side Participants and their Roles
        • Producers
        • Mid-Level Participants (Traders/ Agents/ Brokers)
        • Wholesalers and Distributors
      • Value Added and Value Created at Node in the Supply Chain
      • List of Raw Material Suppliers
      • List of Existing and Potential Buyer’s
    • Investment Feasibility Matrix
    • Value Chain Analysis
      • Profit Margin Analysis
      • Wholesalers and Distributors
      • Retailers
    • PESTLE and Porter’s Analysis
    • Regulatory Landscape
      • By Key Regions
      • By Key Countries
    • Regional Parent Market Outlook
    • Production and Consumption Statistics
    • Import and Export Statistics
  4. Global Market Analysis 2020 to 2024 and Forecast, 2025 to 2035
    • Historical Market Size Value (USD Billion) & Volume (Metric Tons) Analysis, 2020 to 2024
    • Current and Future Market Size Value (USD Billion) & Volume (Metric Tons) Projections, 2025 to 2035
      • Y-o-Y Growth Trend Analysis
      • Absolute $ Opportunity Analysis
  5. Global Market Pricing Analysis 2020 to 2024 and Forecast 2025 to 2035
  6. Global Market Analysis 2020 to 2024 and Forecast 2025 to 2035, By Type
    • Introduction / Key Findings
    • Historical Market Size Value (USD Billion) & Volume (Metric Tons) Analysis By Type, 2020 to 2024
    • Current and Future Market Size Value (USD Billion) & Volume (Metric Tons) Analysis and Forecast By Type, 2025 to 2035
      • Staple Food
      • Specialty Food
      • Dairy Substitutes
      • Food Additives
      • Nutrients & Supplements
    • Y-o-Y Growth Trend Analysis By Type, 2020 to 2024
    • Absolute $ Opportunity Analysis By Type, 2025 to 2035
  7. Global Market Analysis 2020 to 2024 and Forecast 2025 to 2035, By Claims
    • Introduction / Key Findings
    • Historical Market Size Value (USD Billion) & Volume (Metric Tons) Analysis By Claims, 2020 to 2024
    • Current and Future Market Size Value (USD Billion) & Volume (Metric Tons) Analysis and Forecast By Claims, 2025 to 2035
      • GMO
      • Non-GMO
      • Organic
    • Y-o-Y Growth Trend Analysis By Claims, 2020 to 2024
    • Absolute $ Opportunity Analysis By Claims, 2025 to 2035
  8. Global Market Analysis 2020 to 2024 and Forecast 2025 to 2035, By Sales Channel
    • Introduction / Key Findings
    • Historical Market Size Value (USD Billion) & Volume (Metric Tons) Analysis By Sales Channel, 2020 to 2024
    • Current and Future Market Size Value (USD Billion) & Volume (Metric Tons) Analysis and Forecast By Sales Channel, 2025 to 2035
      • Direct Sales
      • Modern Trade
      • Convenience Stores
      • Specialty Stores
      • Small Groceries
      • Online Retail
      • Other Sales Channel
    • Y-o-Y Growth Trend Analysis By Sales Channel, 2020 to 2024
    • Absolute $ Opportunity Analysis By Sales Channel, 2025 to 2035
  9. Global Market Analysis 2020 to 2024 and Forecast 2025 to 2035, By End Use
    • Introduction / Key Findings
    • Historical Market Size Value (USD Billion) & Volume (Metric Tons) Analysis By End Use, 2020 to 2024
    • Current and Future Market Size Value (USD Billion) & Volume (Metric Tons) Analysis and Forecast By End Use, 2025 to 2035
      • Food & Beverages
      • Cosmetics & Personal Care
      • Nutraceuticals
      • Agricultural
    • Y-o-Y Growth Trend Analysis By End Use, 2020 to 2024
    • Absolute $ Opportunity Analysis By End Use, 2025 to 2035
  10. Global Market Analysis 2020 to 2024 and Forecast 2025 to 2035, By Buyer Type
    • Introduction / Key Findings
    • Historical Market Size Value (USD Billion) & Volume (Metric Tons) Analysis By Buyer Type, 2020 to 2024
    • Current and Future Market Size Value (USD Billion) & Volume (Metric Tons) Analysis and Forecast By Buyer Type, 2025 to 2035
      • HoReca
      • Food Processors & Manufacturers
      • Household & Residential
    • Y-o-Y Growth Trend Analysis By Buyer Type, 2020 to 2024
    • Absolute $ Opportunity Analysis By Buyer Type, 2025 to 2035
  11. Global Market Analysis 2020 to 2024 and Forecast 2025 to 2035, By Region
    • Introduction
    • Historical Market Size Value (USD Billion) & Volume (Metric Tons) Analysis By Region, 2020 to 2024
    • Current Market Size Value (USD Billion) & Volume (Metric Tons) Analysis and Forecast By Region, 2025 to 2035
      • North America
      • Latin America
      • Western Europe
      • Eastern Europe
      • East Asia
      • South Asia & Pacific
      • Middle East and Africa
    • Market Attractiveness Analysis By Region
  12. North America Market Analysis 2020 to 2024 and Forecast 2025 to 2035, By Country
    • Historical Market Size Value (USD Billion) & Volume (Metric Tons) Trend Analysis By Market Taxonomy, 2020 to 2024
    • Market Size Value (USD Billion) & Volume (Metric Tons) Forecast By Market Taxonomy, 2025 to 2035
      • By Country
        • USA
        • Canada
        • Mexico
      • By Type
      • By Claims
      • By Sales Channel
      • By End Use
      • By Buyer Type
    • Market Attractiveness Analysis
      • By Country
      • By Type
      • By Claims
      • By Sales Channel
      • By End Use
      • By Buyer Type
    • Key Takeaways
  13. Latin America Market Analysis 2020 to 2024 and Forecast 2025 to 2035, By Country
    • Historical Market Size Value (USD Billion) & Volume (Metric Tons) Trend Analysis By Market Taxonomy, 2020 to 2024
    • Market Size Value (USD Billion) & Volume (Metric Tons) Forecast By Market Taxonomy, 2025 to 2035
      • By Country
        • Brazil
        • Argentina
        • Rest of LATAM
      • By Type
      • By Claims
      • By Sales Channel
      • By End Use
      • By Buyer Type
    • Market Attractiveness Analysis
      • By Country
      • By Type
      • By Claims
      • By Sales Channel
      • By End Use
      • By Buyer Type
    • Key Takeaways
  14. Western Europe Market Analysis 2020 to 2024 and Forecast 2025 to 2035, By Country
    • Historical Market Size Value (USD Billion) & Volume (Metric Tons) Trend Analysis By Market Taxonomy, 2020 to 2024
    • Market Size Value (USD Billion) & Volume (Metric Tons) Forecast By Market Taxonomy, 2025 to 2035
      • By Country
        • Germany
        • Italy
        • France
        • UK
        • Spain
        • BENELUX
        • Nordic
        • Rest of W.Europe
      • By Type
      • By Claims
      • By Sales Channel
      • By End Use
      • By Buyer Type
    • Market Attractiveness Analysis
      • By Country
      • By Type
      • By Claims
      • By Sales Channel
      • By End Use
      • By Buyer Type
    • Key Takeaways
  15. Eastern Europe Market Analysis 2020 to 2024 and Forecast 2025 to 2035, By Country
    • Historical Market Size Value (USD Billion) & Volume (Metric Tons) Trend Analysis By Market Taxonomy, 2020 to 2024
    • Market Size Value (USD Billion) & Volume (Metric Tons) Forecast By Market Taxonomy, 2025 to 2035
      • By Country
        • Russia
        • Hungary
        • Poland
        • Balkan & Baltics
        • Rest of E. Europe
      • By Type
      • By Claims
      • By Sales Channel
      • By End Use
      • By Buyer Type
    • Market Attractiveness Analysis
      • By Country
      • By Type
      • By Claims
      • By Sales Channel
      • By End Use
      • By Buyer Type
    • Key Takeaways
  16. East Asia Market Analysis 2020 to 2024 and Forecast 2025 to 2035, By Country
    • Historical Market Size Value (USD Billion) & Volume (Metric Tons) Trend Analysis By Market Taxonomy, 2020 to 2024
    • Market Size Value (USD Billion) & Volume (Metric Tons) Forecast By Market Taxonomy, 2025 to 2035
      • By Country
        • China
        • Japan
        • South Korea
      • By Type
      • By Claims
      • By Sales Channel
      • By End Use
      • By Buyer Type
    • Market Attractiveness Analysis
      • By Country
      • By Type
      • By Claims
      • By Sales Channel
      • By End Use
      • By Buyer Type
    • Key Takeaways
  17. South Asia & Pacific Market Analysis 2020 to 2024 and Forecast 2025 to 2035, By Country
    • Historical Market Size Value (USD Billion) & Volume (Metric Tons) Trend Analysis By Market Taxonomy, 2020 to 2024
    • Market Size Value (USD Billion) & Volume (Metric Tons) Forecast By Market Taxonomy, 2025 to 2035
      • By Country
        • India
        • Australia & New Zealand
        • ASEAN
        • Rest of SAP
      • By Type
      • By Claims
      • By Sales Channel
      • By End Use
      • By Buyer Type
    • Market Attractiveness Analysis
      • By Country
      • By Type
      • By Claims
      • By Sales Channel
      • By End Use
      • By Buyer Type
    • Key Takeaways
  18. Middle East and Africa Market Analysis 2020 to 2024 and Forecast 2025 to 2035, By Country
    • Historical Market Size Value (USD Billion) & Volume (Metric Tons) Trend Analysis By Market Taxonomy, 2020 to 2024
    • Market Size Value (USD Billion) & Volume (Metric Tons) Forecast By Market Taxonomy, 2025 to 2035
      • By Country
        • GCC Countries
        • Northern Africa
        • South Africa
        • Turkiye
        • Rest of MEA
      • By Type
      • By Claims
      • By Sales Channel
      • By End Use
      • By Buyer Type
    • Market Attractiveness Analysis
      • By Country
      • By Type
      • By Claims
      • By Sales Channel
      • By End Use
      • By Buyer Type
    • Key Takeaways
  19. Key Countries Market Analysis
    • USA
      • Pricing Analysis
      • Market Share Analysis, 2024
        • By Type
        • By Claims
        • By Sales Channel
        • By End Use
        • By Buyer Type
    • Canada
      • Pricing Analysis
      • Market Share Analysis, 2024
        • By Type
        • By Claims
        • By Sales Channel
        • By End Use
        • By Buyer Type
    • Brazil
      • Pricing Analysis
      • Market Share Analysis, 2024
        • By Type
        • By Claims
        • By Sales Channel
        • By End Use
        • By Buyer Type
    • Mexico
      • Pricing Analysis
      • Market Share Analysis, 2024
        • By Type
        • By Claims
        • By Sales Channel
        • By End Use
        • By Buyer Type
    • Argentina
      • Pricing Analysis
      • Market Share Analysis, 2024
        • By Type
        • By Claims
        • By Sales Channel
        • By End Use
        • By Buyer Type
  20. Market Structure Analysis
    • Competition Dashboard
    • Competition Benchmarking
    • Market Share Analysis of Top Players
      • By Regional
      • By Type
      • By Claims
      • By Sales Channel
      • By End Use
      • By Buyer Type
  21. Competition Analysis
    • Competition Deep Dive
      • Ingredion Inc.
        • Overview
        • Product Portfolio
        • Profitability by Market Segments (Product/Age /Sales Channel/Region)
        • Sales Footprint
        • Strategy Overview
          • Marketing Strategy
          • Product Strategy
          • Channel Strategy
      • Archer-Daniels-Midland Company
        • Overview
        • Product Portfolio
        • Profitability by Market Segments (Product/Age /Sales Channel/Region)
        • Sales Footprint
        • Strategy Overview
          • Marketing Strategy
          • Product Strategy
          • Channel Strategy
      • DuPont de Nemours, Inc.
        • Overview
        • Product Portfolio
        • Profitability by Market Segments (Product/Age /Sales Channel/Region)
        • Sales Footprint
        • Strategy Overview
          • Marketing Strategy
          • Product Strategy
          • Channel Strategy
      • Cargill Inc.
        • Overview
        • Product Portfolio
        • Profitability by Market Segments (Product/Age /Sales Channel/Region)
        • Sales Footprint
        • Strategy Overview
          • Marketing Strategy
          • Product Strategy
          • Channel Strategy
      • Puris Proteins LLC
        • Overview
        • Product Portfolio
        • Profitability by Market Segments (Product/Age /Sales Channel/Region)
        • Sales Footprint
        • Strategy Overview
          • Marketing Strategy
          • Product Strategy
          • Channel Strategy
      • BI Nutraceuticals Inc.
        • Overview
        • Product Portfolio
        • Profitability by Market Segments (Product/Age /Sales Channel/Region)
        • Sales Footprint
        • Strategy Overview
          • Marketing Strategy
          • Product Strategy
          • Channel Strategy
      • Olam International
        • Overview
        • Product Portfolio
        • Profitability by Market Segments (Product/Age /Sales Channel/Region)
        • Sales Footprint
        • Strategy Overview
          • Marketing Strategy
          • Product Strategy
          • Channel Strategy
      • SunOpta Inc.
        • Overview
        • Product Portfolio
        • Profitability by Market Segments (Product/Age /Sales Channel/Region)
        • Sales Footprint
        • Strategy Overview
          • Marketing Strategy
          • Product Strategy
          • Channel Strategy
      • Dohler GmbH
        • Overview
        • Product Portfolio
        • Profitability by Market Segments (Product/Age /Sales Channel/Region)
        • Sales Footprint
        • Strategy Overview
          • Marketing Strategy
          • Product Strategy
          • Channel Strategy
      • The Scoular Company
        • Overview
        • Product Portfolio
        • Profitability by Market Segments (Product/Age /Sales Channel/Region)
        • Sales Footprint
        • Strategy Overview
          • Marketing Strategy
          • Product Strategy
          • Channel Strategy
      • Trader Joe’s
        • Overview
        • Product Portfolio
        • Profitability by Market Segments (Product/Age /Sales Channel/Region)
        • Sales Footprint
        • Strategy Overview
          • Marketing Strategy
          • Product Strategy
          • Channel Strategy
      • Simply Balanced
        • Overview
        • Product Portfolio
        • Profitability by Market Segments (Product/Age /Sales Channel/Region)
        • Sales Footprint
        • Strategy Overview
          • Marketing Strategy
          • Product Strategy
          • Channel Strategy
      • Sweet Earth Natural Foods
        • Overview
        • Product Portfolio
        • Profitability by Market Segments (Product/Age /Sales Channel/Region)
        • Sales Footprint
        • Strategy Overview
          • Marketing Strategy
          • Product Strategy
          • Channel Strategy
      • Lightlife
        • Overview
        • Product Portfolio
        • Profitability by Market Segments (Product/Age /Sales Channel/Region)
        • Sales Footprint
        • Strategy Overview
          • Marketing Strategy
          • Product Strategy
          • Channel Strategy
  22. Assumptions & Acronyms Used
  23. Research Methodology

List of Tables

  • Table 1: Global Market Value (USD Billion) Forecast by Region, 2020-2035
  • Table 2: Global Market Volume (Metric Tons) Forecast by Region, 2020-2035
  • Table 3: Global Market Value (USD Billion) Forecast by Type, 2020-2035
  • Table 4: Global Market Volume (Metric Tons) Forecast by Type, 2020-2035
  • Table 5: Global Market Value (USD Billion) Forecast by Claims, 2020-2035
  • Table 6: Global Market Volume (Metric Tons) Forecast by Claims, 2020-2035
  • Table 7: Global Market Value (USD Billion) Forecast by Sales Channel, 2020-2035
  • Table 8: Global Market Volume (Metric Tons) Forecast by Sales Channel, 2020-2035
  • Table 9: Global Market Value (USD Billion) Forecast by End Use, 2020-2035
  • Table 10: Global Market Volume (Metric Tons) Forecast by End Use, 2020-2035
  • Table 11: Global Market Value (USD Billion) Forecast by Buyer Type, 2020-2035
  • Table 12: Global Market Volume (Metric Tons) Forecast by Buyer Type, 2020-2035
  • Table 13: North America Market Value (USD Billion) Forecast by Country, 2020-2035
  • Table 14: North America Market Volume (Metric Tons) Forecast by Country, 2020-2035
  • Table 15: North America Market Value (USD Billion) Forecast by Type, 2020-2035
  • Table 16: North America Market Volume (Metric Tons) Forecast by Type, 2020-2035
  • Table 17: North America Market Value (USD Billion) Forecast by Claims, 2020-2035
  • Table 18: North America Market Volume (Metric Tons) Forecast by Claims, 2020-2035
  • Table 19: North America Market Value (USD Billion) Forecast by Sales Channel, 2020-2035
  • Table 20: North America Market Volume (Metric Tons) Forecast by Sales Channel, 2020-2035
  • Table 21: North America Market Value (USD Billion) Forecast by End Use, 2020-2035
  • Table 22: North America Market Volume (Metric Tons) Forecast by End Use, 2020-2035
  • Table 23: North America Market Value (USD Billion) Forecast by Buyer Type, 2020-2035
  • Table 24: North America Market Volume (Metric Tons) Forecast by Buyer Type, 2020-2035
  • Table 25: Latin America Market Value (USD Billion) Forecast by Country, 2020-2035
  • Table 26: Latin America Market Volume (Metric Tons) Forecast by Country, 2020-2035
  • Table 27: Latin America Market Value (USD Billion) Forecast by Type, 2020-2035
  • Table 28: Latin America Market Volume (Metric Tons) Forecast by Type, 2020-2035
  • Table 29: Latin America Market Value (USD Billion) Forecast by Claims, 2020-2035
  • Table 30: Latin America Market Volume (Metric Tons) Forecast by Claims, 2020-2035
  • Table 31: Latin America Market Value (USD Billion) Forecast by Sales Channel, 2020-2035
  • Table 32: Latin America Market Volume (Metric Tons) Forecast by Sales Channel, 2020-2035
  • Table 33: Latin America Market Value (USD Billion) Forecast by End Use, 2020-2035
  • Table 34: Latin America Market Volume (Metric Tons) Forecast by End Use, 2020-2035
  • Table 35: Latin America Market Value (USD Billion) Forecast by Buyer Type, 2020-2035
  • Table 36: Latin America Market Volume (Metric Tons) Forecast by Buyer Type, 2020-2035
  • Table 37: Western Europe Market Value (USD Billion) Forecast by Country, 2020-2035
  • Table 38: Western Europe Market Volume (Metric Tons) Forecast by Country, 2020-2035
  • Table 39: Western Europe Market Value (USD Billion) Forecast by Type, 2020-2035
  • Table 40: Western Europe Market Volume (Metric Tons) Forecast by Type, 2020-2035
  • Table 41: Western Europe Market Value (USD Billion) Forecast by Claims, 2020-2035
  • Table 42: Western Europe Market Volume (Metric Tons) Forecast by Claims, 2020-2035
  • Table 43: Western Europe Market Value (USD Billion) Forecast by Sales Channel, 2020-2035
  • Table 44: Western Europe Market Volume (Metric Tons) Forecast by Sales Channel, 2020-2035
  • Table 45: Western Europe Market Value (USD Billion) Forecast by End Use, 2020-2035
  • Table 46: Western Europe Market Volume (Metric Tons) Forecast by End Use, 2020-2035
  • Table 47: Western Europe Market Value (USD Billion) Forecast by Buyer Type, 2020-2035
  • Table 48: Western Europe Market Volume (Metric Tons) Forecast by Buyer Type, 2020-2035
  • Table 49: Eastern Europe Market Value (USD Billion) Forecast by Country, 2020-2035
  • Table 50: Eastern Europe Market Volume (Metric Tons) Forecast by Country, 2020-2035
  • Table 51: Eastern Europe Market Value (USD Billion) Forecast by Type, 2020-2035
  • Table 52: Eastern Europe Market Volume (Metric Tons) Forecast by Type, 2020-2035
  • Table 53: Eastern Europe Market Value (USD Billion) Forecast by Claims, 2020-2035
  • Table 54: Eastern Europe Market Volume (Metric Tons) Forecast by Claims, 2020-2035
  • Table 55: Eastern Europe Market Value (USD Billion) Forecast by Sales Channel, 2020-2035
  • Table 56: Eastern Europe Market Volume (Metric Tons) Forecast by Sales Channel, 2020-2035
  • Table 57: Eastern Europe Market Value (USD Billion) Forecast by End Use, 2020-2035
  • Table 58: Eastern Europe Market Volume (Metric Tons) Forecast by End Use, 2020-2035
  • Table 59: Eastern Europe Market Value (USD Billion) Forecast by Buyer Type, 2020-2035
  • Table 60: Eastern Europe Market Volume (Metric Tons) Forecast by Buyer Type, 2020-2035
  • Table 61: East Asia Market Value (USD Billion) Forecast by Country, 2020-2035
  • Table 62: East Asia Market Volume (Metric Tons) Forecast by Country, 2020-2035
  • Table 63: East Asia Market Value (USD Billion) Forecast by Type, 2020-2035
  • Table 64: East Asia Market Volume (Metric Tons) Forecast by Type, 2020-2035
  • Table 65: East Asia Market Value (USD Billion) Forecast by Claims, 2020-2035
  • Table 66: East Asia Market Volume (Metric Tons) Forecast by Claims, 2020-2035
  • Table 67: East Asia Market Value (USD Billion) Forecast by Sales Channel, 2020-2035
  • Table 68: East Asia Market Volume (Metric Tons) Forecast by Sales Channel, 2020-2035
  • Table 69: East Asia Market Value (USD Billion) Forecast by End Use, 2020-2035
  • Table 70: East Asia Market Volume (Metric Tons) Forecast by End Use, 2020-2035
  • Table 71: East Asia Market Value (USD Billion) Forecast by Buyer Type, 2020-2035
  • Table 72: East Asia Market Volume (Metric Tons) Forecast by Buyer Type, 2020-2035
  • Table 73: South Asia & Pacific Market Value (USD Billion) Forecast by Country, 2020-2035
  • Table 74: South Asia & Pacific Market Volume (Metric Tons) Forecast by Country, 2020-2035
  • Table 75: South Asia & Pacific Market Value (USD Billion) Forecast by Type, 2020-2035
  • Table 76: South Asia & Pacific Market Volume (Metric Tons) Forecast by Type, 2020-2035
  • Table 77: South Asia & Pacific Market Value (USD Billion) Forecast by Claims, 2020-2035
  • Table 78: South Asia & Pacific Market Volume (Metric Tons) Forecast by Claims, 2020-2035
  • Table 79: South Asia & Pacific Market Value (USD Billion) Forecast by Sales Channel, 2020-2035
  • Table 80: South Asia & Pacific Market Volume (Metric Tons) Forecast by Sales Channel, 2020-2035
  • Table 81: South Asia & Pacific Market Value (USD Billion) Forecast by End Use, 2020-2035
  • Table 82: South Asia & Pacific Market Volume (Metric Tons) Forecast by End Use, 2020-2035
  • Table 83: South Asia & Pacific Market Value (USD Billion) Forecast by Buyer Type, 2020-2035
  • Table 84: South Asia & Pacific Market Volume (Metric Tons) Forecast by Buyer Type, 2020-2035
  • Table 85: Middle East and Africa Market Value (USD Billion) Forecast by Country, 2020-2035
  • Table 86: Middle East and Africa Market Volume (Metric Tons) Forecast by Country, 2020-2035
  • Table 87: Middle East and Africa Market Value (USD Billion) Forecast by Type, 2020-2035
  • Table 88: Middle East and Africa Market Volume (Metric Tons) Forecast by Type, 2020-2035
  • Table 89: Middle East and Africa Market Value (USD Billion) Forecast by Claims, 2020-2035
  • Table 90: Middle East and Africa Market Volume (Metric Tons) Forecast by Claims, 2020-2035
  • Table 91: Middle East and Africa Market Value (USD Billion) Forecast by Sales Channel, 2020-2035
  • Table 92: Middle East and Africa Market Volume (Metric Tons) Forecast by Sales Channel, 2020-2035
  • Table 93: Middle East and Africa Market Value (USD Billion) Forecast by End Use, 2020-2035
  • Table 94: Middle East and Africa Market Volume (Metric Tons) Forecast by End Use, 2020-2035
  • Table 95: Middle East and Africa Market Value (USD Billion) Forecast by Buyer Type, 2020-2035
  • Table 96: Middle East and Africa Market Volume (Metric Tons) Forecast by Buyer Type, 2020-2035

List of Figures

  • Figure 1: Global Market Volume (Metric Tons) Forecast 2020-2035
  • Figure 2: Global Market Pricing Analysis
  • Figure 3: Global Market Value (USD Billion) Forecast 2020-2035
  • Figure 4: Global Market Value Share and BPS Analysis by Type, 2025 and 2035
  • Figure 5: Global Market Y-o-Y Growth Comparison by Type, 2025-2035
  • Figure 6: Global Market Attractiveness Analysis by Type
  • Figure 7: Global Market Value Share and BPS Analysis by Claims, 2025 and 2035
  • Figure 8: Global Market Y-o-Y Growth Comparison by Claims, 2025-2035
  • Figure 9: Global Market Attractiveness Analysis by Claims
  • Figure 10: Global Market Value Share and BPS Analysis by Sales Channel, 2025 and 2035
  • Figure 11: Global Market Y-o-Y Growth Comparison by Sales Channel, 2025-2035
  • Figure 12: Global Market Attractiveness Analysis by Sales Channel
  • Figure 13: Global Market Value Share and BPS Analysis by End Use, 2025 and 2035
  • Figure 14: Global Market Y-o-Y Growth Comparison by End Use, 2025-2035
  • Figure 15: Global Market Attractiveness Analysis by End Use
  • Figure 16: Global Market Value Share and BPS Analysis by Buyer Type, 2025 and 2035
  • Figure 17: Global Market Y-o-Y Growth Comparison by Buyer Type, 2025-2035
  • Figure 18: Global Market Attractiveness Analysis by Buyer Type
  • Figure 19: Global Market Value (USD Billion) Share and BPS Analysis by Region, 2025 and 2035
  • Figure 20: Global Market Y-o-Y Growth Comparison by Region, 2025-2035
  • Figure 21: Global Market Attractiveness Analysis by Region
  • Figure 22: North America Market Incremental $ Opportunity, 2025-2035
  • Figure 23: Latin America Market Incremental $ Opportunity, 2025-2035
  • Figure 24: Western Europe Market Incremental $ Opportunity, 2025-2035
  • Figure 25: Eastern Europe Market Incremental $ Opportunity, 2025-2035
  • Figure 26: East Asia Market Incremental $ Opportunity, 2025-2035
  • Figure 27: South Asia & Pacific Market Incremental $ Opportunity, 2025-2035
  • Figure 28: Middle East and Africa Market Incremental $ Opportunity, 2025-2035
  • Figure 29: North America Market Value Share and BPS Analysis by Country, 2025 and 2035
  • Figure 30: North America Market Value Share and BPS Analysis by Type, 2025 and 2035
  • Figure 31: North America Market Y-o-Y Growth Comparison by Type, 2025-2035
  • Figure 32: North America Market Attractiveness Analysis by Type
  • Figure 33: North America Market Value Share and BPS Analysis by Claims, 2025 and 2035
  • Figure 34: North America Market Y-o-Y Growth Comparison by Claims, 2025-2035
  • Figure 35: North America Market Attractiveness Analysis by Claims
  • Figure 36: North America Market Value Share and BPS Analysis by Sales Channel, 2025 and 2035
  • Figure 37: North America Market Y-o-Y Growth Comparison by Sales Channel, 2025-2035
  • Figure 38: North America Market Attractiveness Analysis by Sales Channel
  • Figure 39: North America Market Value Share and BPS Analysis by End Use, 2025 and 2035
  • Figure 40: North America Market Y-o-Y Growth Comparison by End Use, 2025-2035
  • Figure 41: North America Market Attractiveness Analysis by End Use
  • Figure 42: North America Market Value Share and BPS Analysis by Buyer Type, 2025 and 2035
  • Figure 43: North America Market Y-o-Y Growth Comparison by Buyer Type, 2025-2035
  • Figure 44: North America Market Attractiveness Analysis by Buyer Type
  • Figure 45: Latin America Market Value Share and BPS Analysis by Country, 2025 and 2035
  • Figure 46: Latin America Market Value Share and BPS Analysis by Type, 2025 and 2035
  • Figure 47: Latin America Market Y-o-Y Growth Comparison by Type, 2025-2035
  • Figure 48: Latin America Market Attractiveness Analysis by Type
  • Figure 49: Latin America Market Value Share and BPS Analysis by Claims, 2025 and 2035
  • Figure 50: Latin America Market Y-o-Y Growth Comparison by Claims, 2025-2035
  • Figure 51: Latin America Market Attractiveness Analysis by Claims
  • Figure 52: Latin America Market Value Share and BPS Analysis by Sales Channel, 2025 and 2035
  • Figure 53: Latin America Market Y-o-Y Growth Comparison by Sales Channel, 2025-2035
  • Figure 54: Latin America Market Attractiveness Analysis by Sales Channel
  • Figure 55: Latin America Market Value Share and BPS Analysis by End Use, 2025 and 2035
  • Figure 56: Latin America Market Y-o-Y Growth Comparison by End Use, 2025-2035
  • Figure 57: Latin America Market Attractiveness Analysis by End Use
  • Figure 58: Latin America Market Value Share and BPS Analysis by Buyer Type, 2025 and 2035
  • Figure 59: Latin America Market Y-o-Y Growth Comparison by Buyer Type, 2025-2035
  • Figure 60: Latin America Market Attractiveness Analysis by Buyer Type
  • Figure 61: Western Europe Market Value Share and BPS Analysis by Country, 2025 and 2035
  • Figure 62: Western Europe Market Value Share and BPS Analysis by Type, 2025 and 2035
  • Figure 63: Western Europe Market Y-o-Y Growth Comparison by Type, 2025-2035
  • Figure 64: Western Europe Market Attractiveness Analysis by Type
  • Figure 65: Western Europe Market Value Share and BPS Analysis by Claims, 2025 and 2035
  • Figure 66: Western Europe Market Y-o-Y Growth Comparison by Claims, 2025-2035
  • Figure 67: Western Europe Market Attractiveness Analysis by Claims
  • Figure 68: Western Europe Market Value Share and BPS Analysis by Sales Channel, 2025 and 2035
  • Figure 69: Western Europe Market Y-o-Y Growth Comparison by Sales Channel, 2025-2035
  • Figure 70: Western Europe Market Attractiveness Analysis by Sales Channel
  • Figure 71: Western Europe Market Value Share and BPS Analysis by End Use, 2025 and 2035
  • Figure 72: Western Europe Market Y-o-Y Growth Comparison by End Use, 2025-2035
  • Figure 73: Western Europe Market Attractiveness Analysis by End Use
  • Figure 74: Western Europe Market Value Share and BPS Analysis by Buyer Type, 2025 and 2035
  • Figure 75: Western Europe Market Y-o-Y Growth Comparison by Buyer Type, 2025-2035
  • Figure 76: Western Europe Market Attractiveness Analysis by Buyer Type
  • Figure 77: Eastern Europe Market Value Share and BPS Analysis by Country, 2025 and 2035
  • Figure 78: Eastern Europe Market Value Share and BPS Analysis by Type, 2025 and 2035
  • Figure 79: Eastern Europe Market Y-o-Y Growth Comparison by Type, 2025-2035
  • Figure 80: Eastern Europe Market Attractiveness Analysis by Type
  • Figure 81: Eastern Europe Market Value Share and BPS Analysis by Claims, 2025 and 2035
  • Figure 82: Eastern Europe Market Y-o-Y Growth Comparison by Claims, 2025-2035
  • Figure 83: Eastern Europe Market Attractiveness Analysis by Claims
  • Figure 84: Eastern Europe Market Value Share and BPS Analysis by Sales Channel, 2025 and 2035
  • Figure 85: Eastern Europe Market Y-o-Y Growth Comparison by Sales Channel, 2025-2035
  • Figure 86: Eastern Europe Market Attractiveness Analysis by Sales Channel
  • Figure 87: Eastern Europe Market Value Share and BPS Analysis by End Use, 2025 and 2035
  • Figure 88: Eastern Europe Market Y-o-Y Growth Comparison by End Use, 2025-2035
  • Figure 89: Eastern Europe Market Attractiveness Analysis by End Use
  • Figure 90: Eastern Europe Market Value Share and BPS Analysis by Buyer Type, 2025 and 2035
  • Figure 91: Eastern Europe Market Y-o-Y Growth Comparison by Buyer Type, 2025-2035
  • Figure 92: Eastern Europe Market Attractiveness Analysis by Buyer Type
  • Figure 93: East Asia Market Value Share and BPS Analysis by Country, 2025 and 2035
  • Figure 94: East Asia Market Value Share and BPS Analysis by Type, 2025 and 2035
  • Figure 95: East Asia Market Y-o-Y Growth Comparison by Type, 2025-2035
  • Figure 96: East Asia Market Attractiveness Analysis by Type
  • Figure 97: East Asia Market Value Share and BPS Analysis by Claims, 2025 and 2035
  • Figure 98: East Asia Market Y-o-Y Growth Comparison by Claims, 2025-2035
  • Figure 99: East Asia Market Attractiveness Analysis by Claims
  • Figure 100: East Asia Market Value Share and BPS Analysis by Sales Channel, 2025 and 2035
  • Figure 101: East Asia Market Y-o-Y Growth Comparison by Sales Channel, 2025-2035
  • Figure 102: East Asia Market Attractiveness Analysis by Sales Channel
  • Figure 103: East Asia Market Value Share and BPS Analysis by End Use, 2025 and 2035
  • Figure 104: East Asia Market Y-o-Y Growth Comparison by End Use, 2025-2035
  • Figure 105: East Asia Market Attractiveness Analysis by End Use
  • Figure 106: East Asia Market Value Share and BPS Analysis by Buyer Type, 2025 and 2035
  • Figure 107: East Asia Market Y-o-Y Growth Comparison by Buyer Type, 2025-2035
  • Figure 108: East Asia Market Attractiveness Analysis by Buyer Type
  • Figure 109: South Asia & Pacific Market Value Share and BPS Analysis by Country, 2025 and 2035
  • Figure 110: South Asia & Pacific Market Value Share and BPS Analysis by Type, 2025 and 2035
  • Figure 111: South Asia & Pacific Market Y-o-Y Growth Comparison by Type, 2025-2035
  • Figure 112: South Asia & Pacific Market Attractiveness Analysis by Type
  • Figure 113: South Asia & Pacific Market Value Share and BPS Analysis by Claims, 2025 and 2035
  • Figure 114: South Asia & Pacific Market Y-o-Y Growth Comparison by Claims, 2025-2035
  • Figure 115: South Asia & Pacific Market Attractiveness Analysis by Claims
  • Figure 116: South Asia & Pacific Market Value Share and BPS Analysis by Sales Channel, 2025 and 2035
  • Figure 117: South Asia & Pacific Market Y-o-Y Growth Comparison by Sales Channel, 2025-2035
  • Figure 118: South Asia & Pacific Market Attractiveness Analysis by Sales Channel
  • Figure 119: South Asia & Pacific Market Value Share and BPS Analysis by End Use, 2025 and 2035
  • Figure 120: South Asia & Pacific Market Y-o-Y Growth Comparison by End Use, 2025-2035
  • Figure 121: South Asia & Pacific Market Attractiveness Analysis by End Use
  • Figure 122: South Asia & Pacific Market Value Share and BPS Analysis by Buyer Type, 2025 and 2035
  • Figure 123: South Asia & Pacific Market Y-o-Y Growth Comparison by Buyer Type, 2025-2035
  • Figure 124: South Asia & Pacific Market Attractiveness Analysis by Buyer Type
  • Figure 125: Middle East and Africa Market Value Share and BPS Analysis by Country, 2025 and 2035
  • Figure 126: Middle East and Africa Market Value Share and BPS Analysis by Type, 2025 and 2035
  • Figure 127: Middle East and Africa Market Y-o-Y Growth Comparison by Type, 2025-2035
  • Figure 128: Middle East and Africa Market Attractiveness Analysis by Type
  • Figure 129: Middle East and Africa Market Value Share and BPS Analysis by Claims, 2025 and 2035
  • Figure 130: Middle East and Africa Market Y-o-Y Growth Comparison by Claims, 2025-2035
  • Figure 131: Middle East and Africa Market Attractiveness Analysis by Claims
  • Figure 132: Middle East and Africa Market Value Share and BPS Analysis by Sales Channel, 2025 and 2035
  • Figure 133: Middle East and Africa Market Y-o-Y Growth Comparison by Sales Channel, 2025-2035
  • Figure 134: Middle East and Africa Market Attractiveness Analysis by Sales Channel
  • Figure 135: Middle East and Africa Market Value Share and BPS Analysis by End Use, 2025 and 2035
  • Figure 136: Middle East and Africa Market Y-o-Y Growth Comparison by End Use, 2025-2035
  • Figure 137: Middle East and Africa Market Attractiveness Analysis by End Use
  • Figure 138: Middle East and Africa Market Value Share and BPS Analysis by Buyer Type, 2025 and 2035
  • Figure 139: Middle East and Africa Market Y-o-Y Growth Comparison by Buyer Type, 2025-2035
  • Figure 140: Middle East and Africa Market Attractiveness Analysis by Buyer Type
  • Figure 141: Global Market - Tier Structure Analysis
  • Figure 142: Global Market - Company Share Analysis

Frequently Asked Questions

How big is the plant-based ingredients market in 2025?

The global plant-based ingredients market is estimated to be valued at USD 10.1 billion in 2025.

What will be the size of the plant-based ingredients market in 2035?

The plant-based ingredients market is projected to reach USD 23.0 billion by 2035.

How much will the plant-based ingredients market grow between 2025 and 2035?

The plant-based ingredients market is expected to grow at a CAGR of 8.6% between 2025 and 2035.

Which type segment is projected to lead the plant-based ingredients market in 2025?

The dairy substitutes segment is projected to lead with a 20% market share in 2025.

Which end-use segment will dominate the plant-based ingredients market in 2025?

The food and beverages segment is expected to dominate with a 50% market share in 2025.

Explore Similar Insights

Future Market Insights

Plant-Based Ingredients Market