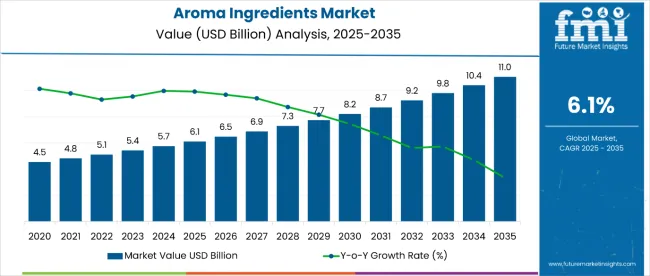
The aroma ingredients market is estimated to be valued at USD 6.1 billion in 2025 and is projected to reach USD 11 billion by 2035, registering a compound annual growth rate (CAGR) of 6.1% over the forecast period. The market is expected to add an absolute dollar opportunity of USD 4.9 billion during this period.
This reflects a 1.81 times growth at a CAGR of 6.1%. The market evolution is shaped by rising demand for natural and synthetic aroma ingredients in fine fragrances, personal care products, soaps, detergents, and household products. Increasing consumer preference for premium and personalized scents is also fueling market growth.
By 2030, the market is likely to reach USD 8.1 billion, accounting for USD 2 billion in incremental value over the first half of the decade. The remaining USD 2.8 billion is expected during the second half, suggesting a moderately back-loaded growth pattern driven by expanding applications in cosmetics, toiletries, and luxury fragrances.
Companies such as Givaudan SA, Fermenich International SA, and International Flavors & Fragrances Inc. are strengthening their competitive positions through product innovation, sustainable sourcing of natural extracts, and advanced aroma formulation technologies. Expansion into emerging markets, coupled with compliance with regulatory standards and demand for eco-friendly ingredients, is supporting market growth in fine fragrances, soaps, detergents, and personal care products globally.
| Metric | Value |
|---|---|
| Estimated Size (2025E) | USD 6.1 billion |
| Projected Value (2035F) | USD 11 billion |
| CAGR (2025-2035) | 6.1% |
The market holds a strong position within its parent industries, driven by rising adoption in personal care, food & beverages, and household applications. Within the fragrance chemicals sector, aroma ingredients represent about 72% of the market, driven by their essential role in formulating fine fragrances and perfumes. In the personal care and cosmetics market, they hold about 12%, reflecting their widespread use in soaps, toiletries, and skincare products. Within the home care products sector, aroma ingredients command roughly 8%, underscoring their importance in detergents, air fresheners, and household cleaners.
The market is being driven by increasing demand for natural and sustainable aroma solutions. Advancements in biotechnology and synthetic chemistry have enabled the development of high-quality, eco-friendly, and cost-effective aroma ingredients. Consumer preferences are shifting toward personalized, premium, and ethically sourced fragrances. Expansion in emerging markets, supported by urbanization and rising disposable incomes, is further fueling demand. This positions aroma ingredients as a critical component in modern personal care, fragrance, and home care formulations.
The aroma ingredients market is growing steadily due to increasing demand for natural and synthetic fragrances across personal care, cosmetics, and household products. Rising consumer preference for premium, personalized, and sustainable scents is driving the adoption of essential oils, aroma chemicals, and specialty compounds in fine fragrances, soaps, detergents, and skincare formulations. Products that offer long-lasting, high-quality aroma performance are particularly favored in luxury and mass-market applications.
Expansion of the cosmetics and home care industries in North America, Europe, and Asia-Pacific is further boosting market growth. Urbanization, rising disposable incomes, and increasing awareness of fragrance benefits in personal care and wellness contribute to strong adoption.
Advancements in biotechnology and green chemistry have enabled manufacturers to develop eco-friendly, cost-effective, and high-potency aroma ingredients. Companies are innovating with new formulations, sustainable sourcing, and enhanced product functionality, while collaborations with fragrance houses and retail channels expand market reach. Regulatory compliance and ethical sourcing remain key focus areas supporting long-term growth.
The market is segmented by type, application, and region. By type, the market is categorized into essential oils, aroma chemicals, menthe arvensis, cedar wood, orange, eucalyptus, citronella, terpenes, musk chemicals, benzenoids, and others. By application, the market covers cosmetics and toiletries, soaps and detergents, fine fragrances, and others (household products, aromatherapy, and pesticides). Regionally, the market spans North America, Latin America, Western Europe, Eastern Europe, South Asia and Pacific, East Asia, and the Middle East & Africa.
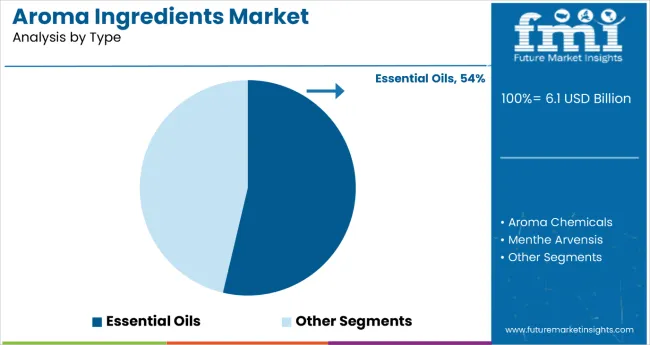
The essential oils segment holds a dominant position with 54% of the market share in the type category, supported by their natural origin, high aromatic potency, and versatility in formulation. Essential oils such as menthe arvensis, cedarwood, orange, and eucalyptus are particularly favored for premium and customized scent profiles. Their increasing integration into natural and organic product lines highlights the rising consumer shift toward sustainable and chemical-free fragrance solutions.
Manufacturers prefer essential oils due to their multifunctional benefits, ranging from therapeutic properties to wide compatibility with personal care, cosmetics, and household formulations. These oils also serve as key ingredients in clean-label products, aligning well with evolving lifestyle trends that emphasize wellness and environmental responsibility. The segment benefits from consistent demand in both developed and emerging markets, reinforcing its leadership across diverse applications.
Ongoing innovations in extraction technologies, such as cold-pressing and steam distillation, are further enhancing the quality, purity, and yield of essential oils. These advancements not only preserve aroma integrity but also expand their use in aromatherapy, wellness, and functional fragrance solutions. As consumer interest in holistic well-being continues to grow, essential oils are expected to retain their dominance by offering high-value, eco-conscious, and performance-driven solutions for the global aroma ingredients market.
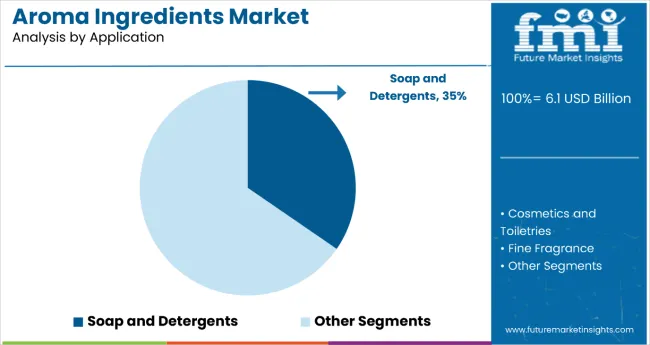
The soaps and detergents segment is set to dominate the application category in 2025, capturing around 35% of the market share, driven by the critical role of aroma ingredients in imparting long-lasting fragrance, enhancing consumer appeal, and enabling strong product differentiation. Expanding retail and e-commerce channels are increasing the accessibility of fragranced soaps and detergents, accelerating adoption across both urban and rural markets.
Aroma ingredients are indispensable in this segment as they elevate everyday cleaning products into premium experiences, blending hygiene with sensory appeal. Growing demand for eco-friendly, biodegradable, and naturally scented formulations is fueling product innovation, with companies focusing on natural extracts, stable aroma retention, and customized blends. These innovations ensure consistent performance in residential and commercial cleaning, strengthening consumer loyalty.
Rising urbanization, increasing disposable incomes, and heightened hygiene awareness continue to propel market growth. Manufacturers are also investing in sustainable sourcing and green chemistry solutions to align with regulatory requirements and consumer preferences for safer, environmentally responsible products. With these dynamics, soaps and detergents are expected to remain the cornerstone of aroma ingredient consumption, driving steady growth throughout the forecast period.
From 2025 to 2035, rising demand for natural and synthetic fragrances across personal care, cosmetics, and household products is driving substantial growth in the aroma ingredients market. Rising consumer preference for premium, personalized, and sustainably sourced fragrances is encouraging manufacturers to invest in high-quality essential oils, aroma chemicals, and specialty compounds. Aroma ingredients are increasingly used in fine fragrances, soaps, detergents, skincare, and household cleaning products, offering long-lasting performance, enhanced sensory appeal, and compatibility with diverse formulations. Regions such as North America, Europe, and Asia-Pacific are witnessing significant adoption due to urbanization, rising disposable incomes, and increasing awareness of fragrance benefits in wellness and lifestyle products.
Rising Consumer Demand Drives Aroma Ingredients Adoption
The personal care, soaps & detergents, and food & beverage industries are the largest consumers of aroma ingredients, leveraging their ability to provide long-lasting fragrance, enhance product differentiation, and improve sensory appeal. With rising global demand for premium, natural, and eco-friendly products, fragranced formulations are seeing widespread adoption. Aroma ingredients are increasingly used in natural and organic product lines, catering to consumers’ preference for chemical-free, sustainable solutions. Expanding retail and e-commerce channels and growth in urban markets further strengthen demand, while innovations in extraction technologies ensure consistent quality and potency across applications.
Regulatory Compliance Requirements and Safety Concerns Restrain Market Expansion
Market growth faces constraints due to stringent regulatory standards, such as IFRA guidelines, and concerns over allergenic or sensitizing components in certain aroma compounds. Compliance with safety and labeling requirements increases production complexity and costs, particularly for high-purity and natural ingredients. Additionally, raw material supply fluctuations, dependency on plant-derived sources, and seasonal variations in essential oil yields create challenges for large-scale manufacturing. These factors compel manufacturers to innovate with synthetic-natural blends, safer substitutes, and stable formulations while balancing consumer demand and regulatory compliance.
| Country | CAGR (2025-2035) |
|---|---|
| United States | 7.2% |
| India | 6.5% |
| Japan | 6.1% |
| China | 6.0% |
| United Kingdom | 5.8% |
| Germany | 5.5% |
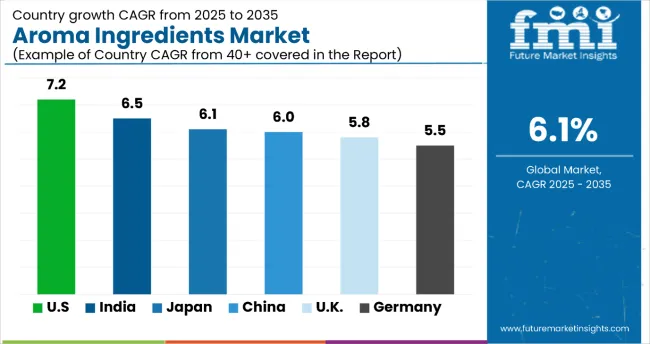
The aroma ingredients market shows varied growth trajectories across the top six countries. The United States leads the aroma ingredients market with a strong CAGR of 7.2%, driven by high demand in personal care, luxury fragrances, and household cleaning products. India shows a CAGR of 6.5%, supported by increasing adoption of natural and synthetic aroma ingredients in cosmetics and wellness products. Japan and China follow with 6.1% and 6.0% CAGR, respectively, fueled by rapid urbanization, rising disposable incomes, and growing awareness of premium fragrances.The United Kingdom (5.8%) and Germany (5.5%) reflect steady growth due to sustainable and high-quality fragrance adoption. Overall, North America and Asia-Pacific exhibit relatively faster expansion compared with Western Europe.
The report covers an in-depth analysis of 40+ countries; six top-performing OECD countries are highlighted below.
The aroma ingredients market in the United States is projected to grow at a CAGR of 7.2% from 2025 to 2035, driven by strong demand across personal care, fine fragrances, and household products. Growth is fueled by consumer preference for premium and sustainable fragrances, coupled with innovation in natural and synthetic formulations. Expansion in e-commerce and retail channels strengthens accessibility. Increasing collaborations between fragrance houses and cosmetic brands further accelerate market adoption. Regulatory focus on safety and eco-friendly formulations enhances consumer confidence.
Revenue from aroma ingredients in India is projected to grow at a CAGR of 6.5% from 2025 to 2035, supported by rapid urbanization, rising disposable incomes, and growing demand for affordable yet high-quality fragrances. Expanding consumer base in cosmetics, personal hygiene, and household care drives adoption. Investments in production technologies and natural ingredient sourcing strengthen output. Local manufacturers are focusing on expanding their international presence, supported by cost advantages. Increasing awareness of sustainable and natural products is further fueling market growth.
Sales of aroma ingredients in Japan are projected to grow at a CAGR of 6.1% from 2025 to 2035, driven by innovation in wellness products, fine fragrances, and premium cosmetics. Demand is supported by rising interest in aromatherapy, functional fragrances, and eco-friendly formulations. Consumers favor both traditional and modern scents, aligning with cultural preferences for high-quality products. Manufacturers emphasize natural and sustainable raw materials to appeal to environmentally conscious consumers. Partnerships with beauty and wellness brands are further fueling adoption.
The aroma ingredients market in China is projected to expand at a CAGR of 6.0% from 2025 to 2035, supported by rapid urbanization, lifestyle shifts, and strong growth in cosmetics and personal care. Rising disposable incomes and demand for luxury fragrances fuel adoption. Domestic players are investing in advanced manufacturing processes and collaborating with global fragrance companies. Government support for sustainable raw material sourcing enhances market development. Expanding online retail and changing consumer lifestyles also strengthen demand.
Demand for aroma ingredients in UK is expected to grow at a CAGR of 5.8% from 2025 to 2035, supported by demand for sustainable and niche fragrances. Growth is influenced by rising interest in artisanal and natural scents, especially in fine fragrances and personal care. Regulatory compliance with clean-label standards boosts consumer trust. Retail expansion through specialty outlets and online platforms widens product access. Increasing demand for functional and wellness-oriented fragrances strengthens adoption.
The aroma ingredients market in Germany is expected to grow at a CAGR of 5.5% from 2025 to 2035, fueled by strong demand for eco-friendly, high-quality fragrances in personal care and household products. German consumers prioritize sustainability and transparency in sourcing, driving demand for natural aroma ingredients. Leading manufacturers are adopting advanced technologies to improve product consistency and safety. Growth in wellness-focused fragrances and natural cosmetics further supports market expansion.
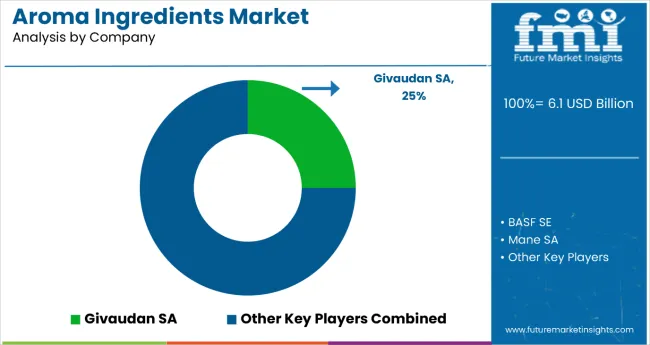
The market is moderately consolidated, comprising a mix of multinational corporations, regional producers, and specialized fragrance and flavor companies. Key players include Givaudan SA, International Flavors & Fragrances Inc. (IFF), Symrise AG, dsm-firmenich, BASF SE, Mane SA, Agilex Flavors & Fragrances Inc., Hindustan Mint & Agro Products Pvt. Ltd., and Frutarom Industries Ltd. These companies leverage advanced manufacturing technologies, extensive distribution networks, and broad product portfolios to serve diverse applications such as personal care, soaps and detergents, fine fragrances, household products, and food & beverages.
The market is characterized by a significant share of essential oils and natural extracts, accounting for 54% of the type category in 2025. This preference is driven by their high aromatic potency, natural origin, versatility in formulations, and consumer demand for chemical-free, sustainable products. Synthetic aroma chemicals are also gaining traction in applications requiring consistent quality, stability, and cost-effective supply. Companies are focusing on product innovation, biotechnology, and sustainable sourcing to maintain competitiveness and meet evolving industry standards.
Strategic initiatives such as mergers and acquisitions, partnerships, and regional expansions are common among aroma ingredient manufacturers aiming to enhance market presence. Firms are also investing in green chemistry, fermentation-based production, and traceable supply chains to address sustainability and regulatory requirements. In summary, the aroma ingredients market is evolving with established and emerging companies striving to strengthen their positions through innovation, sustainability initiatives, and global reach, shaping the competitive dynamics of the industry.
| Items | Values |
|---|---|
| Quantitative Units (2025) | USD 6.1 billion |
| Type | Essential Oils, Aroma Chemicals, Menthe Arvensis, Cedar Wood, Orange, Eucalyptus, Citronella, Terpenes, Musk Chemical, Benzenoids, and Others |
| Application | Cosmetics and Toiletries, Soap and Detergents, Fine Fragrance, and Others |
| Regions Covered | North America, Latin America, Western Europe, Eastern Europe, South Asia and Pacific, East Asia, and Middle East & Africa |
| Countries Covered | United States, Canada, United Kin gdom, Germany, France, China, Japan, South Korea, Brazil, Australia, and 40+ countries |
| Key Players | BASF SE, Mane SA, International Flavors and Fragrances Inc., Givaudan SA, Firmenich International SA, Frutarom Industries Ltd., Symrise AG, Agilex Flavors and Fragrances Inc., Hindustan Mint & Agro Products Pvt. Ltd., and Privi Organics India Limited |
| Additional Attributes | Dollar sales by type and application, regional formulation trends, competitive landscape, adoption in food, beverages, and personal care, integration with flavor and fragrance systems, innovations in natural, botanical, and specialty aroma ingredients |
The global aroma ingredients market is estimated to be valued at USD 6.1 billion in 2025.
The market size for the aroma ingredients market is projected to reach USD 10.7 billion by 2035.
The aroma ingredients market is expected to grow at a 5.8% CAGR between 2025 and 2035.
The key product types in aroma ingredients market are essential oils, aroma chemicals, menthe arvensis, cedar wood, orange, eucalyptus, citronella, terpenes, musk chemical, benzenoids and others (alicyclic, heterocyclic, and aliphatic compounds).
In terms of application, cosmetic and toiletries segment to command 42.7% share in the aroma ingredients market in 2025.


Our Research Products

The "Full Research Suite" delivers actionable market intel, deep dives on markets or technologies, so clients act faster, cut risk, and unlock growth.

The Leaderboard benchmarks and ranks top vendors, classifying them as Established Leaders, Leading Challengers, or Disruptors & Challengers.

Locates where complements amplify value and substitutes erode it, forecasting net impact by horizon

We deliver granular, decision-grade intel: market sizing, 5-year forecasts, pricing, adoption, usage, revenue, and operational KPIs—plus competitor tracking, regulation, and value chains—across 60 countries broadly.

Spot the shifts before they hit your P&L. We track inflection points, adoption curves, pricing moves, and ecosystem plays to show where demand is heading, why it is changing, and what to do next across high-growth markets and disruptive tech

Real-time reads of user behavior. We track shifting priorities, perceptions of today’s and next-gen services, and provider experience, then pace how fast tech moves from trial to adoption, blending buyer, consumer, and channel inputs with social signals (#WhySwitch, #UX).

Partner with our analyst team to build a custom report designed around your business priorities. From analysing market trends to assessing competitors or crafting bespoke datasets, we tailor insights to your needs.
Supplier Intelligence
Discovery & Profiling
Capacity & Footprint
Performance & Risk
Compliance & Governance
Commercial Readiness
Who Supplies Whom
Scorecards & Shortlists
Playbooks & Docs
Category Intelligence
Definition & Scope
Demand & Use Cases
Cost Drivers
Market Structure
Supply Chain Map
Trade & Policy
Operating Norms
Deliverables
Buyer Intelligence
Account Basics
Spend & Scope
Procurement Model
Vendor Requirements
Terms & Policies
Entry Strategy
Pain Points & Triggers
Outputs
Pricing Analysis
Benchmarks
Trends
Should-Cost
Indexation
Landed Cost
Commercial Terms
Deliverables
Brand Analysis
Positioning & Value Prop
Share & Presence
Customer Evidence
Go-to-Market
Digital & Reputation
Compliance & Trust
KPIs & Gaps
Outputs
Full Research Suite comprises of:
Market outlook & trends analysis
Interviews & case studies
Strategic recommendations
Vendor profiles & capabilities analysis
5-year forecasts
8 regions and 60+ country-level data splits
Market segment data splits
12 months of continuous data updates
DELIVERED AS:
PDF EXCEL ONLINE
Aromatherapy Market Size and Share Forecast Outlook 2025 to 2035
Aromatic Ketone Polymers Market Size and Share Forecast Outlook 2025 to 2035
Aromatic Polyamine Market Size and Share Forecast Outlook 2025 to 2035
Ingredients Market for Plant-based Food & Beverages Size and Share Forecast Outlook 2025 to 2035
ASEAN Aromatherapy Market Analysis – Size, Share & Forecast 2024-2034
Bean Ingredients Market Size and Share Forecast Outlook 2025 to 2035
Milk Ingredients Market Analysis - Size, Share, and Forecast Outlook 2025 to 2035
Malt Ingredients Market Analysis by Raw Material, Product Type, Grade, End-use, and Region through 2035
Food Aroma Market Analysis by Product, Form, Application, and Region through 2035
Dairy Ingredients Market Size and Share Forecast Outlook 2025 to 2035
Pulse Ingredients Market Analysis – Size, Share, and Forecast 2025 to 2035
Smoke Ingredients for Food Market Analysis - Size, Share & Forecast 2025 to 2035
Bakery Ingredients Market Analysis - Size, Share, & Forecast Outlook 2025 to 2035
Biotin Ingredients Market Size and Share Forecast Outlook 2025 to 2035
Baking Ingredients Market Size and Share Forecast Outlook 2025 to 2035
Almond Ingredients Market Size, Growth, and Forecast for 2025 to 2035
Savory Ingredients Market Analysis – Size, Share, and Forecast Outlook 2025 to 2035
Examining Savory Ingredients Market Share & Industry Leaders
Energy Ingredients Market Analysis by Product Type and Application Through 2035
Perfume Ingredients Chemicals Market Size and Share Forecast Outlook 2025 to 2035

Thank you!
You will receive an email from our Business Development Manager. Please be sure to check your SPAM/JUNK folder too.
Chat With
MaRIA