Savory Ingredients Market Size and Share Forecast Outlook 2025 to 2035

The global savory ingredients market is projected to grow from USD 9 billion in 2025 to USD 17.4 billion by 2035, registering a CAGR of 6.8%.

Quick Stats for Savory Ingredients Market

  • Market Value (2025): USD 9 billion
  • Forecast Value (2035): USD 17.4 billion
  • Forecast CAGR: 6.8%
  • Source Leader in 2025: Synthetic (58% market share)
  • Top Application Segment: Food and Beverage Products (42.6% share)
  • Key Growth Region: East Asia (Japan is the fastest-growing market with a 6.3% CAGR)
Metric Value
Industry Size (2025E) USD 9 billion
Industry Value (2035F) USD 17.4 billion
CAGR (2025 to 2035) 6.8%

Market expansion is driven by rising consumer demand for flavorful, convenient food options, and the increasing adoption of global cuisines. Consumers are seeking bold, rich, and unique flavors, boosting the usage of savory ingredients in snacks, ready-to-eat meals, and plant-based food products.

The market holds an estimated 100% share of the flavor enhancer market, reflecting its core role in this segment. Within the food ingredients market, it commands approximately 12%, emphasizing its importance in flavor and taste enhancement applications. It contributes around 4% to the overall food additives market and nearly 2% to the broader food and beverage ingredients market. However, in the expansive global food and beverage market, its share remains minimal below 0.1%.

Government regulations impacting the market focus on food safety, ingredient labelling, and permissible additives. Standards such as the Food Safety and Standards Act in India, FDA regulations in the USA, and EFSA guidelines in Europe regulate the use of savory ingredients, ensuring consumer health and safety while supporting market growth.

Japan is projected to be the fastest-growing market, expected to expandat a CAGR of 6.3% from 2025 to 2035. Food and beverage products will lead the application segment with a 42.6% share, while synthetic will dominate the source segment with a 58% share. The USA and Germany markets are also expected to grow steadily at CAGRs of 4.6% and 5.3%, respectively.

Savory Ingredients Market Analysis by Top Investment Segments

The market is segmented by type of ingredient, source, application, form, and region. By type of ingredient, the market is divided into flavor enhancers, spices and seasonings, savory flavors, and umami ingredients. Based on source, the market is bifurcated into natural and synthetic.

By application, the market is segmented into food & beverage products, food service industry, and household cooking. In terms of form, the market is divided into powder, liquid, and granular. Regionally, the market is classified into North America, Latin America, Western Europe, Eastern Europe, Balkans & Baltic, Russia & Belarus, Central Asia, East Asia, South Asia & Pacific, and the Middle East & Africa.

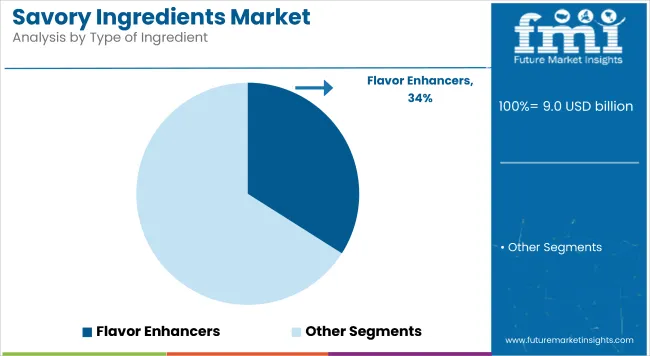
Flavor Enhancers to Lead the Type of Ingredient Segment with 34% Market Share

Flavor enhancers are projected to lead the type of ingredient segment, capturing 34% of the market share by 2025. Their dominance is supportedby their widespread use in processed foods, snacks, sauces, and ready-to-eat meals, where they improve taste without altering core formulations.
  • Flavor enhancers provide cost-effective taste improvement, enhancing saltiness or umami without increasing sodium content.
  • Rising consumption of ready-to-eat meals and packaged foods is driving demand for flavor enhancers in global markets.

Savory Ingredients Market By Type Of Ingredient

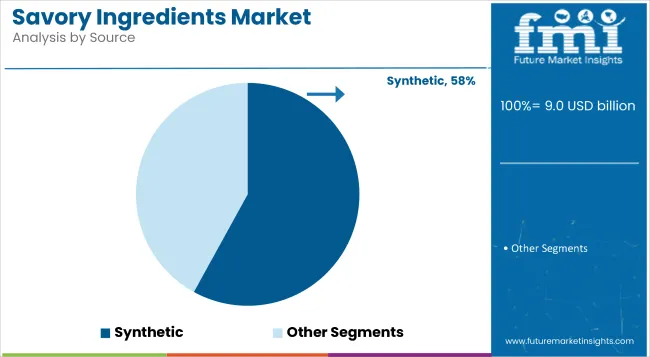
Synthetic to Capture the Source Segment with 58% Market Share

Synthetic is projected to dominate the source segment, accountingfor 58% of the market share in 2025. This segment is expected to grow steadily due to its affordable pricing, longer shelf life, and high stability in diverse climatic conditions, ensuring ease of storage and reduced wastage for manufacturers.
  • These sources are cost-effective for mass food production, offering stability and longer shelf life compared to natural variants.
  • Their consistent flavor profile makes them widely preferred in processed foods, sauces, and snacks manufacturing.

Savory Ingredients Market By Source

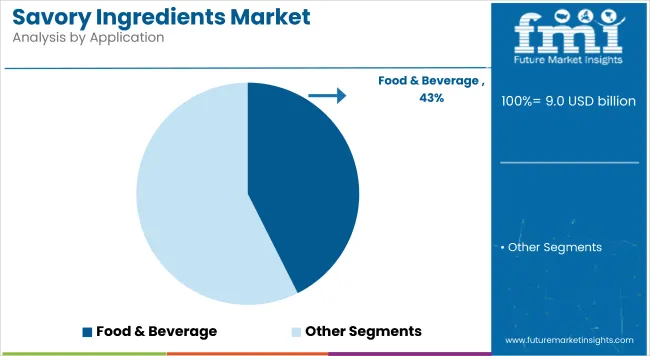
Food and Beverage Products to Lead the Application Segment with 42.6% Market Share

Food and beverage products are expected to dominate the application segment, accounting for 42.6% of the global market share by 2025. The widespread use of savory ingredients in soups, sauces, snacks, and frozen meals drives this growth, as consumers continue to seek flavorful convenience foods.
  • This dominance is due to the extensive use of savory ingredients in packaged snacks, soups, sauces, and convenience meals.
  • Rising urbanization and demand for quick-preparation meals are fueling growth in this segment globally.

Savory Ingredients Market By Application

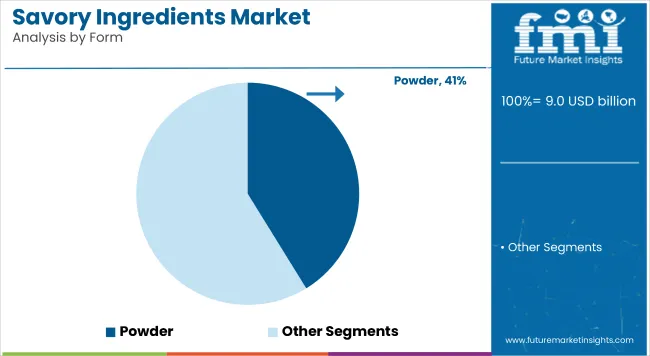
Powder to Lead the Form Segment with 41.2% Market Share

Powder is projected to dominate the form segment, holding approximately 41.2% of the market share by 2025. Powdered forms are highly preferred for their ease of handling, precise dosage, and compatibility with various food matrices.
  • Powdered savory ingredients are easy to blend in food formulations and offer better dispersion.
  • Their long shelf life and versatility across snacks, seasoning mixes, and soups drive market growth.

Savory Ingredients Market By Form

Top Savory Ingredients Market Dynamics

The global savory ingredients market is experiencing steady growth, driven by increasing consumer demand for flavorful and convenient food options across the world. Savory ingredients play a crucial role in enhancing taste profiles, improving the sensory appeal of products, and catering to diverse culinary preferences in processed foods, snacks, and ready meals.

Recent Trends in the Savory Ingredients Market

  • Growing preference for natural and clean-label savory ingredients is shaping new product development, as consumers become more health-conscious and seek products free from artificial additives.
  • Expansion of global cuisines in mainstream food service and retail is driving demand for unique spices, seasonings, and umami-rich ingredients to replicate authentic international flavors.

Challenges in the Savory Ingredients Market

  • Fluctuating prices and limited availability of natural raw materials such as spices and herbs pose supply chain challenges for manufacturers, impacting production costs and margins.
  • Stringent food safety regulations and the need for consistent quality across regions increase compliance costs, requiring manufacturers to invest in advanced processing, testing, and certification systems to maintain standards.

Top Countries Manufacturing, Regulating, and Driving Demand for Savory Ingredients

Japan is leading the market among OECD countries, registering a 6.3% CAGR. This is driven by widespread use of umami-rich seasonings in instant noodles, ramen, and fermented sauces. Japan's dominance reflects a combination of strong domestic demand, culinary tradition, and innovation in fermentation-based flavor enhancers.

Germany follows with a 5.3% CAGR, where clean-label and plant-based product development continues to influence ingredient sourcing. In France, growth of 5% is supported by rising demand for organic spice blends in bakery and gourmet applications.

The USA, growing at 4.6%, witnesses steady demand from processed food, snacks, and quick-service restaurant chains using functional savory blends. The United Kingdom lags slightly with a 4.2% CAGR, supported by demand in premium ready meals and reduced-salt seasonings. Japan leads in both growth and innovation, while other OECD nations maintain consistent performance shaped by regulatory trends and evolving consumer preferences.

The report covers in-depth analysis of 40+ countries; five top-performing OECD countries are highlighted below.

In-depth Analysis of Savory Ingredients Demand in Japan

The Japan savory ingredients revenue is growing at a CAGR of 6.3% from 2025 to 2035. Growth is driven by high consumption of umami-rich seasonings in instant noodles, ramen, sauces, and packaged meals.

  • High demand for umami flavorings and traditional seasonings.
  • Focus on clean-label and premium seasoning innovations.

Growth Outlook for Savory Ingredients in Germany

The sales of savory ingredients in Germany are expected to expand at 5.3% CAGR during the forecast period. EU regulations promoting clean-label, natural ingredients, and sodium reduction drive innovations in seasoning blends.

  • Strong clean-label movement influencing product development.
  • High demand in ready meals and plant-based products.

Industrial Savory Ingredients Demand in France

The French savory ingredients market is projected to grow at a 5% CAGR during the forecast period. Demand is driven by traditional cuisine richness, clean-label preferences, and increasing snacking trends.

  • Rising adoption of organic spices and herbs.
  • Strong presence in sauces, bakery, and snack segments.

Demand Trajectory for Savory Ingredients in the USA

The USA savory ingredients market is projected to grow at 4.6% CAGR from 2025 to 2035. Growth is driven by demand for processed foods, sauces, and flavor-packed snacks.

  • Strong demand for innovative seasoning blends in snacks and meals.
  • Increasing preference for clean-label and sodium-reduced products.

Savory Ingredients Trends in the UK

The UK savory ingredients revenue is projected to grow at a 4.2% CAGR from 2025 to 2035. Growth is supported by consumer demand for premium ready meals, snacks, and authentic global cuisines.
  • Focus on premium ready meals and authentic international flavors.
  • Rising demand for clean-label and healthier seasoning options.

Leading Savory Ingredients Suppliers and Manufacturers

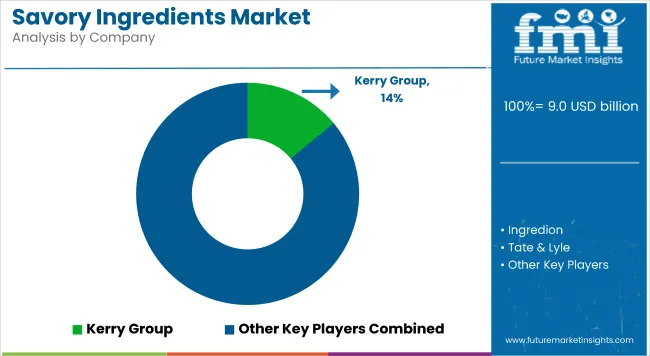
Savory Ingredients Market By Company

The market is moderately consolidated, with leading players like Kerry Group, Ingredion, Tate & Lyle, Corbion, Ajinomoto, and Sensient Technology Corporation dominating the industry. These companies provide innovative savory ingredients catering to diverse applications such as snacks, sauces, ready meals, and plant-based foods. Kerry Group focuses on developing authentic flavor solutions, while Ingredion specializes in clean-label and functional ingredient innovations.

Tate & Lyle offers taste and texture solutions enhancing food appeal. Corbion is known for its natural preservatives and savory flavor enhancers. Ajinomoto is globally recognized for umami ingredients like MSG. Other key players such as ADM, Cargill, Givaudan, Symrise, DSM, and Novozymes contribute by providing diverse, high-performance ingredients supporting culinary and processed food industries worldwide.

Recent Savory Ingredients Industry News

  • In June 2025, Univar Solutions expanded its partnership with Ingredion to distribute specialty food and beverage ingredients across the Benelux region through its Foodology by Univar Solutions division, strengthening its regional footprint and ingredient portfolio.
  • In December 2023, Kerry Group announced an agreement to acquire the lactase enzyme business of Chr. Hansen and Novozymes. The deal, pending EU approval, will strengthen Kerry’s biotechnology platform and support growing demand for lactose-free dairy solutions.

Savory Ingredients Market Report Scope

Report Attributes Details
Market Size (2025) USD 9 billion
Projected Market Size (2035) USD 17.4 billion
CAGR (2025 to 2035) 6.8%
Base Year for Estimation 2024
Historical Period 2020 to 2024
Projections Period 2025 to 2035
Report Parameter USD billion for value/volume in metric tons
Type of Ingredient Analyzed Flavor Enhancers, Spices and Seasonings, Savory Flavors, and Umami Ingredients
Source Analyzed Natural and Synthetic
Application Analyzed Food and Beverage Products, Food Service Industry, and Household Cooking
Form Analyzed Powder, Liquid, and Granular
Regions Covered North America, Latin America, Western Europe, Eastern Europe, Balkans & Baltic, Russia & Belarus, Central Asia, East Asia, South Asia & Pacific, Middle East & Africa
Countries Covered United States, United Kingdom, Germany, France, Japan, China, India, Brazil, South Korea, Australia
Key Players Influencing the Market Kerry Group, Ingredion, Tate & Lyle, Corbion, Ajinomoto, Sensient Technology Corporation, ADM, Cargill, Givaudan, Symrise, DSM, and Novozymes
Additional Attributes Dollar sales by ingredient type, share by source, regional demand growth, policy influence, clean-label trends, competitive benchmarking

Key Segments

By Type of Ingredient:

This segment is further categorized into flavor enhancers, spices and seasonings, savory flavors, and umami ingredients.

By Application:

This segment is further categorized into food and beverage products, food service industry, and household cooking.

By Form:

This segment is further categorized into powder, liquid, and granular.

By Source:

This segment is further categorized into natural, and synthetic.

By Region:

Industry analysis has been carried out in key countries of North America, Latin America, Eastern Europe, Western Europe, East Asia, South Asia & Pacific, Central Asia, Balkan and Baltic Countries, Russia & Belarus and the Middle East & Africa.

Table of Content

  1. Executive Summary
    • Global Market Outlook
    • Demand-side Trends
    • Supply-side Trends
    • Technology Roadmap Analysis
    • Analysis and Recommendations
  2. Market Overview
    • Market Coverage / Taxonomy
    • Market Definition / Scope / Limitations
  3. Market Background
    • Market Dynamics
      • Drivers
      • Restraints
      • Opportunity
      • Trends
    • Scenario Forecast
      • Demand in Optimistic Scenario
      • Demand in Likely Scenario
      • Demand in Conservative Scenario
    • Opportunity Map Analysis
    • Product Life Cycle Analysis
    • Supply Chain Analysis
      • Supply Side Participants and their Roles
        • Producers
        • Mid-Level Participants (Traders/ Agents/ Brokers)
        • Wholesalers and Distributors
      • Value Added and Value Created at Node in the Supply Chain
      • List of Raw Material Suppliers
      • List of Existing and Potential Buyer’s
    • Investment Feasibility Matrix
    • Value Chain Analysis
      • Profit Margin Analysis
      • Wholesalers and Distributors
      • Retailers
    • PESTLE and Porter’s Analysis
    • Regulatory Landscape
      • By Key Regions
      • By Key Countries
    • Regional Parent Market Outlook
    • Production and Consumption Statistics
    • Import and Export Statistics
  4. Global Market Analysis 2020 to 2024 and Forecast, 2025 to 2035
    • Historical Market Size Value (USD Billion) & Volume (Metric Tons) Analysis, 2020 to 2024
    • Current and Future Market Size Value (USD Billion) & Volume (Metric Tons) Projections, 2025 to 2035
      • Y-o-Y Growth Trend Analysis
      • Absolute $ Opportunity Analysis
  5. Global Market Pricing Analysis 2020 to 2024 and Forecast 2025 to 2035
  6. Global Market Analysis 2020 to 2024 and Forecast 2025 to 2035, By Type of Ingredient
    • Introduction / Key Findings
    • Historical Market Size Value (USD Billion) & Volume (Metric Tons) Analysis By Type of Ingredient, 2020 to 2024
    • Current and Future Market Size Value (USD Billion) & Volume (Metric Tons) Analysis and Forecast By Type of Ingredient, 2025 to 2035
      • Flavor Enhancers
      • Spices and Seasonings
      • Savory Flavors
      • Umami Ingredients
    • Y-o-Y Growth Trend Analysis By Type of Ingredient, 2020 to 2024
    • Absolute $ Opportunity Analysis By Type of Ingredient, 2025 to 2035
  7. Global Market Analysis 2020 to 2024 and Forecast 2025 to 2035, By Source
    • Introduction / Key Findings
    • Historical Market Size Value (USD Billion) & Volume (Metric Tons) Analysis By Source, 2020 to 2024
    • Current and Future Market Size Value (USD Billion) & Volume (Metric Tons) Analysis and Forecast By Source, 2025 to 2035
      • Natural
      • Synthetic
    • Y-o-Y Growth Trend Analysis By Source, 2020 to 2024
    • Absolute $ Opportunity Analysis By Source, 2025 to 2035
  8. Global Market Analysis 2020 to 2024 and Forecast 2025 to 2035, By Application
    • Introduction / Key Findings
    • Historical Market Size Value (USD Billion) & Volume (Metric Tons) Analysis By Application, 2020 to 2024
    • Current and Future Market Size Value (USD Billion) & Volume (Metric Tons) Analysis and Forecast By Application, 2025 to 2035
      • Food and Beverage Products
      • Food Service Industry
      • Household Cooking
    • Y-o-Y Growth Trend Analysis By Application, 2020 to 2024
    • Absolute $ Opportunity Analysis By Application, 2025 to 2035
  9. Global Market Analysis 2020 to 2024 and Forecast 2025 to 2035, By Form
    • Introduction / Key Findings
    • Historical Market Size Value (USD Billion) & Volume (Metric Tons) Analysis By Form, 2020 to 2024
    • Current and Future Market Size Value (USD Billion) & Volume (Metric Tons) Analysis and Forecast By Form, 2025 to 2035
      • Powder
      • Liquid
      • Granular
    • Y-o-Y Growth Trend Analysis By Form, 2020 to 2024
    • Absolute $ Opportunity Analysis By Form, 2025 to 2035
  10. Global Market Analysis 2020 to 2024 and Forecast 2025 to 2035, By Region
    • Introduction
    • Historical Market Size Value (USD Billion) & Volume (Metric Tons) Analysis By Region, 2020 to 2024
    • Current Market Size Value (USD Billion) & Volume (Metric Tons) Analysis and Forecast By Region, 2025 to 2035
      • North America
      • Latin America
      • Western Europe
      • Eastern Europe
      • East Asia
      • South Asia & Pacific
      • Middle East and Africa
    • Market Attractiveness Analysis By Region
  11. North America Market Analysis 2020 to 2024 and Forecast 2025 to 2035, By Country
    • Historical Market Size Value (USD Billion) & Volume (Metric Tons) Trend Analysis By Market Taxonomy, 2020 to 2024
    • Market Size Value (USD Billion) & Volume (Metric Tons) Forecast By Market Taxonomy, 2025 to 2035
      • By Country
        • USA
        • Canada
        • Mexico
      • By Type of Ingredient
      • By Source
      • By Application
      • By Form
    • Market Attractiveness Analysis
      • By Country
      • By Type of Ingredient
      • By Source
      • By Application
      • By Form
    • Key Takeaways
  12. Latin America Market Analysis 2020 to 2024 and Forecast 2025 to 2035, By Country
    • Historical Market Size Value (USD Billion) & Volume (Metric Tons) Trend Analysis By Market Taxonomy, 2020 to 2024
    • Market Size Value (USD Billion) & Volume (Metric Tons) Forecast By Market Taxonomy, 2025 to 2035
      • By Country
        • Brazil
        • Argentina
        • Rest of LATAM
      • By Type of Ingredient
      • By Source
      • By Application
      • By Form
    • Market Attractiveness Analysis
      • By Country
      • By Type of Ingredient
      • By Source
      • By Application
      • By Form
    • Key Takeaways
  13. Western Europe Market Analysis 2020 to 2024 and Forecast 2025 to 2035, By Country
    • Historical Market Size Value (USD Billion) & Volume (Metric Tons) Trend Analysis By Market Taxonomy, 2020 to 2024
    • Market Size Value (USD Billion) & Volume (Metric Tons) Forecast By Market Taxonomy, 2025 to 2035
      • By Country
        • Germany
        • Italy
        • France
        • UK
        • Spain
        • BENELUX
        • Nordic
        • Rest of W.Europe
      • By Type of Ingredient
      • By Source
      • By Application
      • By Form
    • Market Attractiveness Analysis
      • By Country
      • By Type of Ingredient
      • By Source
      • By Application
      • By Form
    • Key Takeaways
  14. Eastern Europe Market Analysis 2020 to 2024 and Forecast 2025 to 2035, By Country
    • Historical Market Size Value (USD Billion) & Volume (Metric Tons) Trend Analysis By Market Taxonomy, 2020 to 2024
    • Market Size Value (USD Billion) & Volume (Metric Tons) Forecast By Market Taxonomy, 2025 to 2035
      • By Country
        • Russia
        • Hungary
        • Poland
        • Balkan & Baltics
        • Rest of E. Europe
      • By Type of Ingredient
      • By Source
      • By Application
      • By Form
    • Market Attractiveness Analysis
      • By Country
      • By Type of Ingredient
      • By Source
      • By Application
      • By Form
    • Key Takeaways
  15. East Asia Market Analysis 2020 to 2024 and Forecast 2025 to 2035, By Country
    • Historical Market Size Value (USD Billion) & Volume (Metric Tons) Trend Analysis By Market Taxonomy, 2020 to 2024
    • Market Size Value (USD Billion) & Volume (Metric Tons) Forecast By Market Taxonomy, 2025 to 2035
      • By Country
        • China
        • Japan
        • South Korea
      • By Type of Ingredient
      • By Source
      • By Application
      • By Form
    • Market Attractiveness Analysis
      • By Country
      • By Type of Ingredient
      • By Source
      • By Application
      • By Form
    • Key Takeaways
  16. South Asia & Pacific Market Analysis 2020 to 2024 and Forecast 2025 to 2035, By Country
    • Historical Market Size Value (USD Billion) & Volume (Metric Tons) Trend Analysis By Market Taxonomy, 2020 to 2024
    • Market Size Value (USD Billion) & Volume (Metric Tons) Forecast By Market Taxonomy, 2025 to 2035
      • By Country
        • India
        • Australia & New Zealand
        • ASEAN
        • Rest of SAP
      • By Type of Ingredient
      • By Source
      • By Application
      • By Form
    • Market Attractiveness Analysis
      • By Country
      • By Type of Ingredient
      • By Source
      • By Application
      • By Form
    • Key Takeaways
  17. Middle East and Africa Market Analysis 2020 to 2024 and Forecast 2025 to 2035, By Country
    • Historical Market Size Value (USD Billion) & Volume (Metric Tons) Trend Analysis By Market Taxonomy, 2020 to 2024
    • Market Size Value (USD Billion) & Volume (Metric Tons) Forecast By Market Taxonomy, 2025 to 2035
      • By Country
        • GCC Countries
        • Northern Africa
        • South Africa
        • Turkiye
        • Rest of MEA
      • By Type of Ingredient
      • By Source
      • By Application
      • By Form
    • Market Attractiveness Analysis
      • By Country
      • By Type of Ingredient
      • By Source
      • By Application
      • By Form
    • Key Takeaways
  18. Key Countries Market Analysis
    • USA
      • Pricing Analysis
      • Market Share Analysis, 2024
        • By Type of Ingredient
        • By Source
        • By Application
        • By Form
    • Canada
      • Pricing Analysis
      • Market Share Analysis, 2024
        • By Type of Ingredient
        • By Source
        • By Application
        • By Form
    • Brazil
      • Pricing Analysis
      • Market Share Analysis, 2024
        • By Type of Ingredient
        • By Source
        • By Application
        • By Form
    • Mexico
      • Pricing Analysis
      • Market Share Analysis, 2024
        • By Type of Ingredient
        • By Source
        • By Application
        • By Form
    • Argentina
      • Pricing Analysis
      • Market Share Analysis, 2024
        • By Type of Ingredient
        • By Source
        • By Application
        • By Form
  19. Market Structure Analysis
    • Competition Dashboard
    • Competition Benchmarking
    • Market Share Analysis of Top Players
      • By Regional
      • By Type of Ingredient
      • By Source
      • By Application
      • By Form
  20. Competition Analysis
    • Competition Deep Dive
      • Kerry Group
        • Overview
        • Product Portfolio
        • Profitability by Market Segments (Product/Age /Sales Channel/Region)
        • Sales Footprint
        • Strategy Overview
          • Marketing Strategy
          • Product Strategy
          • Channel Strategy
      • Ingredion
        • Overview
        • Product Portfolio
        • Profitability by Market Segments (Product/Age /Sales Channel/Region)
        • Sales Footprint
        • Strategy Overview
          • Marketing Strategy
          • Product Strategy
          • Channel Strategy
      • Tate & Lyle
        • Overview
        • Product Portfolio
        • Profitability by Market Segments (Product/Age /Sales Channel/Region)
        • Sales Footprint
        • Strategy Overview
          • Marketing Strategy
          • Product Strategy
          • Channel Strategy
      • Corbion
        • Overview
        • Product Portfolio
        • Profitability by Market Segments (Product/Age /Sales Channel/Region)
        • Sales Footprint
        • Strategy Overview
          • Marketing Strategy
          • Product Strategy
          • Channel Strategy
      • Ajinomoto
        • Overview
        • Product Portfolio
        • Profitability by Market Segments (Product/Age /Sales Channel/Region)
        • Sales Footprint
        • Strategy Overview
          • Marketing Strategy
          • Product Strategy
          • Channel Strategy
      • Sensient Technology Corporation
        • Overview
        • Product Portfolio
        • Profitability by Market Segments (Product/Age /Sales Channel/Region)
        • Sales Footprint
        • Strategy Overview
          • Marketing Strategy
          • Product Strategy
          • Channel Strategy
      • ADM
        • Overview
        • Product Portfolio
        • Profitability by Market Segments (Product/Age /Sales Channel/Region)
        • Sales Footprint
        • Strategy Overview
          • Marketing Strategy
          • Product Strategy
          • Channel Strategy
      • Cargill
        • Overview
        • Product Portfolio
        • Profitability by Market Segments (Product/Age /Sales Channel/Region)
        • Sales Footprint
        • Strategy Overview
          • Marketing Strategy
          • Product Strategy
          • Channel Strategy
      • Givaudan
        • Overview
        • Product Portfolio
        • Profitability by Market Segments (Product/Age /Sales Channel/Region)
        • Sales Footprint
        • Strategy Overview
          • Marketing Strategy
          • Product Strategy
          • Channel Strategy
      • Symrise
        • Overview
        • Product Portfolio
        • Profitability by Market Segments (Product/Age /Sales Channel/Region)
        • Sales Footprint
        • Strategy Overview
          • Marketing Strategy
          • Product Strategy
          • Channel Strategy
      • DSM
        • Overview
        • Product Portfolio
        • Profitability by Market Segments (Product/Age /Sales Channel/Region)
        • Sales Footprint
        • Strategy Overview
          • Marketing Strategy
          • Product Strategy
          • Channel Strategy
      • Novozymes
        • Overview
        • Product Portfolio
        • Profitability by Market Segments (Product/Age /Sales Channel/Region)
        • Sales Footprint
        • Strategy Overview
          • Marketing Strategy
          • Product Strategy
          • Channel Strategy
  21. Assumptions & Acronyms Used
  22. Research Methodology

List of Tables

  • Table 1: Global Market Value (USD Billion) Forecast by Region, 2020-2035
  • Table 2: Global Market Volume (Metric Tons) Forecast by Region, 2020-2035
  • Table 3: Global Market Value (USD Billion) Forecast by Type of Ingredient, 2020-2035
  • Table 4: Global Market Volume (Metric Tons) Forecast by Type of Ingredient, 2020-2035
  • Table 5: Global Market Value (USD Billion) Forecast by Source, 2020-2035
  • Table 6: Global Market Volume (Metric Tons) Forecast by Source, 2020-2035
  • Table 7: Global Market Value (USD Billion) Forecast by Application, 2020-2035
  • Table 8: Global Market Volume (Metric Tons) Forecast by Application, 2020-2035
  • Table 9: Global Market Value (USD Billion) Forecast by Form, 2020-2035
  • Table 10: Global Market Volume (Metric Tons) Forecast by Form, 2020-2035
  • Table 11: North America Market Value (USD Billion) Forecast by Country, 2020-2035
  • Table 12: North America Market Volume (Metric Tons) Forecast by Country, 2020-2035
  • Table 13: North America Market Value (USD Billion) Forecast by Type of Ingredient, 2020-2035
  • Table 14: North America Market Volume (Metric Tons) Forecast by Type of Ingredient, 2020-2035
  • Table 15: North America Market Value (USD Billion) Forecast by Source, 2020-2035
  • Table 16: North America Market Volume (Metric Tons) Forecast by Source, 2020-2035
  • Table 17: North America Market Value (USD Billion) Forecast by Application, 2020-2035
  • Table 18: North America Market Volume (Metric Tons) Forecast by Application, 2020-2035
  • Table 19: North America Market Value (USD Billion) Forecast by Form, 2020-2035
  • Table 20: North America Market Volume (Metric Tons) Forecast by Form, 2020-2035
  • Table 21: Latin America Market Value (USD Billion) Forecast by Country, 2020-2035
  • Table 22: Latin America Market Volume (Metric Tons) Forecast by Country, 2020-2035
  • Table 23: Latin America Market Value (USD Billion) Forecast by Type of Ingredient, 2020-2035
  • Table 24: Latin America Market Volume (Metric Tons) Forecast by Type of Ingredient, 2020-2035
  • Table 25: Latin America Market Value (USD Billion) Forecast by Source, 2020-2035
  • Table 26: Latin America Market Volume (Metric Tons) Forecast by Source, 2020-2035
  • Table 27: Latin America Market Value (USD Billion) Forecast by Application, 2020-2035
  • Table 28: Latin America Market Volume (Metric Tons) Forecast by Application, 2020-2035
  • Table 29: Latin America Market Value (USD Billion) Forecast by Form, 2020-2035
  • Table 30: Latin America Market Volume (Metric Tons) Forecast by Form, 2020-2035
  • Table 31: Western Europe Market Value (USD Billion) Forecast by Country, 2020-2035
  • Table 32: Western Europe Market Volume (Metric Tons) Forecast by Country, 2020-2035
  • Table 33: Western Europe Market Value (USD Billion) Forecast by Type of Ingredient, 2020-2035
  • Table 34: Western Europe Market Volume (Metric Tons) Forecast by Type of Ingredient, 2020-2035
  • Table 35: Western Europe Market Value (USD Billion) Forecast by Source, 2020-2035
  • Table 36: Western Europe Market Volume (Metric Tons) Forecast by Source, 2020-2035
  • Table 37: Western Europe Market Value (USD Billion) Forecast by Application, 2020-2035
  • Table 38: Western Europe Market Volume (Metric Tons) Forecast by Application, 2020-2035
  • Table 39: Western Europe Market Value (USD Billion) Forecast by Form, 2020-2035
  • Table 40: Western Europe Market Volume (Metric Tons) Forecast by Form, 2020-2035
  • Table 41: Eastern Europe Market Value (USD Billion) Forecast by Country, 2020-2035
  • Table 42: Eastern Europe Market Volume (Metric Tons) Forecast by Country, 2020-2035
  • Table 43: Eastern Europe Market Value (USD Billion) Forecast by Type of Ingredient, 2020-2035
  • Table 44: Eastern Europe Market Volume (Metric Tons) Forecast by Type of Ingredient, 2020-2035
  • Table 45: Eastern Europe Market Value (USD Billion) Forecast by Source, 2020-2035
  • Table 46: Eastern Europe Market Volume (Metric Tons) Forecast by Source, 2020-2035
  • Table 47: Eastern Europe Market Value (USD Billion) Forecast by Application, 2020-2035
  • Table 48: Eastern Europe Market Volume (Metric Tons) Forecast by Application, 2020-2035
  • Table 49: Eastern Europe Market Value (USD Billion) Forecast by Form, 2020-2035
  • Table 50: Eastern Europe Market Volume (Metric Tons) Forecast by Form, 2020-2035
  • Table 51: East Asia Market Value (USD Billion) Forecast by Country, 2020-2035
  • Table 52: East Asia Market Volume (Metric Tons) Forecast by Country, 2020-2035
  • Table 53: East Asia Market Value (USD Billion) Forecast by Type of Ingredient, 2020-2035
  • Table 54: East Asia Market Volume (Metric Tons) Forecast by Type of Ingredient, 2020-2035
  • Table 55: East Asia Market Value (USD Billion) Forecast by Source, 2020-2035
  • Table 56: East Asia Market Volume (Metric Tons) Forecast by Source, 2020-2035
  • Table 57: East Asia Market Value (USD Billion) Forecast by Application, 2020-2035
  • Table 58: East Asia Market Volume (Metric Tons) Forecast by Application, 2020-2035
  • Table 59: East Asia Market Value (USD Billion) Forecast by Form, 2020-2035
  • Table 60: East Asia Market Volume (Metric Tons) Forecast by Form, 2020-2035
  • Table 61: South Asia & Pacific Market Value (USD Billion) Forecast by Country, 2020-2035
  • Table 62: South Asia & Pacific Market Volume (Metric Tons) Forecast by Country, 2020-2035
  • Table 63: South Asia & Pacific Market Value (USD Billion) Forecast by Type of Ingredient, 2020-2035
  • Table 64: South Asia & Pacific Market Volume (Metric Tons) Forecast by Type of Ingredient, 2020-2035
  • Table 65: South Asia & Pacific Market Value (USD Billion) Forecast by Source, 2020-2035
  • Table 66: South Asia & Pacific Market Volume (Metric Tons) Forecast by Source, 2020-2035
  • Table 67: South Asia & Pacific Market Value (USD Billion) Forecast by Application, 2020-2035
  • Table 68: South Asia & Pacific Market Volume (Metric Tons) Forecast by Application, 2020-2035
  • Table 69: South Asia & Pacific Market Value (USD Billion) Forecast by Form, 2020-2035
  • Table 70: South Asia & Pacific Market Volume (Metric Tons) Forecast by Form, 2020-2035
  • Table 71: Middle East and Africa Market Value (USD Billion) Forecast by Country, 2020-2035
  • Table 72: Middle East and Africa Market Volume (Metric Tons) Forecast by Country, 2020-2035
  • Table 73: Middle East and Africa Market Value (USD Billion) Forecast by Type of Ingredient, 2020-2035
  • Table 74: Middle East and Africa Market Volume (Metric Tons) Forecast by Type of Ingredient, 2020-2035
  • Table 75: Middle East and Africa Market Value (USD Billion) Forecast by Source, 2020-2035
  • Table 76: Middle East and Africa Market Volume (Metric Tons) Forecast by Source, 2020-2035
  • Table 77: Middle East and Africa Market Value (USD Billion) Forecast by Application, 2020-2035
  • Table 78: Middle East and Africa Market Volume (Metric Tons) Forecast by Application, 2020-2035
  • Table 79: Middle East and Africa Market Value (USD Billion) Forecast by Form, 2020-2035
  • Table 80: Middle East and Africa Market Volume (Metric Tons) Forecast by Form, 2020-2035

List of Figures

  • Figure 1: Global Market Volume (Metric Tons) Forecast 2020-2035
  • Figure 2: Global Market Pricing Analysis
  • Figure 3: Global Market Value (USD Billion) Forecast 2020-2035
  • Figure 4: Global Market Value Share and BPS Analysis by Type of Ingredient, 2025 and 2035
  • Figure 5: Global Market Y-o-Y Growth Comparison by Type of Ingredient, 2025-2035
  • Figure 6: Global Market Attractiveness Analysis by Type of Ingredient
  • Figure 7: Global Market Value Share and BPS Analysis by Source, 2025 and 2035
  • Figure 8: Global Market Y-o-Y Growth Comparison by Source, 2025-2035
  • Figure 9: Global Market Attractiveness Analysis by Source
  • Figure 10: Global Market Value Share and BPS Analysis by Application, 2025 and 2035
  • Figure 11: Global Market Y-o-Y Growth Comparison by Application, 2025-2035
  • Figure 12: Global Market Attractiveness Analysis by Application
  • Figure 13: Global Market Value Share and BPS Analysis by Form, 2025 and 2035
  • Figure 14: Global Market Y-o-Y Growth Comparison by Form, 2025-2035
  • Figure 15: Global Market Attractiveness Analysis by Form
  • Figure 16: Global Market Value (USD Billion) Share and BPS Analysis by Region, 2025 and 2035
  • Figure 17: Global Market Y-o-Y Growth Comparison by Region, 2025-2035
  • Figure 18: Global Market Attractiveness Analysis by Region
  • Figure 19: North America Market Incremental $ Opportunity, 2025-2035
  • Figure 20: Latin America Market Incremental $ Opportunity, 2025-2035
  • Figure 21: Western Europe Market Incremental $ Opportunity, 2025-2035
  • Figure 22: Eastern Europe Market Incremental $ Opportunity, 2025-2035
  • Figure 23: East Asia Market Incremental $ Opportunity, 2025-2035
  • Figure 24: South Asia & Pacific Market Incremental $ Opportunity, 2025-2035
  • Figure 25: Middle East and Africa Market Incremental $ Opportunity, 2025-2035
  • Figure 26: North America Market Value Share and BPS Analysis by Country, 2025 and 2035
  • Figure 27: North America Market Value Share and BPS Analysis by Type of Ingredient, 2025 and 2035
  • Figure 28: North America Market Y-o-Y Growth Comparison by Type of Ingredient, 2025-2035
  • Figure 29: North America Market Attractiveness Analysis by Type of Ingredient
  • Figure 30: North America Market Value Share and BPS Analysis by Source, 2025 and 2035
  • Figure 31: North America Market Y-o-Y Growth Comparison by Source, 2025-2035
  • Figure 32: North America Market Attractiveness Analysis by Source
  • Figure 33: North America Market Value Share and BPS Analysis by Application, 2025 and 2035
  • Figure 34: North America Market Y-o-Y Growth Comparison by Application, 2025-2035
  • Figure 35: North America Market Attractiveness Analysis by Application
  • Figure 36: North America Market Value Share and BPS Analysis by Form, 2025 and 2035
  • Figure 37: North America Market Y-o-Y Growth Comparison by Form, 2025-2035
  • Figure 38: North America Market Attractiveness Analysis by Form
  • Figure 39: Latin America Market Value Share and BPS Analysis by Country, 2025 and 2035
  • Figure 40: Latin America Market Value Share and BPS Analysis by Type of Ingredient, 2025 and 2035
  • Figure 41: Latin America Market Y-o-Y Growth Comparison by Type of Ingredient, 2025-2035
  • Figure 42: Latin America Market Attractiveness Analysis by Type of Ingredient
  • Figure 43: Latin America Market Value Share and BPS Analysis by Source, 2025 and 2035
  • Figure 44: Latin America Market Y-o-Y Growth Comparison by Source, 2025-2035
  • Figure 45: Latin America Market Attractiveness Analysis by Source
  • Figure 46: Latin America Market Value Share and BPS Analysis by Application, 2025 and 2035
  • Figure 47: Latin America Market Y-o-Y Growth Comparison by Application, 2025-2035
  • Figure 48: Latin America Market Attractiveness Analysis by Application
  • Figure 49: Latin America Market Value Share and BPS Analysis by Form, 2025 and 2035
  • Figure 50: Latin America Market Y-o-Y Growth Comparison by Form, 2025-2035
  • Figure 51: Latin America Market Attractiveness Analysis by Form
  • Figure 52: Western Europe Market Value Share and BPS Analysis by Country, 2025 and 2035
  • Figure 53: Western Europe Market Value Share and BPS Analysis by Type of Ingredient, 2025 and 2035
  • Figure 54: Western Europe Market Y-o-Y Growth Comparison by Type of Ingredient, 2025-2035
  • Figure 55: Western Europe Market Attractiveness Analysis by Type of Ingredient
  • Figure 56: Western Europe Market Value Share and BPS Analysis by Source, 2025 and 2035
  • Figure 57: Western Europe Market Y-o-Y Growth Comparison by Source, 2025-2035
  • Figure 58: Western Europe Market Attractiveness Analysis by Source
  • Figure 59: Western Europe Market Value Share and BPS Analysis by Application, 2025 and 2035
  • Figure 60: Western Europe Market Y-o-Y Growth Comparison by Application, 2025-2035
  • Figure 61: Western Europe Market Attractiveness Analysis by Application
  • Figure 62: Western Europe Market Value Share and BPS Analysis by Form, 2025 and 2035
  • Figure 63: Western Europe Market Y-o-Y Growth Comparison by Form, 2025-2035
  • Figure 64: Western Europe Market Attractiveness Analysis by Form
  • Figure 65: Eastern Europe Market Value Share and BPS Analysis by Country, 2025 and 2035
  • Figure 66: Eastern Europe Market Value Share and BPS Analysis by Type of Ingredient, 2025 and 2035
  • Figure 67: Eastern Europe Market Y-o-Y Growth Comparison by Type of Ingredient, 2025-2035
  • Figure 68: Eastern Europe Market Attractiveness Analysis by Type of Ingredient
  • Figure 69: Eastern Europe Market Value Share and BPS Analysis by Source, 2025 and 2035
  • Figure 70: Eastern Europe Market Y-o-Y Growth Comparison by Source, 2025-2035
  • Figure 71: Eastern Europe Market Attractiveness Analysis by Source
  • Figure 72: Eastern Europe Market Value Share and BPS Analysis by Application, 2025 and 2035
  • Figure 73: Eastern Europe Market Y-o-Y Growth Comparison by Application, 2025-2035
  • Figure 74: Eastern Europe Market Attractiveness Analysis by Application
  • Figure 75: Eastern Europe Market Value Share and BPS Analysis by Form, 2025 and 2035
  • Figure 76: Eastern Europe Market Y-o-Y Growth Comparison by Form, 2025-2035
  • Figure 77: Eastern Europe Market Attractiveness Analysis by Form
  • Figure 78: East Asia Market Value Share and BPS Analysis by Country, 2025 and 2035
  • Figure 79: East Asia Market Value Share and BPS Analysis by Type of Ingredient, 2025 and 2035
  • Figure 80: East Asia Market Y-o-Y Growth Comparison by Type of Ingredient, 2025-2035
  • Figure 81: East Asia Market Attractiveness Analysis by Type of Ingredient
  • Figure 82: East Asia Market Value Share and BPS Analysis by Source, 2025 and 2035
  • Figure 83: East Asia Market Y-o-Y Growth Comparison by Source, 2025-2035
  • Figure 84: East Asia Market Attractiveness Analysis by Source
  • Figure 85: East Asia Market Value Share and BPS Analysis by Application, 2025 and 2035
  • Figure 86: East Asia Market Y-o-Y Growth Comparison by Application, 2025-2035
  • Figure 87: East Asia Market Attractiveness Analysis by Application
  • Figure 88: East Asia Market Value Share and BPS Analysis by Form, 2025 and 2035
  • Figure 89: East Asia Market Y-o-Y Growth Comparison by Form, 2025-2035
  • Figure 90: East Asia Market Attractiveness Analysis by Form
  • Figure 91: South Asia & Pacific Market Value Share and BPS Analysis by Country, 2025 and 2035
  • Figure 92: South Asia & Pacific Market Value Share and BPS Analysis by Type of Ingredient, 2025 and 2035
  • Figure 93: South Asia & Pacific Market Y-o-Y Growth Comparison by Type of Ingredient, 2025-2035
  • Figure 94: South Asia & Pacific Market Attractiveness Analysis by Type of Ingredient
  • Figure 95: South Asia & Pacific Market Value Share and BPS Analysis by Source, 2025 and 2035
  • Figure 96: South Asia & Pacific Market Y-o-Y Growth Comparison by Source, 2025-2035
  • Figure 97: South Asia & Pacific Market Attractiveness Analysis by Source
  • Figure 98: South Asia & Pacific Market Value Share and BPS Analysis by Application, 2025 and 2035
  • Figure 99: South Asia & Pacific Market Y-o-Y Growth Comparison by Application, 2025-2035
  • Figure 100: South Asia & Pacific Market Attractiveness Analysis by Application
  • Figure 101: South Asia & Pacific Market Value Share and BPS Analysis by Form, 2025 and 2035
  • Figure 102: South Asia & Pacific Market Y-o-Y Growth Comparison by Form, 2025-2035
  • Figure 103: South Asia & Pacific Market Attractiveness Analysis by Form
  • Figure 104: Middle East and Africa Market Value Share and BPS Analysis by Country, 2025 and 2035
  • Figure 105: Middle East and Africa Market Value Share and BPS Analysis by Type of Ingredient, 2025 and 2035
  • Figure 106: Middle East and Africa Market Y-o-Y Growth Comparison by Type of Ingredient, 2025-2035
  • Figure 107: Middle East and Africa Market Attractiveness Analysis by Type of Ingredient
  • Figure 108: Middle East and Africa Market Value Share and BPS Analysis by Source, 2025 and 2035
  • Figure 109: Middle East and Africa Market Y-o-Y Growth Comparison by Source, 2025-2035
  • Figure 110: Middle East and Africa Market Attractiveness Analysis by Source
  • Figure 111: Middle East and Africa Market Value Share and BPS Analysis by Application, 2025 and 2035
  • Figure 112: Middle East and Africa Market Y-o-Y Growth Comparison by Application, 2025-2035
  • Figure 113: Middle East and Africa Market Attractiveness Analysis by Application
  • Figure 114: Middle East and Africa Market Value Share and BPS Analysis by Form, 2025 and 2035
  • Figure 115: Middle East and Africa Market Y-o-Y Growth Comparison by Form, 2025-2035
  • Figure 116: Middle East and Africa Market Attractiveness Analysis by Form
  • Figure 117: Global Market - Tier Structure Analysis
  • Figure 118: Global Market - Company Share Analysis

Frequently Asked Questions

What is the projected size of the savory ingredients market in 2025?

The market is valued at USD 9 billion in 2025.

What is the outlook on savory ingredients demand by 2035?

The market is forecasted to reach USD 17.4 billion by 2035, reflecting a CAGR of 6.8%.

Which segment leads the savory ingredients market by source in 2025?

Synthetic will lead the source segment, accounting for 58% of the global market share in 2025.

What is the top application sector for the savory ingredients market in 2025?

Food and beverage products will dominate the application segment with a 42.6% share in 2025.

Which country is projected to have the fastest-growing savory ingredients market?

Japan is projected to grow at the fastest rate, with a CAGR of 6.3% from 2025 to 2035.

Explore Similar Insights

Future Market Insights

Savory Ingredients Market