Baking Ingredients Market Size and Share Forecast Outlook 2025 to 2035

The global baking ingredients market is projected to grow from USD 20.4 billion in 2025 to USD 41.1 billion by 2035, registering a CAGR of 7.2%.
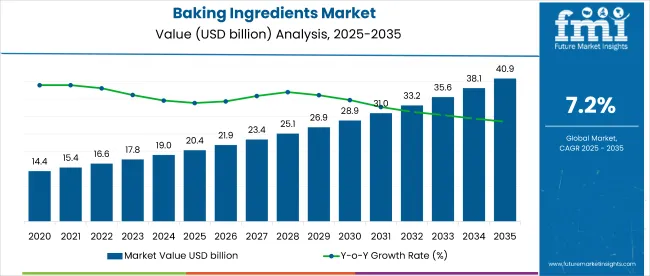
Quick Stats - Baking Ingredients Market

  • Market Value (2025): USD 20.4 billion
  • Forecast Value (2035): USD 41.1 billion
  • Forecast CAGR: 7.2%
  • Leading Distribution Channel in 2025: Supermarkets & Hypermarkets (36% share)
  • Top Application Segment: Bread (40% share)
  • Key Growth Region: East Asia (Japan is the fastest-growing market with a 6.9% CAGR)

Baking Ingredients Market

Metric Value
Industry Size (2025E) USD 20.4 billion
Industry Value (2035F) USD 41.1 billion
CAGR (2025 to 2035) 7.2%

The market expansion is being driven by growing consumer demand for convenience foods, clean-label products, and specialty bakery items. Health-conscious consumers are increasingly opting for organic, gluten-free, and sugar-free baked goods, prompting manufacturers to innovate with functional and fortified baking ingredients. Rapid urbanization, evolving dietary preferences, and rising disposable incomes in emerging economies are further accelerating market growth.

The market holds a significant position within its parent markets. It accounts for 100% of the bakery products market in terms of input reliance. Within the food ingredients market, it represents around 13%, owing to its widespread use in baked goods. In the processed food market, baking ingredients contribute nearly 7%, driven by the popularity of ready-to-eat and convenience bakery items. Within the food additives segment, it holds close to 4%, particularly due to leavening agents, emulsifiers, and preservatives. In the broader health & wellness food market, its share is modest, contributing around 2.5%.

Government regulations impacting the market focus on food safety, labeling, and quality standards. Agencies such as the Food Safety and Standards Authority of India (FSSAI), the USA Food and Drug Administration (FDA), and the European Food Safety Authority (EFSA) enforce strict norms on ingredient usage, nutritional disclosures, and allergen declarations.

Regulations like FSS (Packaging and Labelling) Regulations, 2011, and EU Regulation (EC) No. 1169/2011 on food information to consumers, are driving the adoption of clean-label and health-forward ingredients. These frameworks promote transparency and safety, encouraging manufacturers to use natural, non-GMO, and nutritionally beneficial baking ingredients to meet evolving consumer expectations and regulatory compliance.

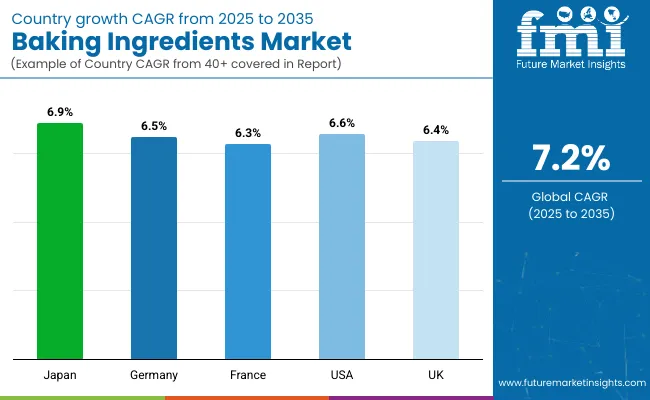
Japan is projected to be the fastest-growing market, expected to expand at a CAGR of 6.9% from 2025 to 2035. Supermarkets & hypermarkets will lead the distribution channel segment with a 36% share, while bread will dominate the application segment with a 40% share. The UK and Germany markets are expected to grow steadily at CAGRs of 6.4% and 6.5%, respectively, while the USA and France are anticipated to expand at 6.6% and 6.5%, respectively.

Baking Ingredients Market Analysis by Top Investment Segments

The market is segmented by product type, application, distribution channel, and region. By product type, the market includes emulsifiers, leavening agents, enzymes, baking powder & mixes, colours & flavours, and preservatives. In terms of application, the market is segmented into bread, biscuits & cookies, and cakes & pastries. Based on distribution channel, the market is classified into supermarkets & hypermarkets, specialty stores, convenience stores, and online retailing. Regionally, the market is divided into North America, Latin America, Europe, Asia Pacific, and the Middle East & Africa.
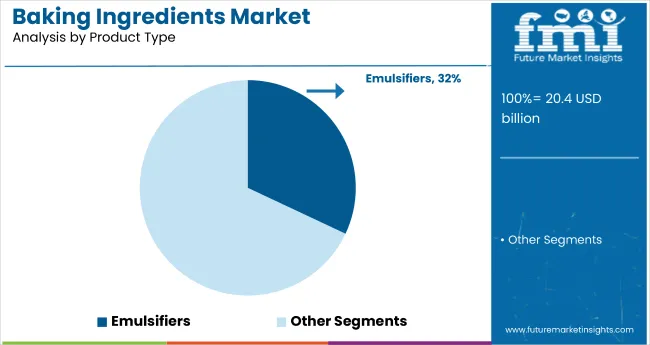
Emulsifiers to Lead the Product Type Segment with 32% Market Share

Baking Ingredients Market Analysis By Product Type

Emulsifiers are projected to dominate the product type segment with a 32% market share in 2025, driven by their role in enhancing texture, improving dough stability, and extending shelf life in baked goods.
  • They enhance dough stability and improve product texture, driving their adoption in commercial baking.
  • The increasing demand for soft-textured and extended shelf-life bakery products fuels emulsifier usage across both industrial and retail baking.

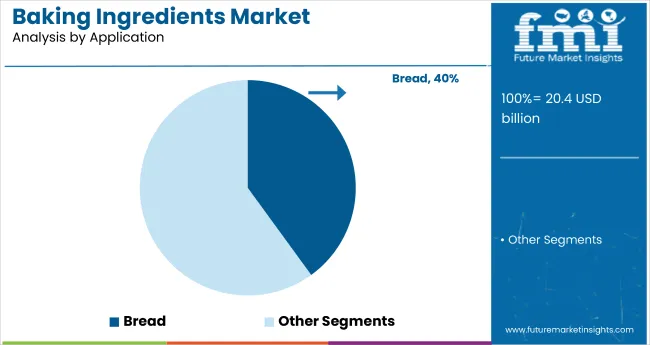
Bread to Dominate the Application Segment with 40% Market Share

Baking Ingredients Market Analysis By Application

Bread is projected to lead the application segment, capturing 40% of the global market share in 2025, driven by its staple status, high consumption, and rising demand for healthier bread varieties.
  • Bread remains a staple across numerous countries, with rising demand for health-focused variants like whole grain and multigrain.
  • Continuous innovation in bread varieties, such as fortified and gluten-free options, drives higher consumption.

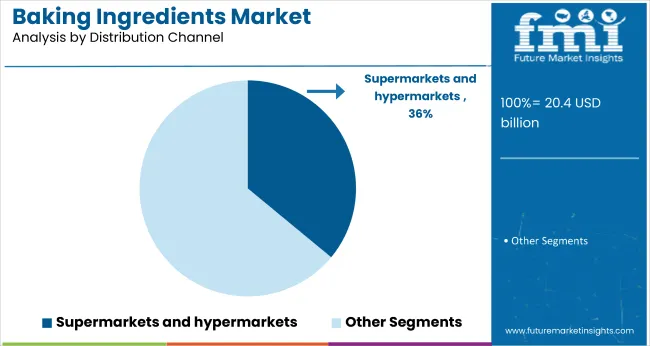
Supermarkets & Hypermarkets to Lead the Distribution Channel Segment with 36% Market Share

Baking Ingredients Market Analysis By Distribution Channel

Supermarkets and hypermarkets are projected to lead the distribution channel segment with a 36% market share in 2025, supported by wide product availability, strong in-store promotions, and growing consumer preference for one-stop shopping experiences.

  • These stores offer a wide range of baking ingredients and benefit from high footfall.
  • Strong promotional activities and product visibility encourage impulse purchases and drive sales growth in this channel.

Top Baking Ingredients Market Dynamics

The global baking ingredients market is witnessing steady growth, fueled by rising consumer demand for convenience foods, premium baked goods, and clean-label formulations. Baking ingredients enhance product texture, flavor, and shelf life, playing a vital role in industrial and artisanal bakery production.

Recent Trends in the Baking Ingredients Market

  • Increased use of natural and organic ingredients, such as plant-based emulsifiers and colors, to meet clean-label and health-conscious consumer preferences.
  • Launch of multifunctional baking ingredient blends that reduce preparation time and ensure consistency across batches in commercial baking operations.

Challenges in the Baking Ingredients Market
  • Price volatility of key raw materials, including dairy, grains, and specialty additives, affects product cost and margin sustainability for manufacturers.
  • Regulatory constraints on food additives and preservatives vary by region, complicating global formulation and compliance strategies for baking ingredient suppliers.

Top Countries Manufacturing, Regulating, and Driving Demand for Baking Ingredients

Country Wise Analysis Of Baking Ingredients Market

Countries CAGR (2025 to 2035)
Japan 6.9%
Germany 6.5%
France 6.3%
USA 6.6%
UK 6.4%

Japan demand is driven by the fusion of traditional and functional baking with high consumer interest in low-sugar and plant-based options. Germany and France show consistent demand growth, supported by clean-label regulations and artisanal baking traditions. Developed economies such as the USA (6.6% CAGR), UK (6.4%), and Japan (6.9%) are expected to expand at a stable 0.94-1.01x of the global growth rate.

Japan leads the market among the top five countries, driven by demand for functional, low-sugar, and premiumized products. The USA follows, with growth fueled by gluten-free, keto, and clean-label trends across industrial bakeries. Germany and France maintain strong market positions due to their focus on organic certification, enzyme-based improvers, and artisanal formats.

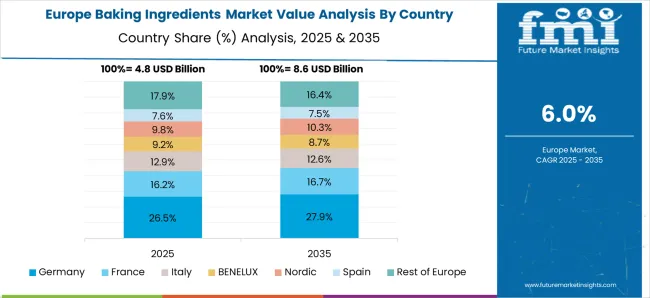
The UK records the slowest growth, shaped by demand for vegan, allergen-free, and bakery solutions. While Japan and the USA drive innovation, European markets emphasize clean-label reformulations, heritage baking, and plant-based alternatives, reflecting regional preferences and regulatory alignment with health and sustainability goals.

The report includes detailed analysis of over 40+ countries; five leading OECD markets are outlined below.

In-depth Analysis of Baking Ingredients Demand in Japan

The Japan baking ingredients market is forecasted to grow at a CAGR of 6.9% from 2025 to 2035. Demand is rising due to the increasing use of low-calorie sweeteners, functional fibers, and enzyme-based emulsifiers in baked goods. Growth is reinforced by aging demographics, wellness preferences, and adoption of premium, value-added products.
  • High uptake of functional and low-sugar ingredients.
  • Demand for premiumized, fortified baking solutions.

Growth Outlook for Baking Ingredients in Germany

The baking ingredients market in Germany is growing at a CAGR of 6.5% during the forecast period, slightly below the global average. The market is supported by the country’s emphasis on clean-label and organic certification. Germany continues to lead in sustainable sourcing of flour, fats, and leavening agents.

  • Strong demand for organic-certified ingredients.
  • Leading uptake of enzyme-based leavening systems.

Baking Ingredients Demand in France

The French baking ingredients revenue is projected to expand at a CAGR of 6.3% from 2025 to 2035. Growth is led by artisanal baking formats, clean-label preferences, and reformulated ingredient systems to reduce fat and sugar content. France continues to innovate in heritage recipes with healthier alternatives and specialty fats.
  • High demand in artisanal and heritage baking formats.
  • Clean-label adoption in shortening, emulsifiers, and flavors.

Demand Trajectory for Baking Ingredients in the USA

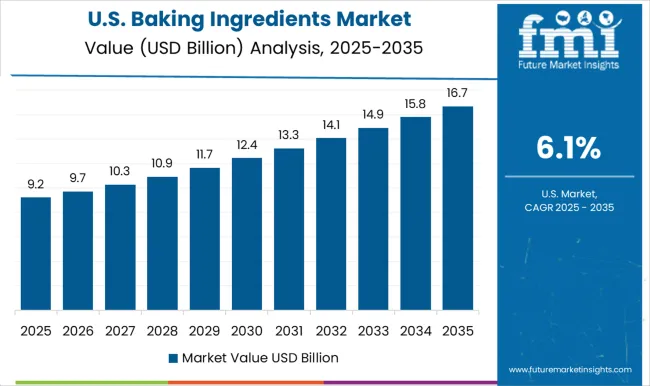
The USA baking ingredients market is anticipated to expand at a CAGR of 6.6% from 2025 to 2035, closely tracking the global pace at 0.97x. Market demand is fueled by the rapid adoption of gluten-free, keto-friendly, and clean-label baking solutions.

  • Growth led by gluten-free and low-carb baking trends.
  • Focus on bulk production and functional ingredient blends.

Baking Ingredient Trends in the UK

The UK baking ingredients revenue is forecasted to grow at a CAGR of 6.4% from 2025 to 2035, marking the slowest rate among the top five OECD markets at 0.94x the global average. Growth is shaped by allergen-free labeling, plant-based trends, and the rise of artisanal and sourdough baking.
  • High demand in vegan and allergen-free bakery ingredients.
  • Shift toward sustainable and clean-label formulations.

Leading Baking Ingredients Suppliers and Manufacturers

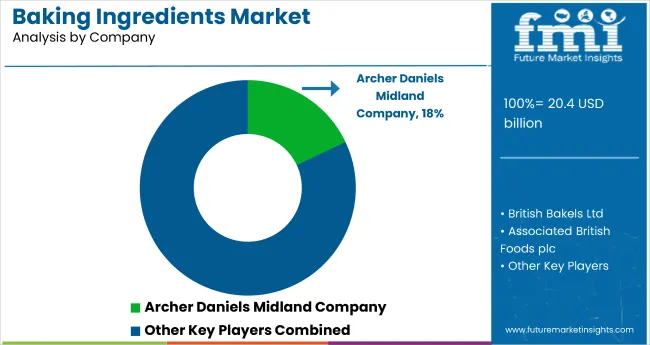
Baking Ingredients Market Analysis By Company

The market is moderately consolidated, led by major players such as AAK AB, Associated British Foods plc, British Bakels Ltd, Archer Daniels Midland Company, and Cargill Inc. These companies offer a broad range of high-performance ingredients catering to artisanal, industrial, and retail bakeries worldwide.

AAK AB is known for its specialty fats and oils, while Associated British Foods plc provides yeast, enzymes, and functional flour blends. British Bakels Ltd focuses on innovative bakery mixes and emulsifiers. ADM and Cargill Inc. deliver large-scale, functional ingredients including sweeteners, stabilizers, and proteins.

Other key players such as E.I. du Pont de Nemours and Co., BASF SE, and Kerry Group Plc. contribute with enzyme systems, clean-label solutions, and plant-based substitutes. Ajinomoto Corporation Inc., Dawn Food Products, and Lonza Group AG continue to innovate in texture-enhancing additives, shelf-life extenders, and nutritional fortification for the evolving global bakery landscape.

Recent Baking Ingredients Industry News

In June 2023, Ardent Mills launched Egg Replace™ and Ancient Grains Plus™ to address supply challenges, support customer innovation, and meet rising demand for functional, high-quality baking ingredient solutions.

Baking Ingredients Market Report Scope

Report Attributes Details
Market Size (2025) USD 20.4 billion
Projected Market Size (2035) USD 41.1 billion
CAGR (2025 to 2035) 7.2%
Base Year for Estimation 2024
Historical Period 2020 to 2024
Projections Period 2025 to 2035
Report Parameter USD billion for value/volume in metric tons
Product Type Analyzed Emulsifiers, Leavening Agents, Enzymes, Baking Powder & Mixes, Colours & Flavours, and Preservatives.
Application Analyzed Bread, Biscuits & Cookies, and Cakes & Pastries
Distribution Channel Analyzed Supermarkets & Hypermarkets, Specialty Stores, Convenience Stores, and Online Retailing
Regions Covered North America, Latin America, Western Europe, South Asia, East Asia, Eastern Europe, Middle East & Africa
Countries Covered United States, United Kingdom, Germany, France, Japan, China, India, Brazil, South Korea, Australia
Key Players Influencing the Market AAK AB, Associated British Foods plc, British Bakels Ltd, Archer Daniels Midland Company, Cargill Inc., E. I. du Pont de Nemours and Co., BASF SE, Kerry Group Plc., Ajinomoto Corporation Inc., Dawn Food Products, Lonza Group AG
Additional Attributes Dollar sales by product type, category-wise market share, distribution channel trends, regional demand analysis, consumer behavior, competitive benchmarking

Segmentation

By Type:

  • Emulsifiers
  • Leavening Agents
  • Enzymes
  • Baking Powder & Mixes
  • Colours & Flavours
  • Preservatives

By Application:

  • Bread
  • Biscuits & Cookies
  • Cakes & Pastries

By Distribution Channel:

  • Supermarkets & Hypermarkets
  • Specialty Stores
  • Convenience Stores
  • Online Retailing

By Region:

  • North America
  • Latin America
  • Western Europe
  • Eastern Europe
  • East Asia
  • South Asia & Pacific
  • Middle East and Africa

Table of Content

  1. Executive Summary
    • Global Market Outlook
    • Demand-side Trends
    • Supply-side Trends
    • Technology Roadmap Analysis
    • Analysis and Recommendations
  2. Market Overview
    • Market Coverage / Taxonomy
    • Market Definition / Scope / Limitations
  3. Market Background
    • Market Dynamics
      • Drivers
      • Restraints
      • Opportunity
      • Trends
    • Scenario Forecast
      • Demand in Optimistic Scenario
      • Demand in Likely Scenario
      • Demand in Conservative Scenario
    • Opportunity Map Analysis
    • Product Life Cycle Analysis
    • Supply Chain Analysis
      • Supply Side Participants and their Roles
        • Producers
        • Mid-Level Participants (Traders/ Agents/ Brokers)
        • Wholesalers and Distributors
      • Value Added and Value Created at Node in the Supply Chain
      • List of Raw Material Suppliers
      • List of Existing and Potential Buyer’s
    • Investment Feasibility Matrix
    • Value Chain Analysis
      • Profit Margin Analysis
      • Wholesalers and Distributors
      • Retailers
    • PESTLE and Porter’s Analysis
    • Regulatory Landscape
      • By Key Regions
      • By Key Countries
    • Regional Parent Market Outlook
    • Production and Consumption Statistics
    • Import and Export Statistics
  4. Global Market Analysis 2020 to 2024 and Forecast, 2025 to 2035
    • Historical Market Size Value (USD Billion) & Volume (Metric Tons) Analysis, 2020 to 2024
    • Current and Future Market Size Value (USD Billion) & Volume (Metric Tons) Projections, 2025 to 2035
      • Y-o-Y Growth Trend Analysis
      • Absolute $ Opportunity Analysis
  5. Global Market Pricing Analysis 2020 to 2024 and Forecast 2025 to 2035
  6. Global Market Analysis 2020 to 2024 and Forecast 2025 to 2035, By Product Type
    • Introduction / Key Findings
    • Historical Market Size Value (USD Billion) & Volume (Metric Tons) Analysis By Product Type, 2020 to 2024
    • Current and Future Market Size Value (USD Billion) & Volume (Metric Tons) Analysis and Forecast By Product Type, 2025 to 2035
      • Emulsifiers
      • Leavening Agents
      • Enzymes
      • Baking Powder & Mixes
      • Colours & Flavours
      • Preservatives
    • Y-o-Y Growth Trend Analysis By Product Type, 2020 to 2024
    • Absolute $ Opportunity Analysis By Product Type, 2025 to 2035
  7. Global Market Analysis 2020 to 2024 and Forecast 2025 to 2035, By Application
    • Introduction / Key Findings
    • Historical Market Size Value (USD Billion) & Volume (Metric Tons) Analysis By Application, 2020 to 2024
    • Current and Future Market Size Value (USD Billion) & Volume (Metric Tons) Analysis and Forecast By Application, 2025 to 2035
      • Bread
      • Biscuits & Cookies
      • Cakes & Pastries
    • Y-o-Y Growth Trend Analysis By Application, 2020 to 2024
    • Absolute $ Opportunity Analysis By Application, 2025 to 2035
  8. Global Market Analysis 2020 to 2024 and Forecast 2025 to 2035, By Distribution Channel
    • Introduction / Key Findings
    • Historical Market Size Value (USD Billion) & Volume (Metric Tons) Analysis By Distribution Channel, 2020 to 2024
    • Current and Future Market Size Value (USD Billion) & Volume (Metric Tons) Analysis and Forecast By Distribution Channel, 2025 to 2035
      • Supermarkets & Hypermarkets
      • Specialty Stores
      • Convenience Stores
      • Online Retailing
    • Y-o-Y Growth Trend Analysis By Distribution Channel, 2020 to 2024
    • Absolute $ Opportunity Analysis By Distribution Channel, 2025 to 2035
  9. Global Market Analysis 2020 to 2024 and Forecast 2025 to 2035, By Region
    • Introduction
    • Historical Market Size Value (USD Billion) & Volume (Metric Tons) Analysis By Region, 2020 to 2024
    • Current Market Size Value (USD Billion) & Volume (Metric Tons) Analysis and Forecast By Region, 2025 to 2035
      • North America
      • Latin America
      • Western Europe
      • Eastern Europe
      • East Asia
      • South Asia & Pacific
      • Middle East and Africa
    • Market Attractiveness Analysis By Region
  10. North America Market Analysis 2020 to 2024 and Forecast 2025 to 2035, By Country
    • Historical Market Size Value (USD Billion) & Volume (Metric Tons) Trend Analysis By Market Taxonomy, 2020 to 2024
    • Market Size Value (USD Billion) & Volume (Metric Tons) Forecast By Market Taxonomy, 2025 to 2035
      • By Country
        • USA
        • Canada
        • Mexico
      • By Product Type
      • By Application
      • By Distribution Channel
    • Market Attractiveness Analysis
      • By Country
      • By Product Type
      • By Application
      • By Distribution Channel
    • Key Takeaways
  11. Latin America Market Analysis 2020 to 2024 and Forecast 2025 to 2035, By Country
    • Historical Market Size Value (USD Billion) & Volume (Metric Tons) Trend Analysis By Market Taxonomy, 2020 to 2024
    • Market Size Value (USD Billion) & Volume (Metric Tons) Forecast By Market Taxonomy, 2025 to 2035
      • By Country
        • Brazil
        • Argentina
        • Rest of LATAM
      • By Product Type
      • By Application
      • By Distribution Channel
    • Market Attractiveness Analysis
      • By Country
      • By Product Type
      • By Application
      • By Distribution Channel
    • Key Takeaways
  12. Western Europe Market Analysis 2020 to 2024 and Forecast 2025 to 2035, By Country
    • Historical Market Size Value (USD Billion) & Volume (Metric Tons) Trend Analysis By Market Taxonomy, 2020 to 2024
    • Market Size Value (USD Billion) & Volume (Metric Tons) Forecast By Market Taxonomy, 2025 to 2035
      • By Country
        • Germany
        • Italy
        • France
        • UK
        • Spain
        • BENELUX
        • Nordic
        • Rest of W.Europe
      • By Product Type
      • By Application
      • By Distribution Channel
    • Market Attractiveness Analysis
      • By Country
      • By Product Type
      • By Application
      • By Distribution Channel
    • Key Takeaways
  13. Eastern Europe Market Analysis 2020 to 2024 and Forecast 2025 to 2035, By Country
    • Historical Market Size Value (USD Billion) & Volume (Metric Tons) Trend Analysis By Market Taxonomy, 2020 to 2024
    • Market Size Value (USD Billion) & Volume (Metric Tons) Forecast By Market Taxonomy, 2025 to 2035
      • By Country
        • Russia
        • Hungary
        • Poland
        • Balkan & Baltics
        • Rest of E. Europe
      • By Product Type
      • By Application
      • By Distribution Channel
    • Market Attractiveness Analysis
      • By Country
      • By Product Type
      • By Application
      • By Distribution Channel
    • Key Takeaways
  14. East Asia Market Analysis 2020 to 2024 and Forecast 2025 to 2035, By Country
    • Historical Market Size Value (USD Billion) & Volume (Metric Tons) Trend Analysis By Market Taxonomy, 2020 to 2024
    • Market Size Value (USD Billion) & Volume (Metric Tons) Forecast By Market Taxonomy, 2025 to 2035
      • By Country
        • China
        • Japan
        • South Korea
      • By Product Type
      • By Application
      • By Distribution Channel
    • Market Attractiveness Analysis
      • By Country
      • By Product Type
      • By Application
      • By Distribution Channel
    • Key Takeaways
  15. South Asia & Pacific Market Analysis 2020 to 2024 and Forecast 2025 to 2035, By Country
    • Historical Market Size Value (USD Billion) & Volume (Metric Tons) Trend Analysis By Market Taxonomy, 2020 to 2024
    • Market Size Value (USD Billion) & Volume (Metric Tons) Forecast By Market Taxonomy, 2025 to 2035
      • By Country
        • India
        • Australia & New Zealand
        • ASEAN
        • Rest of SAP
      • By Product Type
      • By Application
      • By Distribution Channel
    • Market Attractiveness Analysis
      • By Country
      • By Product Type
      • By Application
      • By Distribution Channel
    • Key Takeaways
  16. Middle East and Africa Market Analysis 2020 to 2024 and Forecast 2025 to 2035, By Country
    • Historical Market Size Value (USD Billion) & Volume (Metric Tons) Trend Analysis By Market Taxonomy, 2020 to 2024
    • Market Size Value (USD Billion) & Volume (Metric Tons) Forecast By Market Taxonomy, 2025 to 2035
      • By Country
        • GCC Countries
        • Northern Africa
        • South Africa
        • Turkiye
        • Rest of MEA
      • By Product Type
      • By Application
      • By Distribution Channel
    • Market Attractiveness Analysis
      • By Country
      • By Product Type
      • By Application
      • By Distribution Channel
    • Key Takeaways
  17. Key Countries Market Analysis
    • USA
      • Pricing Analysis
      • Market Share Analysis, 2024
        • By Product Type
        • By Application
        • By Distribution Channel
    • Canada
      • Pricing Analysis
      • Market Share Analysis, 2024
        • By Product Type
        • By Application
        • By Distribution Channel
    • Brazil
      • Pricing Analysis
      • Market Share Analysis, 2024
        • By Product Type
        • By Application
        • By Distribution Channel
    • Mexico
      • Pricing Analysis
      • Market Share Analysis, 2024
        • By Product Type
        • By Application
        • By Distribution Channel
    • Argentina
      • Pricing Analysis
      • Market Share Analysis, 2024
        • By Product Type
        • By Application
        • By Distribution Channel
  18. Market Structure Analysis
    • Competition Dashboard
    • Competition Benchmarking
    • Market Share Analysis of Top Players
      • By Regional
      • By Product Type
      • By Application
      • By Distribution Channel
  19. Competition Analysis
    • Competition Deep Dive
      • AAK AB
        • Overview
        • Product Portfolio
        • Profitability by Market Segments (Product/Age /Sales Channel/Region)
        • Sales Footprint
        • Strategy Overview
          • Marketing Strategy
          • Product Strategy
          • Channel Strategy
      • Associated British Foods plc
        • Overview
        • Product Portfolio
        • Profitability by Market Segments (Product/Age /Sales Channel/Region)
        • Sales Footprint
        • Strategy Overview
          • Marketing Strategy
          • Product Strategy
          • Channel Strategy
      • British Bakels Ltd
        • Overview
        • Product Portfolio
        • Profitability by Market Segments (Product/Age /Sales Channel/Region)
        • Sales Footprint
        • Strategy Overview
          • Marketing Strategy
          • Product Strategy
          • Channel Strategy
      • Archer Daniels Midland Company
        • Overview
        • Product Portfolio
        • Profitability by Market Segments (Product/Age /Sales Channel/Region)
        • Sales Footprint
        • Strategy Overview
          • Marketing Strategy
          • Product Strategy
          • Channel Strategy
      • Cargill Inc.
        • Overview
        • Product Portfolio
        • Profitability by Market Segments (Product/Age /Sales Channel/Region)
        • Sales Footprint
        • Strategy Overview
          • Marketing Strategy
          • Product Strategy
          • Channel Strategy
      • E. I. du Pont de Nemours and Co.
        • Overview
        • Product Portfolio
        • Profitability by Market Segments (Product/Age /Sales Channel/Region)
        • Sales Footprint
        • Strategy Overview
          • Marketing Strategy
          • Product Strategy
          • Channel Strategy
      • BASF SE
        • Overview
        • Product Portfolio
        • Profitability by Market Segments (Product/Age /Sales Channel/Region)
        • Sales Footprint
        • Strategy Overview
          • Marketing Strategy
          • Product Strategy
          • Channel Strategy
      • Kerry Group Plc.
        • Overview
        • Product Portfolio
        • Profitability by Market Segments (Product/Age /Sales Channel/Region)
        • Sales Footprint
        • Strategy Overview
          • Marketing Strategy
          • Product Strategy
          • Channel Strategy
      • Ajinomoto Corporation Inc.
        • Overview
        • Product Portfolio
        • Profitability by Market Segments (Product/Age /Sales Channel/Region)
        • Sales Footprint
        • Strategy Overview
          • Marketing Strategy
          • Product Strategy
          • Channel Strategy
      • Dawn Food Products
        • Overview
        • Product Portfolio
        • Profitability by Market Segments (Product/Age /Sales Channel/Region)
        • Sales Footprint
        • Strategy Overview
          • Marketing Strategy
          • Product Strategy
          • Channel Strategy
      • Lonza Group AG
        • Overview
        • Product Portfolio
        • Profitability by Market Segments (Product/Age /Sales Channel/Region)
        • Sales Footprint
        • Strategy Overview
          • Marketing Strategy
          • Product Strategy
          • Channel Strategy
  20. Assumptions & Acronyms Used
  21. Research Methodology

List of Tables

  • Table 1: Global Market Value (USD Billion) Forecast by Region, 2020 to 2035
  • Table 2: Global Market Volume (Metric Tons) Forecast by Region, 2020 to 2035
  • Table 3: Global Market Value (USD Billion) Forecast by Product Type, 2020 to 2035
  • Table 4: Global Market Volume (Metric Tons) Forecast by Product Type, 2020 to 2035
  • Table 5: Global Market Value (USD Billion) Forecast by Application, 2020 to 2035
  • Table 6: Global Market Volume (Metric Tons) Forecast by Application, 2020 to 2035
  • Table 7: Global Market Value (USD Billion) Forecast by Distribution Channel, 2020 to 2035
  • Table 8: Global Market Volume (Metric Tons) Forecast by Distribution Channel, 2020 to 2035
  • Table 9: North America Market Value (USD Billion) Forecast by Country, 2020 to 2035
  • Table 10: North America Market Volume (Metric Tons) Forecast by Country, 2020 to 2035
  • Table 11: North America Market Value (USD Billion) Forecast by Product Type, 2020 to 2035
  • Table 12: North America Market Volume (Metric Tons) Forecast by Product Type, 2020 to 2035
  • Table 13: North America Market Value (USD Billion) Forecast by Application, 2020 to 2035
  • Table 14: North America Market Volume (Metric Tons) Forecast by Application, 2020 to 2035
  • Table 15: North America Market Value (USD Billion) Forecast by Distribution Channel, 2020 to 2035
  • Table 16: North America Market Volume (Metric Tons) Forecast by Distribution Channel, 2020 to 2035
  • Table 17: Latin America Market Value (USD Billion) Forecast by Country, 2020 to 2035
  • Table 18: Latin America Market Volume (Metric Tons) Forecast by Country, 2020 to 2035
  • Table 19: Latin America Market Value (USD Billion) Forecast by Product Type, 2020 to 2035
  • Table 20: Latin America Market Volume (Metric Tons) Forecast by Product Type, 2020 to 2035
  • Table 21: Latin America Market Value (USD Billion) Forecast by Application, 2020 to 2035
  • Table 22: Latin America Market Volume (Metric Tons) Forecast by Application, 2020 to 2035
  • Table 23: Latin America Market Value (USD Billion) Forecast by Distribution Channel, 2020 to 2035
  • Table 24: Latin America Market Volume (Metric Tons) Forecast by Distribution Channel, 2020 to 2035
  • Table 25: Western Europe Market Value (USD Billion) Forecast by Country, 2020 to 2035
  • Table 26: Western Europe Market Volume (Metric Tons) Forecast by Country, 2020 to 2035
  • Table 27: Western Europe Market Value (USD Billion) Forecast by Product Type, 2020 to 2035
  • Table 28: Western Europe Market Volume (Metric Tons) Forecast by Product Type, 2020 to 2035
  • Table 29: Western Europe Market Value (USD Billion) Forecast by Application, 2020 to 2035
  • Table 30: Western Europe Market Volume (Metric Tons) Forecast by Application, 2020 to 2035
  • Table 31: Western Europe Market Value (USD Billion) Forecast by Distribution Channel, 2020 to 2035
  • Table 32: Western Europe Market Volume (Metric Tons) Forecast by Distribution Channel, 2020 to 2035
  • Table 33: Eastern Europe Market Value (USD Billion) Forecast by Country, 2020 to 2035
  • Table 34: Eastern Europe Market Volume (Metric Tons) Forecast by Country, 2020 to 2035
  • Table 35: Eastern Europe Market Value (USD Billion) Forecast by Product Type, 2020 to 2035
  • Table 36: Eastern Europe Market Volume (Metric Tons) Forecast by Product Type, 2020 to 2035
  • Table 37: Eastern Europe Market Value (USD Billion) Forecast by Application, 2020 to 2035
  • Table 38: Eastern Europe Market Volume (Metric Tons) Forecast by Application, 2020 to 2035
  • Table 39: Eastern Europe Market Value (USD Billion) Forecast by Distribution Channel, 2020 to 2035
  • Table 40: Eastern Europe Market Volume (Metric Tons) Forecast by Distribution Channel, 2020 to 2035
  • Table 41: East Asia Market Value (USD Billion) Forecast by Country, 2020 to 2035
  • Table 42: East Asia Market Volume (Metric Tons) Forecast by Country, 2020 to 2035
  • Table 43: East Asia Market Value (USD Billion) Forecast by Product Type, 2020 to 2035
  • Table 44: East Asia Market Volume (Metric Tons) Forecast by Product Type, 2020 to 2035
  • Table 45: East Asia Market Value (USD Billion) Forecast by Application, 2020 to 2035
  • Table 46: East Asia Market Volume (Metric Tons) Forecast by Application, 2020 to 2035
  • Table 47: East Asia Market Value (USD Billion) Forecast by Distribution Channel, 2020 to 2035
  • Table 48: East Asia Market Volume (Metric Tons) Forecast by Distribution Channel, 2020 to 2035
  • Table 49: South Asia & Pacific Market Value (USD Billion) Forecast by Country, 2020 to 2035
  • Table 50: South Asia & Pacific Market Volume (Metric Tons) Forecast by Country, 2020 to 2035
  • Table 51: South Asia & Pacific Market Value (USD Billion) Forecast by Product Type, 2020 to 2035
  • Table 52: South Asia & Pacific Market Volume (Metric Tons) Forecast by Product Type, 2020 to 2035
  • Table 53: South Asia & Pacific Market Value (USD Billion) Forecast by Application, 2020 to 2035
  • Table 54: South Asia & Pacific Market Volume (Metric Tons) Forecast by Application, 2020 to 2035
  • Table 55: South Asia & Pacific Market Value (USD Billion) Forecast by Distribution Channel, 2020 to 2035
  • Table 56: South Asia & Pacific Market Volume (Metric Tons) Forecast by Distribution Channel, 2020 to 2035
  • Table 57: Middle East and Africa Market Value (USD Billion) Forecast by Country, 2020 to 2035
  • Table 58: Middle East and Africa Market Volume (Metric Tons) Forecast by Country, 2020 to 2035
  • Table 59: Middle East and Africa Market Value (USD Billion) Forecast by Product Type, 2020 to 2035
  • Table 60: Middle East and Africa Market Volume (Metric Tons) Forecast by Product Type, 2020 to 2035
  • Table 61: Middle East and Africa Market Value (USD Billion) Forecast by Application, 2020 to 2035
  • Table 62: Middle East and Africa Market Volume (Metric Tons) Forecast by Application, 2020 to 2035
  • Table 63: Middle East and Africa Market Value (USD Billion) Forecast by Distribution Channel, 2020 to 2035
  • Table 64: Middle East and Africa Market Volume (Metric Tons) Forecast by Distribution Channel, 2020 to 2035

List of Figures

  • Figure 1: Global Market Volume (Metric Tons) Forecast 2020 to 2035
  • Figure 2: Global Market Pricing Analysis
  • Figure 3: Global Market Value (USD Billion) Forecast 2020 to 2035
  • Figure 4: Global Market Value Share and BPS Analysis by Product Type, 2025 and 2035
  • Figure 5: Global Market Y-o-Y Growth Comparison by Product Type, 2025 to 2035
  • Figure 6: Global Market Attractiveness Analysis by Product Type
  • Figure 7: Global Market Value Share and BPS Analysis by Application, 2025 and 2035
  • Figure 8: Global Market Y-o-Y Growth Comparison by Application, 2025 to 2035
  • Figure 9: Global Market Attractiveness Analysis by Application
  • Figure 10: Global Market Value Share and BPS Analysis by Distribution Channel, 2025 and 2035
  • Figure 11: Global Market Y-o-Y Growth Comparison by Distribution Channel, 2025 to 2035
  • Figure 12: Global Market Attractiveness Analysis by Distribution Channel
  • Figure 13: Global Market Value (USD Billion) Share and BPS Analysis by Region, 2025 and 2035
  • Figure 14: Global Market Y-o-Y Growth Comparison by Region, 2025 to 2035
  • Figure 15: Global Market Attractiveness Analysis by Region
  • Figure 16: North America Market Incremental $ Opportunity, 2025 to 2035
  • Figure 17: Latin America Market Incremental $ Opportunity, 2025 to 2035
  • Figure 18: Western Europe Market Incremental $ Opportunity, 2025 to 2035
  • Figure 19: Eastern Europe Market Incremental $ Opportunity, 2025 to 2035
  • Figure 20: East Asia Market Incremental $ Opportunity, 2025 to 2035
  • Figure 21: South Asia & Pacific Market Incremental $ Opportunity, 2025 to 2035
  • Figure 22: Middle East and Africa Market Incremental $ Opportunity, 2025 to 2035
  • Figure 23: North America Market Value Share and BPS Analysis by Country, 2025 and 2035
  • Figure 24: North America Market Value Share and BPS Analysis by Product Type, 2025 and 2035
  • Figure 25: North America Market Y-o-Y Growth Comparison by Product Type, 2025 to 2035
  • Figure 26: North America Market Attractiveness Analysis by Product Type
  • Figure 27: North America Market Value Share and BPS Analysis by Application, 2025 and 2035
  • Figure 28: North America Market Y-o-Y Growth Comparison by Application, 2025 to 2035
  • Figure 29: North America Market Attractiveness Analysis by Application
  • Figure 30: North America Market Value Share and BPS Analysis by Distribution Channel, 2025 and 2035
  • Figure 31: North America Market Y-o-Y Growth Comparison by Distribution Channel, 2025 to 2035
  • Figure 32: North America Market Attractiveness Analysis by Distribution Channel
  • Figure 33: Latin America Market Value Share and BPS Analysis by Country, 2025 and 2035
  • Figure 34: Latin America Market Value Share and BPS Analysis by Product Type, 2025 and 2035
  • Figure 35: Latin America Market Y-o-Y Growth Comparison by Product Type, 2025 to 2035
  • Figure 36: Latin America Market Attractiveness Analysis by Product Type
  • Figure 37: Latin America Market Value Share and BPS Analysis by Application, 2025 and 2035
  • Figure 38: Latin America Market Y-o-Y Growth Comparison by Application, 2025 to 2035
  • Figure 39: Latin America Market Attractiveness Analysis by Application
  • Figure 40: Latin America Market Value Share and BPS Analysis by Distribution Channel, 2025 and 2035
  • Figure 41: Latin America Market Y-o-Y Growth Comparison by Distribution Channel, 2025 to 2035
  • Figure 42: Latin America Market Attractiveness Analysis by Distribution Channel
  • Figure 43: Western Europe Market Value Share and BPS Analysis by Country, 2025 and 2035
  • Figure 44: Western Europe Market Value Share and BPS Analysis by Product Type, 2025 and 2035
  • Figure 45: Western Europe Market Y-o-Y Growth Comparison by Product Type, 2025 to 2035
  • Figure 46: Western Europe Market Attractiveness Analysis by Product Type
  • Figure 47: Western Europe Market Value Share and BPS Analysis by Application, 2025 and 2035
  • Figure 48: Western Europe Market Y-o-Y Growth Comparison by Application, 2025 to 2035
  • Figure 49: Western Europe Market Attractiveness Analysis by Application
  • Figure 50: Western Europe Market Value Share and BPS Analysis by Distribution Channel, 2025 and 2035
  • Figure 51: Western Europe Market Y-o-Y Growth Comparison by Distribution Channel, 2025 to 2035
  • Figure 52: Western Europe Market Attractiveness Analysis by Distribution Channel
  • Figure 53: Eastern Europe Market Value Share and BPS Analysis by Country, 2025 and 2035
  • Figure 54: Eastern Europe Market Value Share and BPS Analysis by Product Type, 2025 and 2035
  • Figure 55: Eastern Europe Market Y-o-Y Growth Comparison by Product Type, 2025 to 2035
  • Figure 56: Eastern Europe Market Attractiveness Analysis by Product Type
  • Figure 57: Eastern Europe Market Value Share and BPS Analysis by Application, 2025 and 2035
  • Figure 58: Eastern Europe Market Y-o-Y Growth Comparison by Application, 2025 to 2035
  • Figure 59: Eastern Europe Market Attractiveness Analysis by Application
  • Figure 60: Eastern Europe Market Value Share and BPS Analysis by Distribution Channel, 2025 and 2035
  • Figure 61: Eastern Europe Market Y-o-Y Growth Comparison by Distribution Channel, 2025 to 2035
  • Figure 62: Eastern Europe Market Attractiveness Analysis by Distribution Channel
  • Figure 63: East Asia Market Value Share and BPS Analysis by Country, 2025 and 2035
  • Figure 64: East Asia Market Value Share and BPS Analysis by Product Type, 2025 and 2035
  • Figure 65: East Asia Market Y-o-Y Growth Comparison by Product Type, 2025 to 2035
  • Figure 66: East Asia Market Attractiveness Analysis by Product Type
  • Figure 67: East Asia Market Value Share and BPS Analysis by Application, 2025 and 2035
  • Figure 68: East Asia Market Y-o-Y Growth Comparison by Application, 2025 to 2035
  • Figure 69: East Asia Market Attractiveness Analysis by Application
  • Figure 70: East Asia Market Value Share and BPS Analysis by Distribution Channel, 2025 and 2035
  • Figure 71: East Asia Market Y-o-Y Growth Comparison by Distribution Channel, 2025 to 2035
  • Figure 72: East Asia Market Attractiveness Analysis by Distribution Channel
  • Figure 73: South Asia & Pacific Market Value Share and BPS Analysis by Country, 2025 and 2035
  • Figure 74: South Asia & Pacific Market Value Share and BPS Analysis by Product Type, 2025 and 2035
  • Figure 75: South Asia & Pacific Market Y-o-Y Growth Comparison by Product Type, 2025 to 2035
  • Figure 76: South Asia & Pacific Market Attractiveness Analysis by Product Type
  • Figure 77: South Asia & Pacific Market Value Share and BPS Analysis by Application, 2025 and 2035
  • Figure 78: South Asia & Pacific Market Y-o-Y Growth Comparison by Application, 2025 to 2035
  • Figure 79: South Asia & Pacific Market Attractiveness Analysis by Application
  • Figure 80: South Asia & Pacific Market Value Share and BPS Analysis by Distribution Channel, 2025 and 2035
  • Figure 81: South Asia & Pacific Market Y-o-Y Growth Comparison by Distribution Channel, 2025 to 2035
  • Figure 82: South Asia & Pacific Market Attractiveness Analysis by Distribution Channel
  • Figure 83: Middle East and Africa Market Value Share and BPS Analysis by Country, 2025 and 2035
  • Figure 84: Middle East and Africa Market Value Share and BPS Analysis by Product Type, 2025 and 2035
  • Figure 85: Middle East and Africa Market Y-o-Y Growth Comparison by Product Type, 2025 to 2035
  • Figure 86: Middle East and Africa Market Attractiveness Analysis by Product Type
  • Figure 87: Middle East and Africa Market Value Share and BPS Analysis by Application, 2025 and 2035
  • Figure 88: Middle East and Africa Market Y-o-Y Growth Comparison by Application, 2025 to 2035
  • Figure 89: Middle East and Africa Market Attractiveness Analysis by Application
  • Figure 90: Middle East and Africa Market Value Share and BPS Analysis by Distribution Channel, 2025 and 2035
  • Figure 91: Middle East and Africa Market Y-o-Y Growth Comparison by Distribution Channel, 2025 to 2035
  • Figure 92: Middle East and Africa Market Attractiveness Analysis by Distribution Channel
  • Figure 93: Global Market - Tier Structure Analysis
  • Figure 94: Global Market - Company Share Analysis

Frequently Asked Questions

What is the projected size of the baking ingredients market in 2025?

The market is valued at USD 20.4 billion in 2025.

What is the outlook on baking ingredients demand by 2035?

The market is forecasted to reach USD 41.1 billion by 2035, reflecting a CAGR of 7.2%.

Which segment leads the baking ingredients market by distribution channel in 2025?

Supermarkets & hypermarkets will lead the distribution channel segment, accounting for 36% of the global market share in 2025.

What is the top application sector for the baking ingredients market in 2025?

Bread will dominate the application segment with a 40% share in 2025.

Which country is projected to have the fastest-growing baking ingredients market?

Japan is projected to grow at the fastest rate, with a CAGR of 6.9% from 2025 to 2035.

Explore Similar Insights

Future Market Insights

Baking Ingredients Market