Baking Soda Substitute Market Size, Share, and Forecast Outlook 2025 to 2035

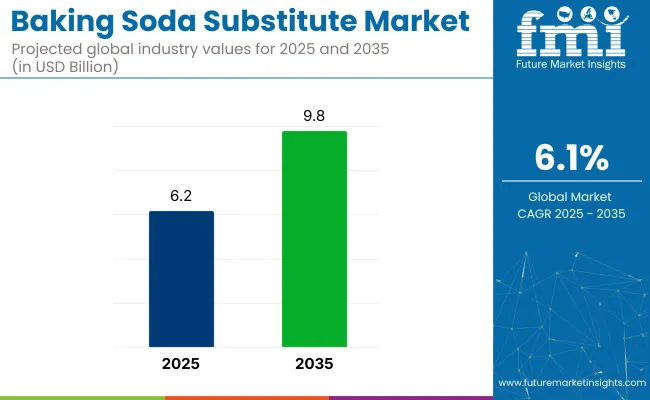
The baking soda substitute market is projected to reach a valuation of USD 6.2 billion in 2025 and is expected to grow to USD 9.8 billion by 2035. This expansion reflects a steady CAGR of 6.1% between 2025 and 2035.
Quick Stats of Baking Soda Substitute Market

  • Market Value (2025): USD 6.2 billion
  • Forecast Value (2035): USD 9.8 billion
  • Forecast CAGR (2025 to 2035): 6.1%
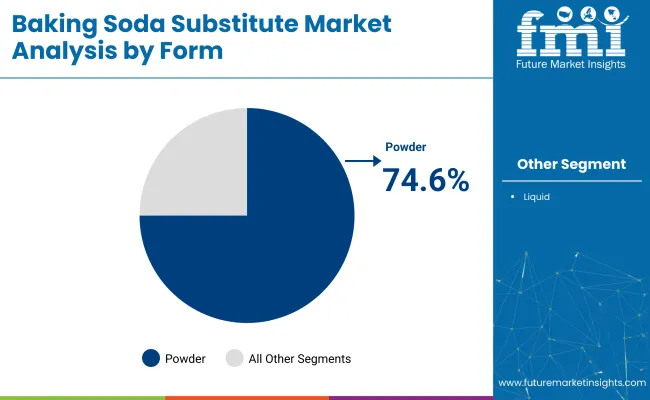
  • Leading Segment in 2025: Powder (74.6% share)
  • Key Growth Region: Asia Pacific (India is the fastest growing market with 7.1% CAGR)
  • Key Players: BHS Specialty Chemical Products, Bob’s Red Mill Natural Foods, Archer Daniels Midland Co., Cargill, Inc., Weikfield Products Co. Pvt. Ltd., Corbion N.V., AB Mauri, Koninklijke DSM N.V., Lesaffre et Compagnie, Lallemand Inc., Kudos Blends Limited, and Associated British Foods PLC (ABF).

Baking Soda Substitute Market

Metric Value
Market Value (2025) USD 6.2 billion
Market Value (2035) USD 9.8 billion
CAGR (2025 to 2035) 6.1%

This share is expected to expand gradually due to increasing preference among both industrial and household bakers for sodium-free or low-sodium substitutes to conventional baking soda. As health risks associated with excess sodium intake become more evident, demand is shifting toward ingredients that perform leavening functions without the adverse nutritional impact.

The baking soda substitutes market holds an estimated 5-7% share within the global leavening agents market, reflecting its niche but growing relevance as demand for non-sodium and clean-label alternatives increases. Within the broader bakery ingredients market, its share remains limited, around 1-2%, as traditional baking soda still dominates usage.

In the food additives market, spanning preservatives, emulsifiers, and leavening agents, product account for less than 0.5%. Their share in the clean-label ingredients segment is around 2-3%, driven by consumer interest in recognizable, non-chemical-sounding components. Within the food ingredients market, their presence is minimal, estimated at under 0.1%, but the segment is gradually expanding due to health concerns around sodium and synthetic food chemicals.

Consumer awareness regarding the side effects of overconsumption of sodium bicarbonate, such as hypokalemia, hypernatremia, kidney strain, and cardiovascular complications, has grown considerably in the last five years. This has driven food producers and end-users to explore viable alternatives. The use of potassium-based and ammonium-based compounds has gained traction, especially among consumers managing high blood pressure or other cardiovascular conditions.

The segment of health-conscious consumers seeking clean-label bakery products has remained instrumental in shaping product innovation and ingredient reformulation. In Aug, 2022 WASHINGTON, Agriculture Secretary Tom Vilsack announced details of the USA Department of Agriculture’s USD 300 million investment, including with American Rescue Plan funds, in a new organic transition initiative that will help build new and better markets and streams of income for farmers and producers.

Analyzing of Baking Soda Substitute Market by Top Investment Segments

The baking soda substitute market is segmented by form into powder and liquid. By product type, segmentation includes baking powder, potassium bicarbonate, yeast, eggs, and other. By end use application, the categories are household, foodservice, and food industry.

By sales channel, the market is divided into offline including supermarkets/hypermarkets, departmental stores, convenience store, and other sales channel, and online including company website and e-commerce platform. By region, the market covers North America, Europe, Asia Pacific, Latin America, and the Middle East & Africa.

Powder Leads Product Demand with 74.6% Share

The powder segment is expected to dominate the market by form, accounting for 74.6% of the market share in 2025. This dominance is attributed to the widespread use of powdered leavening agents such as baking powder and potassium bicarbonate across commercial and household baking applications.
  • The powdered form offers extended shelf life, ease of storage, and compatibility with automated blending systems in industrial baking environments. Its predictable reactivity and consistency under varying humidity and temperature conditions also make it the preferred choice among professional bakers and packaged food manufacturers.
  • The rising trend toward clean-label and sodium-reduced bakery products has further amplified demand for powder-based alternatives.

Baking Soda Substitute Market Analysis By Form

By Product Type, Baking Powder Accounts for Over 42.3% Share

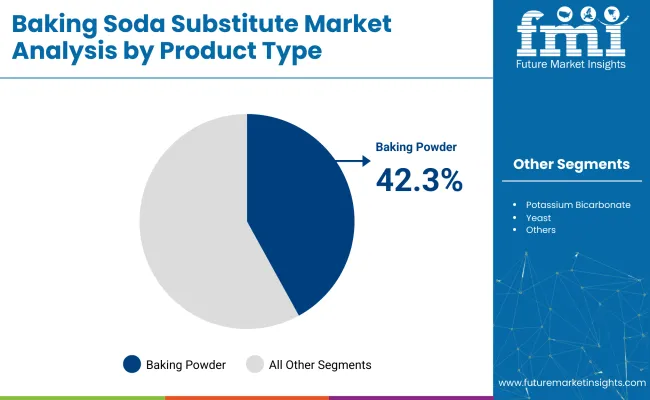
Baking powder is expected to lead the market by product type, capturing a projected market share of around 42.3% Share in 2025. This leading position is driven by its functional similarity to baking soda, ease of use in both home and industrial baking, and consistent leavening effect across a wide range of recipes.
  • Unlike other substitutes, baking powder does not require additional acidic ingredients to activate, which simplifies formulation for end users.
  • Growing preference stems from health-driven shifts away from sodium bicarbonate, particularly in North America and Europe, where consumers are more conscious of sodium intake. Its compatibility with both vegan and gluten-free recipes also reinforces its role in modern baking trends.

Baking Soda Substitute Market Analysis By Product Type

Food Industry to be the Major End Users Application with 51.8% Share

The food industry segment is expected to account for the largest share in the market, holding approximately 51.8% of total demand by end-use application. This dominance is being driven by the extensive use of leavening agents in large-scale production of bakery goods, snacks, and ready-to-eat products.

  • Industrial food manufacturers favor substitutes like baking powder and potassium bicarbonate due to their standardized performance, longer shelf life, and compatibility with high-speed production lines. As regulatory pressure on sodium content intensifies and clean-label demands increase, many manufacturers are reformulating recipes to include lower-sodium alternatives.
  • The shift toward functional ingredients that align with health-focused narratives has cemented the food industry's reliance on scalable, compliant substitutes for traditional baking soda formulations.

Rising Product Demand in Offline Sales with 64.7% Share

Offline sales channels are expected to lead the market, capturing approximately 64.7% of total market share in 2025.

  • Supermarkets and hypermarkets remain the most dominant sub-segment within this category, owing to their widespread physical presence, consumer familiarity, and product visibility. Shoppers often prefer purchasing leavening agents in person due to their association with other fresh and staple baking ingredients.
  • Retailers continue to prioritize shelf placement for health-forward substitutes, which has further bolstered offline uptake.

Top Baking Soda Substitute Market Dynamics

The market is growing due to rising health awareness, dietary restrictions, and clean-label trends, with consumers seeking allergen-free, organic, and functional alternatives. E-commerce growth and sustainability-driven innovations further fuel demand for diverse, eco-friendly substitutes in both home and commercial baking.

Rising Health Awareness Among Dietary Restrictions

The market is witnessing strong growth due to increasing consumer preference for natural, allergen-free, and clean-label ingredients. As health awareness rises, particularly among those with dietary restrictions such as gluten intolerance, allergies, or vegan lifestyles, substitutes like potassium bicarbonate, baking powder, egg whites, and yogurt are gaining popularity

  • Rising Health and Dietary Awareness: Increasing demand for allergen-free, gluten-free, and vegan-friendly ingredients is driving the shift toward natural products like potassium bicarbonate, egg whites, and yogurt.
  • Clean-Label and Organic Trends: Consumers are prioritizing transparency and simplicity in ingredient lists, pushing manufacturers to adopt non-GMO and organic alternatives that align with clean-label standards.
  • E-commerce and Product Innovation: Growth in online retail and advancements in food science are

Growing Demand for Baking Ingredients

The market is ripe with opportunities driven by evolving consumer lifestyles and sustainability trends. As more individuals shift toward clean-label, plant-based, and health-conscious diets, there is a growing demand for baking ingredients that align with these values.

This opens up space for innovation in functional substitutes that offer enhanced nutritional benefits, such as calcium-enriched or low-sodium alternatives. Companies can leverage these trends to introduce differentiated products tailored to specific dietary needs, including gluten-free, keto, or vegan-friendly baking mixes.
  • Expanding e-commerce channels enable niche brands to reach global audiences with minimal overhead.
  • Sustainability-conscious consumers are also driving interest in substitutes made from food waste or upcycled ingredients, creating a unique path for eco-friendly innovation in this space.
  • substitutes more accessible and functional, expanding their use in both home and commercial baking.

Analysis of Top Countries Manufacturing, Exporting and Supplying Baking Soda Substitute Globally

Country Wise Analysis Of Baking Soda Substitute Market

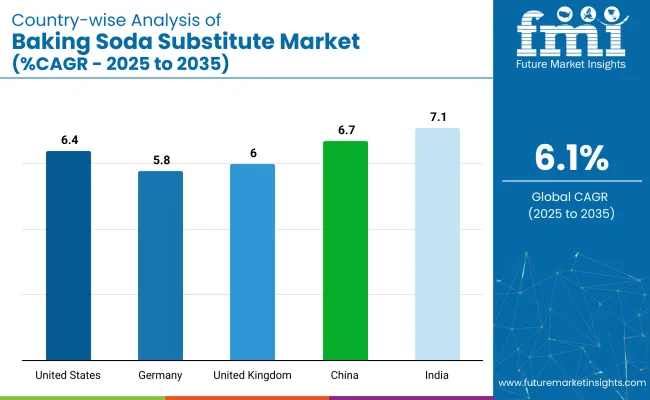
Countries CAGR (2025 to 2035)
United States 6.4%
Germany 5.8%
United Kingdom 6.0%
China 6.7%
India 7.1%

The baking soda substitute market, projected to grow at a global CAGR of 6.1% from 2025 to 2035, is experiencing varying growth rates across key countries. The United States, with a CAGR of 6.4%, is leading the growth due to its strong demand for products in food, healthcare, and cleaning sectors.

Germany follows closely with a 5.8% CAGR, reflecting steady growth driven by the expanding demand in the food and pharmaceutical industries. The United Kingdom is exhibiting a 6.0% CAGR, supported by stable consumer demand and increasing adoption in health and wellness applications.

China, with a 6.7% CAGR, is seeing the highest growth in the market, driven by growing consumer awareness and a rising demand for eco-friendly and chemical-free alternatives in both food and household products. India, exhibiting a 7.1% CAGR, represents the fastest-growing market, with an emerging trend towards natural and sustainable products, fueled by an expanding middle class and rising disposable incomes.

The report includes a detailed analysis of over 40 countries, with the top five countries highlighted for reference.

United States Baking Soda Substitute Industry Expansion

The USA baking soda substitute market is estimated to grow at a CAGR of 6.4% between 2025 and 2035.The growing demand for natural, health-conscious, and multi-purpose alternatives to traditional products is driving the market. Consumers are becoming more inclined towards sustainable, eco-friendly solutions for cleaning, personal care, and even baking.

The rise in awareness about the potential health concerns associated with excessive sodium bicarbonate consumption is also influencing this trend. As organic products gain momentum in the USA, many people are opting for product derived from natural and plant-based ingredients.

  • Increased awareness about the potential side effects of excessive baking soda consumption.
  • Rising demand for sustainable and eco-friendly household products.
  • Enhanced accessibility to a wide variety of baking soda substitutes through online retail platforms.

China Baking Soda Substitute Market Expansion

Demand for baking soda substitute in China is likely to grow at a CAGR of 6.7% during the forecast period. A key driver behind this growth is the rising consumer interest in health and wellness products, particularly among the younger demographic.

The growing middle class in China is also shifting towards premium, health-conscious, and organic alternatives to traditional chemicals used in daily activities, including baking, cleaning, and personal care. The Chinese government’s policies promoting a healthier lifestyle and environmental consciousness are pushing consumers toward safer and more natural products.

  • Growing interest in natural and organic products, especially among younger consumers.
  • Policies promoting healthy living and sustainability are boosting market growth.
  • The adoption of global food and lifestyle trends is driving demand for alternatives to traditional chemicals.

India Baking Soda Substitute Market Analysis and Growth Outlook

Sales of baking soda substitute in India is projected to grow at a CAGR of 7.1% from 2025 to 2035. As the Indian population becomes more urbanized and the middle class expands, there is a growing shift towards healthier lifestyles and natural products. Indian consumers are increasingly seeking alternatives that offer health benefits, particularly with concerns over synthetic chemicals in everyday products.

This trend is not only seen in the food and beverage industry but also in personal care, cleaning, and wellness products. The rapid growth of online shopping platforms is making these substitutes more accessible to a wider consumer base. India’s growing awareness of environmental sustainability is contributing to the shift towards eco-friendly alternatives.

  • The increasing urban middle class is adopting healthier, organic, and natural products.
  • Growing concerns over synthetic chemicals in food and personal care products.
  • Rising demand for sustainable and eco-friendly substitutes to traditional chemicals.

Baking Soda Substitute Market Growth Outlook in Germany

The Germany baking soda substitute market is estimated to grow at a CAGR of 5.8% during the forecast period. Germany has long been a leader in sustainability and eco-conscious consumer behavior, making it an ideal market for the growth of baking soda substitutes.

As consumers become more mindful of their health and the environment, the demand for natural and chemical-free alternatives to traditional products is on the rise. The German government’s strict environmental regulations, including those on the use of hazardous chemicals in household products, are also spurring the use of safer substitutes.

  • A culture of environmental consciousness drives the demand for non-toxic, eco-friendly alternatives.
  • Strict regulations encourage the shift towards safer, natural substitutes.
  • Rising demand for natural substitutes in food, cleaning, and personal care, driven by health-conscious consumers.

Future Outlook for Baking Soda Substitute Market in the United Kingdom

Demand for baking soda substitute in the United Kingdom is set to record a CAGR of 6% during the forecast period with a growing emphasis on sustainability, health, and wellness, UK consumers are increasingly opting for natural alternatives to traditional baking soda. This is especially true in sectors such as food, cosmetics, and household cleaning, where demand for eco-friendly and non-toxic products has surged.

The popularity of plant-based and organic diets in the UK is driving the need for baking soda substitutes in food preparation. The rise of online shopping and e-commerce platforms has also played a crucial role in providing easier access to these products.

  • Rising consumer interest in reducing their environmental footprint with eco-friendly products.
  • The demand for healthier food ingredients, including products, as part of the plant-based food trend.
  • Increased availability of natural and organic alternatives through online shopping platforms.

Leading Baking Soda Substitute Suppliers

The market is propelled by established industry leaders and emerging innovators in the sector. Key players such as Bob’s Red Mill Natural Foods, Cargill, Inc., and Archer Daniels Midland Co. are at the forefront with a diverse range of natural and allergen-free ingredients that cater to health-conscious consumers.

Companies like Weikfield Products Co. Pvt. Ltd and Corbion N.V. are enhancing product formulations with clean-label options, while AB Mauri and LesaffreetCompagnie focus on providing scalable, functional substitutes for the food and baking industries.

Innovations in organic and low-sodium alternatives by Koninklijke DSM N.V. and Lallem and Inc. align with growing consumer preferences for health-forward baking solutions. Kudos Blends Limited and Associated British Foods PLC (ABF) continue to meet the demand for versatile and eco-friendly substitutes in both commercial and home baking applications.

Recent Baking Soda Substitute Industry News

In March 2025, ADM group acquired Indicia Worldwide to transform the Global Marketing activation model, enabling and enhancing sustainable ROI for clients

Leading Players

  • BHS Specialty Chemical Products
  • Bob’s Red Mill Natural Foods
  • Archer Daniels Midland Co.
  • Cargill, Inc.
  • Weikfield Products Co. Pvt. Ltd
  • Corbion N.V.
  • AB Mauri
  • Koninklijke DSM N.V.
  • Lesaffre et Compagnie
  • Lallemand Inc.
  • Kudos Blends Limited
  • Associated British Foods PLC (ABF)

Report Coverage and Scope Summary

Report Attributes Details
Market Size (2025) USD 6.2 billion
Projected Market Size (2035) USD 9.8 billion
CAGR (2025 to 2035) 6.1%
Base Year for Estimation 2024
Historical Period 2020 to 2024
Projections Period 2025 to 2035
Quantitative Units USD billion for value and volume in kilo tons
Form Analyzed (Segment 1) Powder And Liquid.
Product Type Analyzed (Segment 2) Baking Powder, Potassium Bicarbonate, Yeast, Eggs, And Other.
End Use Application Analyzed (Segment 3) Household, Foodservice, And Food Industry.
Sales Channel Analyzed (Segment 4) Offline (Supermarkets/Hypermarkets, Departmental Stores, Convenience Store, And Other Sales Channel) And Online (Company Website And E-Commerce Platform).
Regions Covered North America, Europe, Asia Pacific, Middle East & Africa, Latin America
Countries Covered United States, Canada, Germany, United Kingdom, France, Italy, Spain, China, Japan, South Korea, India, Australia, Brazil, Mexico, Argentina, Saudi Arabia, UAE, South Africa
Key Players BHS Specialty Chemical Products, Bob’s Red Mill Natural Foods, Archer Daniels Midland Co., Cargill, Inc., Weikfield Products Co. Pvt. Ltd., Corbion N.V., AB Mauri, Koninklijke DSM N.V., Lesaffre et Compagnie, Lallem and Inc., Kudos Blends Limited, and Associated British Foods PLC (ABF).
Additional Attributes Dollar sales, market share, growth trends, consumer preferences, competitive landscape, regional demand, pricing strategies, and the impact of health-conscious trends on product formulation.

Key Segmentation

By Form:

The industry is segmented into powder and liquid.

By Product Type:

The industry is segmented into baking powder, potassium bicarbonate, yeast, eggs, and other.

By End Use Application:

The industry finds applications in household, foodservice, and food industry.

By Sales Channel:

The industry is segmented into offline (supermarkets/hypermarkets, departmental stores, convenience store, and other sales channel) and online (company website and e-commerce platform).

By Region:

The industry covers regions including North America, Europe, Asia Pacific, Latin America, and the Middle East & Africa.

Table of Content

  1. Executive Summary
  2. Industry Introduction, including Taxonomy and Market Definition
  3. Trends and Success Factors, including Macro-economic Factors, Market Dynamics, and Recent Industry Developments
  4. Global Market Demand Analysis 2020 to 2024 and Forecast 2025 to 2035, including Historical Analysis and Future Projections
  5. Pricing Analysis
  6. Global Market Analysis 2020 to 2024 and Forecast 2025 to 2035
    • Form
    • Product Type
    • End-Use Application
    • Sales Channel
  7. By Form
    • Powder
    • Liquid
  8. By Product Type
    • Baking Powder
    • Potassium Bicarbonate
    • Yeast
    • Eggs
    • Others (e.g. Ammonium bicarbonate, etc.)
  9. By End-Use Application
    • Household
    • Foodservice
    • Food Industry
  10. By Sales Channel
    • Offline Sales Channel
      • Supermarkets/Hypermarkets
      • Departmental Stores
      • Convenience Store
      • Other Sales Channel
    • Online Sales Channel
      • Company Website
      • E-commerce Platform
  11. By Region
    • North America
    • Latin America
    • Western Europe
    • Eastern Europe
    • East Asia
    • South Asia & Pacific
    • Central Asia
    • Russia and Belarus
    • Balkan & Baltic Countries
    • Middle East and Africa
  12. North America Sales Analysis 2020 to 2024 and Forecast 2025 to 2035, by Key Segments and Countries
  13. Latin America Sales Analysis 2020 to 2024 and Forecast 2025 to 2035, by Key Segments and Countries
  14. Western Europe Sales Analysis 2020 to 2024 and Forecast 2025 to 2035, by Key Segments and Countries
  15. Eastern Europe Sales Analysis 2020 to 2024 and Forecast 2025 to 2035, by Key Segments and Countries
  16. East Asia Sales Analysis 2020 to 2024 and Forecast 2025 to 2035, by Key Segments and Countries
  17. South Asia & Pacific Sales Analysis 2020 to 2024 and Forecast 2025 to 2035, by Key Segments and Countries
  18. Central Asia Sales Analysis 2020 to 2024 and Forecast 2025 to 2035, by Key Segments and Countries
  19. Russia and Belarus Sales Analysis 2020 to 2024 and Forecast 2025 to 2035, by Key Segments and Countries
  20. 20 Balkan & Baltic Countries Sales Analysis 2020 to 2024 and Forecast 2025 to 2035, by Key Segments and Countries
  21. 21 Middle East and Africa Sales Analysis 2020 to 2024 and Forecast 2025 to 2035, by Key Segments and Countries
  22. Sales Forecast to 2035 by Form, Product Type, End-Use Application, and Sales Channel for 30 Countries
  23. Competitive Assessment, Company Share Analysis by Key Players, and Competition Dashboard
  24. Company Profile
    • BHS Specialty Chemical Products
    • Bob’s Red Mill Natural Foods
    • Archer Daniels Midland Co.
    • Cargill, Inc.
    • Weikfield Products Co. Pvt. Ltd
    • Corbion N.V.
    • AB Mauri
    • Koninklijke DSM N.V.
    • Lesaffre et Compagnie
    • Lallemand Inc.
    • Other Prominent Market Player

List of Tables

  • Table 1: Global Market Value (USD Million) & Volume (MT) Forecast by Region, 2020-2035
  • Table 2: Global Market Value (USD Million) & Volume (MT) Forecast by Form, 2020-2035
  • Table 3: Global Market Value (USD Million) & Volume (MT) Forecast by Product Type, 2020-2035
  • Table 4: Global Market Value (USD Million) & Volume (MT) Forecast by End-Use Application, 2020-2035
  • Table 5: Global Market Value (USD Million) & Volume (MT) Forecast by Sales Channel, 2020-2035
  • Table 6: North America Market Value (USD Million) & Volume (MT) Forecast by Country, 2020-2035
  • Table 7: North America Market Value (USD Million) & Volume (MT) Forecast by Form, 2020-2035
  • Table 8: North America Market Value (USD Million) & Volume (MT) Forecast by Product Type, 2020-2035
  • Table 9: North America Market Value (USD Million) & Volume (MT) Forecast by End-Use Application, 2020-2035
  • Table 10: North America Market Value (USD Million) & Volume (MT) Forecast by Sales Channel, 2020-2035
  • Table 11: Latin America Market Value (USD Million) & Volume (MT) Forecast by Country, 2020-2035
  • Table 12: Latin America Market Value (USD Million) & Volume (MT) Forecast by Form, 2020-2035
  • Table 13: Latin America Market Value (USD Million) & Volume (MT) Forecast by Product Type, 2020-2035
  • Table 14: Latin America Market Value (USD Million) & Volume (MT) Forecast by End-Use Application, 2020-2035
  • Table 15: Latin America Market Value (USD Million) & Volume (MT) Forecast by Sales Channel, 2020-2035
  • Table 16: Western Europe Market Value (USD Million) & Volume (MT) Forecast by Country, 2020-2035
  • Table 17: Western Europe Market Value (USD Million) & Volume (MT) Forecast by Form, 2020-2035
  • Table 18: Western Europe Market Value (USD Million) & Volume (MT) Forecast by Product Type, 2020-2035
  • Table 19: Western Europe Market Value (USD Million) & Volume (MT) Forecast by End-Use Application, 2020-2035
  • Table 20: Western Europe Market Value (USD Million) & Volume (MT) Forecast by Sales Channel, 2020-2035
  • Table 21: Eastern Europe Market Value (USD Million) & Volume (MT) Forecast by Country, 2020-2035
  • Table 22: Eastern Europe Market Value (USD Million) & Volume (MT) Forecast by Form, 2020-2035
  • Table 23: Eastern Europe Market Value (USD Million) & Volume (MT) Forecast by Product Type, 2020-2035
  • Table 24: Eastern Europe Market Value (USD Million) & Volume (MT) Forecast by End-Use Application, 2020-2035
  • Table 25: Eastern Europe Market Value (USD Million) & Volume (MT) Forecast by Sales Channel, 2020-2035
  • Table 26: East Asia Market Value (USD Million) & Volume (MT) Forecast by Country, 2020-2035
  • Table 27: East Asia Market Value (USD Million) & Volume (MT) Forecast by Form, 2020-2035
  • Table 28: East Asia Market Value (USD Million) & Volume (MT) Forecast by Product Type, 2020-2035
  • Table 29: East Asia Market Value (USD Million) & Volume (MT) Forecast by End-Use Application, 2020-2035
  • Table 30: East Asia Market Value (USD Million) & Volume (MT) Forecast by Sales Channel, 2020-2035
  • Table 31: South Asia & Pacific Market Value (USD Million) & Volume (MT) Forecast by Country, 2020-2035
  • Table 32: South Asia & Pacific Market Value (USD Million) & Volume (MT) Forecast by Form, 2020-2035
  • Table 33: South Asia & Pacific Market Value (USD Million) & Volume (MT) Forecast by Product Type, 2020-2035
  • Table 34: South Asia & Pacific Market Value (USD Million) & Volume (MT) Forecast by End-Use Application, 2020-2035
  • Table 35: South Asia & Pacific Market Value (USD Million) & Volume (MT) Forecast by Sales Channel, 2020-2035
  • Table 36: Central Asia Market Value (USD Million) & Volume (MT) Forecast by Country, 2020-2035
  • Table 37: Central Asia Market Value (USD Million) & Volume (MT) Forecast by Form, 2020-2035
  • Table 38: Central Asia Market Value (USD Million) & Volume (MT) Forecast by Product Type, 2020-2035
  • Table 39: Central Asia Market Value (USD Million) & Volume (MT) Forecast by End-Use Application, 2020-2035
  • Table 40: Central Asia Market Value (USD Million) & Volume (MT) Forecast by Sales Channel, 2020-2035
  • Table 41: Russia and Belarus Market Value (USD Million) & Volume (MT) Forecast by Country, 2020-2035
  • Table 42: Russia and Belarus Market Value (USD Million) & Volume (MT) Forecast by Form, 2020-2035
  • Table 43: Russia and Belarus Market Value (USD Million) & Volume (MT) Forecast by Product Type, 2020-2035
  • Table 44: Russia and Belarus Market Value (USD Million) & Volume (MT) Forecast by End-Use Application, 2020-2035
  • Table 45: Russia and Belarus Market Value (USD Million) & Volume (MT) Forecast by Sales Channel, 2020-2035
  • Table 46: Balkan & Baltic Countries Market Value (USD Million) & Volume (MT) Forecast by Country, 2020-2035
  • Table 47: Balkan & Baltic Countries Market Value (USD Million) & Volume (MT) Forecast by Form, 2020-2035
  • Table 48: Balkan & Baltic Countries Market Value (USD Million) & Volume (MT) Forecast by Product Type, 2020-2035
  • Table 49: Balkan & Baltic Countries Market Value (USD Million) & Volume (MT) Forecast by End-Use Application, 2020-2035
  • Table 50: Balkan & Baltic Countries Market Value (USD Million) & Volume (MT) Forecast by Sales Channel, 2020-2035
  • Table 51: Middle East and Africa Market Value (USD Million) & Volume (MT) Forecast by Country, 2020-2035
  • Table 52: Middle East and Africa Market Value (USD Million) & Volume (MT) Forecast by Form, 2020-2035
  • Table 53: Middle East and Africa Market Value (USD Million) & Volume (MT) Forecast by Product Type, 2020-2035
  • Table 54: Middle East and Africa Market Value (USD Million) & Volume (MT) Forecast by End-Use Application, 2020-2035
  • Table 55: Middle East and Africa Market Value (USD Million) & Volume (MT) Forecast by Sales Channel, 2020-2035

List of Figures

  • Figure 1: Global Market Value Share (%), Growth Rate (Y-o-Y), and Value (USD Million) & Volume (MT) Projection by Form, 2020-2035
  • Figure 2: Global Market Value Share (%), Growth Rate (Y-o-Y), and Value (USD Million) & Volume (MT) Projection by Product Type, 2020-2035
  • Figure 3: Global Market Value Share (%), Growth Rate (Y-o-Y), and Value (USD Million) & Volume (MT) Projection by End-Use Application, 2020-2035
  • Figure 4: Global Market Value Share (%), Growth Rate (Y-o-Y), and Value (USD Million) & Volume (MT) Projection by Sales Channel, 2020-2035
  • Figure 5: Global Market Value Share (%), Growth Rate (Y-o-Y), and Value (USD Million) & Volume (MT) Projection by Region, 2020-2035
  • Figure 6: North America Market Value Share (%), Growth Rate (Y-o-Y), and Value (USD Million) & Volume (MT) Projection by Form, 2020-2035
  • Figure 7: North America Market Value Share (%), Growth Rate (Y-o-Y), and Value (USD Million) & Volume (MT) Projection by Product Type, 2020-2035
  • Figure 8: North America Market Value Share (%), Growth Rate (Y-o-Y), and Value (USD Million) & Volume (MT) Projection by End-Use Application, 2020-2035
  • Figure 9: North America Market Value Share (%), Growth Rate (Y-o-Y), and Value (USD Million) & Volume (MT) Projection by Sales Channel, 2020-2035
  • Figure 10: North America Market Value Share (%), Growth Rate (Y-o-Y), and Value (USD Million) & Volume (MT) Projection by Country, 2020-2035
  • Figure 11: Latin America Market Value Share (%), Growth Rate (Y-o-Y), and Value (USD Million) & Volume (MT) Projection by Form, 2020-2035
  • Figure 12: Latin America Market Value Share (%), Growth Rate (Y-o-Y), and Value (USD Million) & Volume (MT) Projection by Product Type, 2020-2035
  • Figure 13: Latin America Market Value Share (%), Growth Rate (Y-o-Y), and Value (USD Million) & Volume (MT) Projection by End-Use Application, 2020-2035
  • Figure 14: Latin America Market Value Share (%), Growth Rate (Y-o-Y), and Value (USD Million) & Volume (MT) Projection by Sales Channel, 2020-2035
  • Figure 15: Latin America Market Value Share (%), Growth Rate (Y-o-Y), and Value (USD Million) & Volume (MT) Projection by Country, 2020-2035
  • Figure 16: Western Europe Market Value Share (%), Growth Rate (Y-o-Y), and Value (USD Million) & Volume (MT) Projection by Form, 2020-2035
  • Figure 17: Western Europe Market Value Share (%), Growth Rate (Y-o-Y), and Value (USD Million) & Volume (MT) Projection by Product Type, 2020-2035
  • Figure 18: Western Europe Market Value Share (%), Growth Rate (Y-o-Y), and Value (USD Million) & Volume (MT) Projection by End-Use Application, 2020-2035
  • Figure 19: Western Europe Market Value Share (%), Growth Rate (Y-o-Y), and Value (USD Million) & Volume (MT) Projection by Sales Channel, 2020-2035
  • Figure 20: Western Europe Market Value Share (%), Growth Rate (Y-o-Y), and Value (USD Million) & Volume (MT) Projection by Country, 2020-2035
  • Figure 21: Eastern Europe Market Value Share (%), Growth Rate (Y-o-Y), and Value (USD Million) & Volume (MT) Projection by Form, 2020-2035
  • Figure 22: Eastern Europe Market Value Share (%), Growth Rate (Y-o-Y), and Value (USD Million) & Volume (MT) Projection by Product Type, 2020-2035
  • Figure 23: Eastern Europe Market Value Share (%), Growth Rate (Y-o-Y), and Value (USD Million) & Volume (MT) Projection by End-Use Application, 2020-2035
  • Figure 24: Eastern Europe Market Value Share (%), Growth Rate (Y-o-Y), and Value (USD Million) & Volume (MT) Projection by Sales Channel, 2020-2035
  • Figure 25: Eastern Europe Market Value Share (%), Growth Rate (Y-o-Y), and Value (USD Million) & Volume (MT) Projection by Country, 2020-2035
  • Figure 26: East Asia Market Value Share (%), Growth Rate (Y-o-Y), and Value (USD Million) & Volume (MT) Projection by Form, 2020-2035
  • Figure 27: East Asia Market Value Share (%), Growth Rate (Y-o-Y), and Value (USD Million) & Volume (MT) Projection by Product Type, 2020-2035
  • Figure 28: East Asia Market Value Share (%), Growth Rate (Y-o-Y), and Value (USD Million) & Volume (MT) Projection by End-Use Application, 2020-2035
  • Figure 29: East Asia Market Value Share (%), Growth Rate (Y-o-Y), and Value (USD Million) & Volume (MT) Projection by Sales Channel, 2020-2035
  • Figure 30: East Asia Market Value Share (%), Growth Rate (Y-o-Y), and Value (USD Million) & Volume (MT) Projection by Country, 2020-2035
  • Figure 31: South Asia & Pacific Market Value Share (%), Growth Rate (Y-o-Y), and Value (USD Million) & Volume (MT) Projection by Form, 2020-2035
  • Figure 32: South Asia & Pacific Market Value Share (%), Growth Rate (Y-o-Y), and Value (USD Million) & Volume (MT) Projection by Product Type, 2020-2035
  • Figure 33: South Asia & Pacific Market Value Share (%), Growth Rate (Y-o-Y), and Value (USD Million) & Volume (MT) Projection by End-Use Application, 2020-2035
  • Figure 34: South Asia & Pacific Market Value Share (%), Growth Rate (Y-o-Y), and Value (USD Million) & Volume (MT) Projection by Sales Channel, 2020-2035
  • Figure 35: South Asia & Pacific Market Value Share (%), Growth Rate (Y-o-Y), and Value (USD Million) & Volume (MT) Projection by Country, 2020-2035
  • Figure 36: Central Asia Market Value Share (%), Growth Rate (Y-o-Y), and Value (USD Million) & Volume (MT) Projection by Form, 2020-2035
  • Figure 37: Central Asia Market Value Share (%), Growth Rate (Y-o-Y), and Value (USD Million) & Volume (MT) Projection by Product Type, 2020-2035
  • Figure 38: Central Asia Market Value Share (%), Growth Rate (Y-o-Y), and Value (USD Million) & Volume (MT) Projection by End-Use Application, 2020-2035
  • Figure 39: Central Asia Market Value Share (%), Growth Rate (Y-o-Y), and Value (USD Million) & Volume (MT) Projection by Sales Channel, 2020-2035
  • Figure 40: Central Asia Market Value Share (%), Growth Rate (Y-o-Y), and Value (USD Million) & Volume (MT) Projection by Country, 2020-2035
  • Figure 41: Russia and Belarus Market Value Share (%), Growth Rate (Y-o-Y), and Value (USD Million) & Volume (MT) Projection by Form, 2020-2035
  • Figure 42: Russia and Belarus Market Value Share (%), Growth Rate (Y-o-Y), and Value (USD Million) & Volume (MT) Projection by Product Type, 2020-2035
  • Figure 43: Russia and Belarus Market Value Share (%), Growth Rate (Y-o-Y), and Value (USD Million) & Volume (MT) Projection by End-Use Application, 2020-2035
  • Figure 44: Russia and Belarus Market Value Share (%), Growth Rate (Y-o-Y), and Value (USD Million) & Volume (MT) Projection by Sales Channel, 2020-2035
  • Figure 45: Russia and Belarus Market Value Share (%), Growth Rate (Y-o-Y), and Value (USD Million) & Volume (MT) Projection by Country, 2020-2035
  • Figure 46: Balkan & Baltic Countries Market Value Share (%), Growth Rate (Y-o-Y), and Value (USD Million) & Volume (MT) Projection by Form, 2020-2035
  • Figure 47: Balkan & Baltic Countries Market Value Share (%), Growth Rate (Y-o-Y), and Value (USD Million) & Volume (MT) Projection by Product Type, 2020-2035
  • Figure 48: Balkan & Baltic Countries Market Value Share (%), Growth Rate (Y-o-Y), and Value (USD Million) & Volume (MT) Projection by End-Use Application, 2020-2035
  • Figure 49: Balkan & Baltic Countries Market Value Share (%), Growth Rate (Y-o-Y), and Value (USD Million) & Volume (MT) Projection by Sales Channel, 2020-2035
  • Figure 50: Balkan & Baltic Countries Market Value Share (%), Growth Rate (Y-o-Y), and Value (USD Million) & Volume (MT) Projection by Country, 2020-2035
  • Figure 51: Middle East and Africa Market Value Share (%), Growth Rate (Y-o-Y), and Value (USD Million) & Volume (MT) Projection by Form, 2020-2035
  • Figure 52: Middle East and Africa Market Value Share (%), Growth Rate (Y-o-Y), and Value (USD Million) & Volume (MT) Projection by Product Type, 2020-2035
  • Figure 53: Middle East and Africa Market Value Share (%), Growth Rate (Y-o-Y), and Value (USD Million) & Volume (MT) Projection by End-Use Application, 2020-2035
  • Figure 54: Middle East and Africa Market Value Share (%), Growth Rate (Y-o-Y), and Value (USD Million) & Volume (MT) Projection by Sales Channel, 2020-2035
  • Figure 55: Middle East and Africa Market Value Share (%), Growth Rate (Y-o-Y), and Value (USD Million) & Volume (MT) Projection by Country, 2020-2035

Frequently Asked Questions

What is the estimated market size of the baking soda substitute industry in 2025?

The industry is valued at USD 6.2 billion in 2025.

What is the projected industry size of the baking soda substitute industry by 2035?

It is forecasted to reach USD 9.8 billion by 2035.

What is the expected CAGR for the baking soda substitute industry between 2025 and 2035?

The industry is anticipated to grow at a CAGR of 6.1% during this period.

Which segment is expected to lead the baking soda substitute market in 2025?

Powder forms are projected to lead the market with a 74.6% share in 2025.

Which region is expected to witness the highest growth in the baking soda substitute market?

Asia Pacific, particularly the India, is expected to be the key growth region with a projected growth rate of 7.1%.

Explore Similar Insights

Future Market Insights

Baking Soda Substitute Market