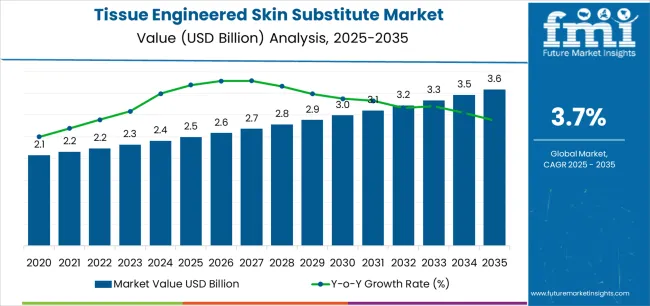
The Tissue Engineered Skin Substitute Market is estimated to be valued at USD 2.5 billion in 2025 and is projected to reach USD 3.6 billion by 2035, registering a compound annual growth rate (CAGR) of 3.7% over the forecast period.
The tissue engineered skin substitute market is experiencing strong growth due to the increasing prevalence of chronic wounds, burns, and skin injuries requiring advanced regenerative treatments. Rising awareness about bioengineered solutions and the growing adoption of tissue-engineered products in clinical settings are driving market expansion. The current scenario is marked by significant advancements in biomaterials, cell-based technologies, and 3D bioprinting methods that enhance product functionality and integration with native tissues.
Favorable regulatory frameworks and healthcare investments in wound management are strengthening market development. The future outlook remains optimistic as demand for effective, durable, and biologically compatible skin substitutes continues to rise across hospitals and specialized care centers.
Growth rationale is anchored in the clinical effectiveness of these products, increasing patient acceptance, and continuous innovation aimed at improving healing outcomes and reducing recovery time These factors collectively position the market for sustainable expansion and technological evolution over the forecast period.
| Metric | Value |
|---|---|
| Tissue Engineered Skin Substitute Market Estimated Value in (2025 E) | USD 2.5 billion |
| Tissue Engineered Skin Substitute Market Forecast Value in (2035 F) | USD 3.6 billion |
| Forecast CAGR (2025 to 2035) | 3.7% |
The market is segmented by Product, Material, Application, and End User and region. By Product, the market is divided into Acellular Skin Substitutes, Biologic Skin Substitute, Cellular Skin Substitutes, and Synthetic Skin Substitutes. In terms of Material, the market is classified into Natural and Synthetic. Based on Application, the market is segmented into Chronic Wounds, Acute Wounds, and Other Applications. By End User, the market is divided into Hospital, Specialty Clinics, Ambulatory Surgical Centers, and Research Laboratory. Regionally, the market is classified into North America, Latin America, Western Europe, Eastern Europe, Balkan & Baltic Countries, Russia & Belarus, Central Asia, East Asia, South Asia & Pacific, and the Middle East & Africa.
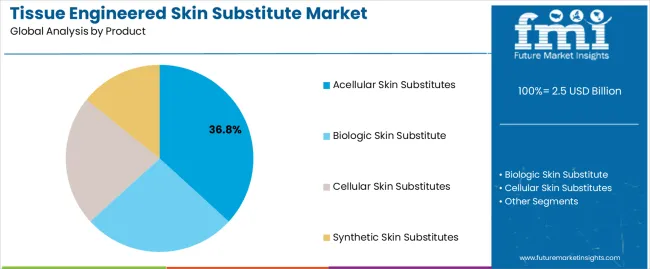
The acellular skin substitutes segment, accounting for 36.80% of the product category, has emerged as the leading product type owing to its wide clinical acceptance and proven ability to promote tissue regeneration without immunogenic response. The segment’s dominance is supported by reduced risk of rejection, ease of storage, and cost-effectiveness compared to cellular alternatives.
Hospitals and wound care centers are increasingly adopting these substitutes due to consistent healing outcomes and simplified handling procedures. Ongoing research into acellular scaffolds with enhanced biomechanical strength and improved vascularization potential is further driving adoption.
The segment’s scalability in production and compatibility with different wound types ensure its continued preference among clinicians These attributes are expected to sustain market leadership and reinforce its critical role in advanced wound management applications.
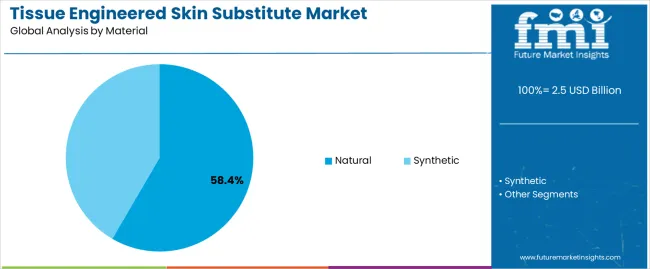
The natural material segment, holding 58.40% of the material category, is leading the market due to superior biocompatibility, biodegradability, and ability to mimic native extracellular matrix structures. The preference for collagen, gelatin, and chitosan-based scaffolds has strengthened as they support cellular adhesion, proliferation, and tissue regeneration.
Demand is further driven by regulatory acceptance and patient preference for biologically derived materials. Manufacturing advancements enabling controlled crosslinking and improved mechanical stability have enhanced product performance.
Additionally, partnerships between material developers and medical device manufacturers have facilitated commercial availability of next-generation natural substitutes The segment’s prominence is expected to continue as healthcare providers prioritize safe and biologically responsive materials in reconstructive and regenerative applications.
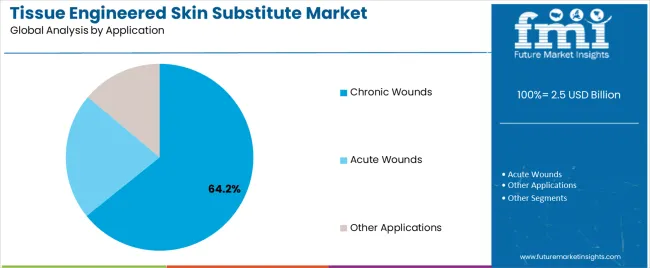
The chronic wounds segment, representing 64.20% of the application category, has maintained dominance due to the rising incidence of diabetic ulcers, venous leg ulcers, and pressure sores requiring long-term management. Increased healthcare spending on wound care and growing adoption of advanced dressings and bioengineered grafts have bolstered demand.
Clinical preference for tissue-engineered substitutes in chronic wound treatment is driven by their ability to accelerate healing, prevent infections, and minimize complications. Hospitals and specialty clinics are increasingly integrating these products into standard treatment protocols.
Continuous innovation in product design, including antimicrobial coatings and enhanced moisture control, is supporting improved patient outcomes The segment is projected to sustain its leading position as the global burden of chronic wounds continues to increase, reinforcing its importance in the overall market landscape.
Ongoing research and development efforts are focused on enhancing the properties of tissue engineered skin substitutes, such as improved biocompatibility, structural integrity, and functionality. The innovations are expected to drive market growth.
The scope for tissue engineered skin substitute rose at a 7.4% CAGR between 2020 and 2025. The global market is anticipated to witness a downwards CAGR of 3.9% over the forecast period 2025 to 2035.
The historical period saw steady growth in the tissue engineered skin substitute market driven by factors such as increasing incidence of chronic wounds, burns, and trauma cases, advancements in regenerative medicine, and growing aging population.
Significant advancements in tissue engineering, biomaterials science, and regenerative medicine LED to the development of more sophisticated tissue engineered skin substitutes with enhanced healing properties and biocompatibility, during the historical period.
Growing awareness among healthcare professionals and patients regarding the benefits of tissue engineered skin substitutes in wound management also contributed to market expansion and adoption.
The forecast period is anticipated to witness the emergence of new applications for tissue engineered skin substitutes beyond wound healing, including cosmetic surgery, dermatology, and reconstructive surgery, thereby expanding the market potential.
The trend towards personalized medicine and tailored treatment approaches is expected to drive demand for customized tissue engineered skin substitutes designed to meet individual patient needs and preferences.
Innovations in drug delivery systems, nanotechnology, and biomaterials science are expected to enhance the delivery efficiency and therapeutic efficacy of tissue engineered skin substitutes, further driving market growth.
There is a growing demand for effective wound management solutions, including tissue engineered skin substitutes, with the rise in burn injuries, trauma cases, and chronic wounds.
The field of regenerative medicine has witnessed significant advancements, leading to the development of more sophisticated tissue engineered skin substitutes with enhanced healing properties.
The global population is aging, leading to a higher prevalence of chronic wounds and diabetic ulcers. Tissue engineered skin substitutes offer a promising solution for the management of these conditions.
Diabetes is a significant risk factor for chronic wounds and ulcers. The demand for advanced wound care products, including tissue engineered skin substitutes, is expected to increase, as the prevalence of diabetes continues to rise worldwide.
Tissue engineered skin substitutes can be expensive, making them less accessible to patients and healthcare facilities with limited financial resources. Cost constraints are anticipated to hinder market penetration and adoption rates, particularly in developing countries and underprivileged communities.
Stringent regulatory requirements and lengthy approval processes for tissue engineered products can pose barriers to market entry for manufacturers. Compliance with complex regulatory frameworks adds time and costs to product development and commercialization efforts, potentially delaying market launch and hampering innovation.
Inadequate reimbursement coverage and reimbursement restrictions for tissue engineered skin substitutes may limit patient access and healthcare provider adoption. Reimbursement policies vary across different healthcare systems and reimbursement schemes, affecting market uptake and utilization rates.
Tissue engineering involves complex biological and engineering principles, requiring specialized expertise, infrastructure, and resources for product development and manufacturing. Technical challenges related to scalability, reproducibility, and quality control are expected to impede the commercialization and widespread adoption of tissue engineered skin substitutes.
The below table showcases revenues in terms of the top 5 leading countries, spearheaded by India and France. The countries are expected to lead the market through 2035.
| Countries | Forecast CAGRs from 2025 to 2035 |
|---|---|
| The United States | 2.3% |
| The United Kingdom | 0.8% |
| Germany | 1.9% |
| France | 2.7% |
| India | 5.8% |
The tissue engineered skin substitute market in the United States expected to expand at a CAGR of 2.3% through 2035. The country has a significant prevalence of chronic wounds, including diabetic foot ulcers, venous leg ulcers, and pressure ulcers.
The incidence of chronic wounds is expected to increase, as the population ages and the prevalence of chronic diseases such as diabetes and obesity rises, driving demand for tissue engineered skin substitutes.
The United States is a hub for medical research and innovation, with significant investments in biotechnology, regenerative medicine, and tissue engineering. Ongoing advancements in technology and biomaterials science contribute to the development of more advanced and effective tissue engineered skin substitutes, driving market growth.
The tissue engineered skin substitute market in the United Kingdom is anticipated to expand at a CAGR of 0.8% through 2035. The country has a well-developed healthcare infrastructure with a comprehensive National Health Service providing universal healthcare coverage.
Access to specialized wound care services, wound clinics, and multidisciplinary wound care teams facilitates the adoption of advanced wound care treatments, including tissue engineered skin substitutes.
Regulatory agencies such as the Medicines and Healthcare products Regulatory Agency ensure the safety, efficacy, and quality of medical devices and tissue engineered products in the United Kingdom. A clear regulatory framework and streamlined approval processes facilitate market entry for manufacturers and promote innovation in the tissue engineered skin substitute market.
Tissue engineered skin substitute trends in Germany are taking a turn for the better. A 1.9% CAGR is forecast for the country from 2025 to 2035. Germany emphasizes evidence based medicine and clinical guidelines in healthcare decision making.
Clinical evidence supporting the safety, efficacy, and cost effectiveness of tissue engineered skin substitutes contributes to their adoption and integration into clinical practice guidelines, driving market growth.
Adequate healthcare funding and reimbursement policies support patient access to advanced wound care treatments, including tissue engineered skin substitutes. Reimbursement coverage from the statutory health insurance system ensures affordability and accessibility of innovative wound care therapies, driving market growth and adoption.
The tissue engineered skin substitute market in France is poised to expand at a CAGR of 2.7% through 2035. Public health initiatives and educational campaigns raise awareness about the prevention, early detection, and management of chronic wounds in France. Patient education, healthcare provider training, and community outreach programs promote the use of best practices in wound care, including the incorporation of tissue engineered skin substitutes where appropriate.
Collaborative partnerships between academia, industry, healthcare providers, and government entities drive research and development efforts, technology transfer, and knowledge exchange in the field of tissue engineering and wound care. Strategic collaborations accelerate product commercialization and expand market access for tissue engineered skin substitutes in France.
The tissue engineered skin substitute market in India is anticipated to expand at a CAGR of 5.8% through 2035. There is growing awareness among healthcare providers and patients in India about advanced medical treatments and technologies. Patients increasingly seek effective wound care solutions to improve healing outcomes and quality of life, driving the adoption of tissue engineered skin substitutes.
India has a high prevalence of traumatic injuries resulting from road accidents, industrial mishaps, and natural disasters. Traumatic injuries often lead to severe skin damage and wound complications, creating a demand for advanced wound care products, including tissue engineered skin substitutes.
The below table highlights how biologic skin substitute segment is projected to lead the market in terms of product, and is expected to account for a share of 49.0% in 2025. Based on application, the chronic wounds segment is expected to account for a share of 70.0% in 2025.
| Category | Market Shares in 2025 |
|---|---|
| Biologic Skin Substitute | 49.0% |
| Chronic Wounds | 70.0% |
Based on product, the biologic skin substitute segment is expected to continue dominating the tissue engineered skin substitute market. Biologic skin substitutes are derived from natural sources such as human cells, tissues, and extracellular matrices, making them highly biocompatible and conducive to natural healing processes. The substitutes closely mimic the structure and function of native skin, promoting cell adhesion, proliferation, and tissue regeneration.
Biologic skin substitutes contain bioactive molecules, growth factors, and cytokines that facilitate wound healing by promoting angiogenesis, collagen deposition, and reepithelialization. The substitutes accelerate the healing process, reduce inflammation, and minimize scarring, leading to improved clinical outcomes for patients.
In terms of application, the chronic wounds segment is expected to continue dominating the tissue engineered skin substitute market, attributed to several key factors.
Chronic wounds, including diabetic foot ulcers, venous leg ulcers, pressure ulcers, and arterial ulcers, represent a significant healthcare burden worldwide. The aging population, rising incidence of diabetes, vascular diseases, and obesity contribute to the growing prevalence of chronic wounds, driving demand for effective wound care solutions.
Chronic wounds are challenging to manage and often fail to heal despite conventional wound care interventions. The lack of effective treatment options for chronic wounds underscores the need for advanced wound care solutions, including tissue engineered skin substitutes, to promote healing, prevent complications, and improve patient outcomes.
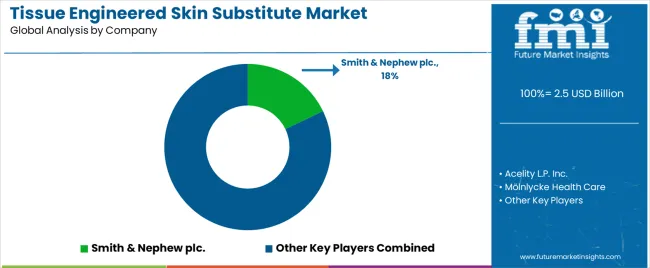
The competitive landscape of the tissue engineered skin substitute market is characterized by a mix of established players, emerging companies, research institutions, and academic centers.
The entities are engaged in research, development, manufacturing, and commercialization of tissue engineered skin substitutes, aiming to address the unmet needs of patients with acute and chronic wounds worldwide.
Company Portfolio
| Attribute | Details |
|---|---|
| Estimated Market Size in 2025 | USD 2.5 billion |
| Projected Market Valuation in 2035 | USD 3.6 billion |
| Value-based CAGR 2025 to 2035 | 3.7% |
| Forecast Period | 2025 to 2035 |
| Historical Data Available for | 2020 to 2025 |
| Market Analysis | Value in USD million |
| Key Regions Covered | North America; Latin America; Western Europe; Eastern Europe; South Asia and Pacific; East Asia; The Middle East & Africa |
| Key Market Segments Covered | Product, Material, Application, End User, Region |
| Key Countries Profiled | The United States, Canada, Brazil, Mexico, Germany, The United Kingdom, France, Spain, Italy, Russia, Poland, Czech Republic, Romania, India, Bangladesh, Australia, New Zealand, China, Japan, South Korea, GCC countries, South Africa, Israel |
| Key Companies Profiled | Smith & Nephew plc.; Acelity L.P. Inc.; Mölnlycke Health Care; Integra Life Sciences; Allergan plc; Regenicin; Organogenesis Inc.; MiMedx; LifeNet Health; Kerecis; Medline Industries Inc. |
The global tissue engineered skin substitute market is estimated to be valued at USD 2.5 billion in 2025.
The market size for the tissue engineered skin substitute market is projected to reach USD 3.6 billion by 2035.
The tissue engineered skin substitute market is expected to grow at a 3.7% CAGR between 2025 and 2035.
The key product types in tissue engineered skin substitute market are acellular skin substitutes, _acellular skin substitutes based on amniotic membrane, _other acellular skin substitutes, biologic skin substitute, _allograft, _xenograft, cellular skin substitutes, _cellular skin substitute based on amniotic membrane, _other cellular skin substitutes and synthetic skin substitutes.
In terms of material, natural segment to command 58.4% share in the tissue engineered skin substitute market in 2025.


Our Research Products

The "Full Research Suite" delivers actionable market intel, deep dives on markets or technologies, so clients act faster, cut risk, and unlock growth.

The Leaderboard benchmarks and ranks top vendors, classifying them as Established Leaders, Leading Challengers, or Disruptors & Challengers.

Locates where complements amplify value and substitutes erode it, forecasting net impact by horizon

We deliver granular, decision-grade intel: market sizing, 5-year forecasts, pricing, adoption, usage, revenue, and operational KPIs—plus competitor tracking, regulation, and value chains—across 60 countries broadly.

Spot the shifts before they hit your P&L. We track inflection points, adoption curves, pricing moves, and ecosystem plays to show where demand is heading, why it is changing, and what to do next across high-growth markets and disruptive tech

Real-time reads of user behavior. We track shifting priorities, perceptions of today’s and next-gen services, and provider experience, then pace how fast tech moves from trial to adoption, blending buyer, consumer, and channel inputs with social signals (#WhySwitch, #UX).

Partner with our analyst team to build a custom report designed around your business priorities. From analysing market trends to assessing competitors or crafting bespoke datasets, we tailor insights to your needs.
Supplier Intelligence
Discovery & Profiling
Capacity & Footprint
Performance & Risk
Compliance & Governance
Commercial Readiness
Who Supplies Whom
Scorecards & Shortlists
Playbooks & Docs
Category Intelligence
Definition & Scope
Demand & Use Cases
Cost Drivers
Market Structure
Supply Chain Map
Trade & Policy
Operating Norms
Deliverables
Buyer Intelligence
Account Basics
Spend & Scope
Procurement Model
Vendor Requirements
Terms & Policies
Entry Strategy
Pain Points & Triggers
Outputs
Pricing Analysis
Benchmarks
Trends
Should-Cost
Indexation
Landed Cost
Commercial Terms
Deliverables
Brand Analysis
Positioning & Value Prop
Share & Presence
Customer Evidence
Go-to-Market
Digital & Reputation
Compliance & Trust
KPIs & Gaps
Outputs
Full Research Suite comprises of:
Market outlook & trends analysis
Interviews & case studies
Strategic recommendations
Vendor profiles & capabilities analysis
5-year forecasts
8 regions and 60+ country-level data splits
Market segment data splits
12 months of continuous data updates
DELIVERED AS:
PDF EXCEL ONLINE
Skin Health Supplement Market Size, Share and Growth Forecast Outlook 2025 to 2035
Tissue Paper Converting Machine Market Size and Share Forecast Outlook 2025 to 2035
Skin Lightening Product Market Size and Share Forecast Outlook 2025 to 2035
Skincare Supplement Market Size and Share Forecast Outlook 2025 to 2035
Skin Tightening Device Market Size and Share Forecast Outlook 2025 to 2035
Skincare Oil Market Size and Share Forecast Outlook 2025 to 2035
Tissue Extraction System Market Size and Share Forecast Outlook 2025 to 2035
Skin-Barrier Strengthening Phospholipids Market Size and Share Forecast Outlook 2025 to 2035
Skin Toner Market Size and Share Forecast Outlook 2025 to 2035
Skin Cancer Detection Devices Market Size and Share Forecast Outlook 2025 to 2035
Tissue-Based Genomic Profiling Market Size and Share Forecast Outlook 2025 to 2035
Tissue Diagnostics Market Size and Share Forecast Outlook 2025 to 2035
Skincare Nutritional Serum Market Size and Share Forecast Outlook 2025 to 2035
Tissue Paper Unwinding Machine Market Size and Share Forecast Outlook 2025 to 2035
Skincare Products Market Size and Share Forecast Outlook 2025 to 2035
Tissue Paper Embosser Machine Market Size and Share Forecast Outlook 2025 to 2035
Skin Sensors Market Size, Growth, and Forecast for 2025 to 2035
Skin Grafting System Market Size and Share Forecast Outlook 2025 to 2035
Skincare Market Analysis - Size, Share, and Forecast Outlook 2025 to 2035
Tissue and Hygiene Market Size and Share Forecast Outlook 2025 to 2035

Thank you!
You will receive an email from our Business Development Manager. Please be sure to check your SPAM/JUNK folder too.
Chat With
MaRIA