Gelatin Substitutes Market Size and Share Forecast Outlook 2025 to 2035

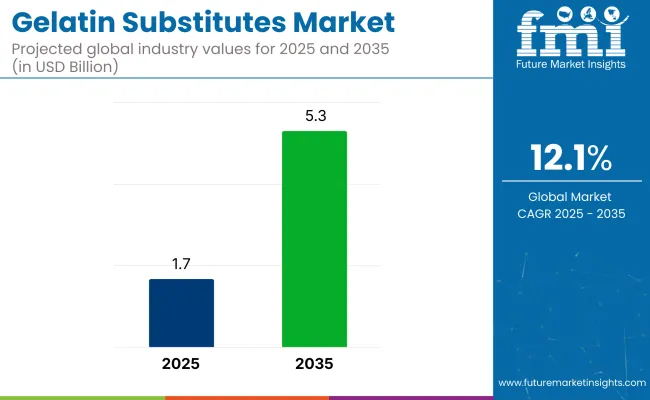
The gelatin substitutes market is projected to reach a valuation of USD 1.7 billion in 2025 and is expected to grow to approximately USD 5.3 billion by 2035, reflecting a CAGR of 12.1% over the forecast period.
Quick Stats of Gelatin Substitutes Market

  • Market Value (2025): USD 1.7 billion
  • Forecast Value (2035): USD 5.3 billion
  • Forecast CAGR (2025 to 2035): 12.1%
  • Leading Segment in 2025: Unflavored (82.4% share)
  • Key Growth Region: Asia Pacific (India is the fastest growing market with 14.6% CAGR)
  • Key Players: NOW Foods, Gelita, The Agar Company (B&V SRL), Java Biocolloid (Hakiki Group), Special Ingredients Ltd., Great American Spice Company, Niblack Foods, Inc., Kelco Co., Inc., Ingredion Incorporated, Tate and Lyle Plc, and Marine Hydrocolloids.

Gelatin Substitutes Market

Growth is being driven by demand shifts away from animal-derived gelatin in pharmaceuticals, food production, and cosmetics. Regulatory trends, dietary shifts, and ingredient have contributed to the expanding footprint of plant-based alternatives such as agar-agar, pectin, carrageenan, and konjac. Major food and nutraceutical companies are responding to a new baseline of expectations around transparency, vegan compliance, and allergen-free product development, further advancing market uptake.

The industry is estimated to account for nearly 12.4% of the functional food ingredients market due to its integration in dietary supplements and clean-label reformulations. Within the food hydrocolloids market, it contributes around 9.6%, supported by demand for thermal-stable gelling agents. In the plant-based ingredients space, its share stands at approximately 7.1%, as consumers seek animal-free options.

It comprises nearly 5.3% of the pharmaceutical excipients market, driven by its use in non-gelatin capsules. In the nutraceutical ingredients market, its contribution is close to 10.8%, with growth fueled by its role in vegan soft gels and skin-health formulations. These shares reflect both technical applicability and cross-sector adoption in health-forward product development and encapsulation processes.

A key factor accelerating this transition is the growing alignment of functional food needs with wellness-driven product positioning. The rising demand for functional foods that contribute to gut health, joint health, and skin care has aligned well with plant-derived products that offer structural and physiological benefits without animal-origin concerns. Supply-side investments in microbial fermentation and precision extraction have increased the quality and versatility of these ingredients, enabling them to meet technical benchmarks in applications where traditional gelatin was previously irreplaceable.

Consumer-facing companies are leveraging these substitutes to support clean-label claims and non-GMO verification, strengthening product appeal in developed and emerging economies alike. These developments have unlocked cycles across dietary supplements, dairy-free confections, and encapsulated skincare actives.

Analysis of Gelatin Substitutes Market by Top Investment Segments

Agar-agar leads product adoption and is mainly distributed as unflavored powders packed in resealable pouches. The food industry drives use, with bulk orders flowing through B2B and HoReCa channels as plant-based gels replace animal-derived gelatin across culinary and industrial applications.

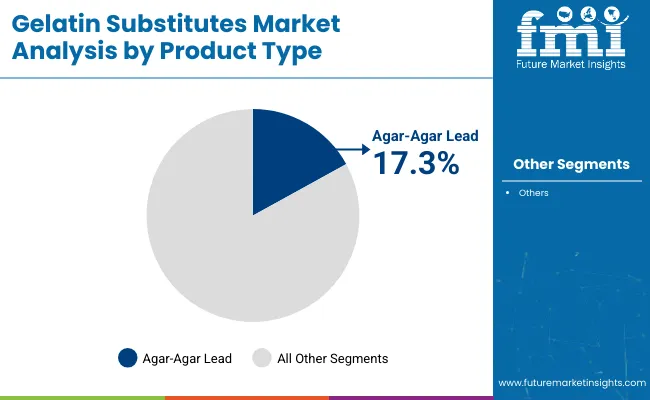
Agar-Agar Lead Product Demand with 17.3% Share

Agar-agar is projected to lead the gelatin substitutes market by product type in 2025, accounting for an estimated 17.3% of total revenue share in 2025. Its dominance is supported by superior gelling strength, clean flavor profile, and thermal stability, which make it highly adaptable across multiple food applications such as desserts, confectionery, and dairy-free formulations.
  • Unlike animal-derived gelatin, agar-agar forms firmer gels that remain stable at higher temperatures, improving texture consistency in both shelf-stable and chilled products.
  • Natural origin from red algae appeals to vegetarian and vegan consumers, aligning with the increasing demand for plant-based alternatives.
  • The ingredient’s ability to produce clear, odorless gels also enhances its utility in culinary and industrial settings, contributing to its widespread use in foodservice, retail, and pharmaceutical applications.

Gelatin Substitutes Market Analysis By Product Type

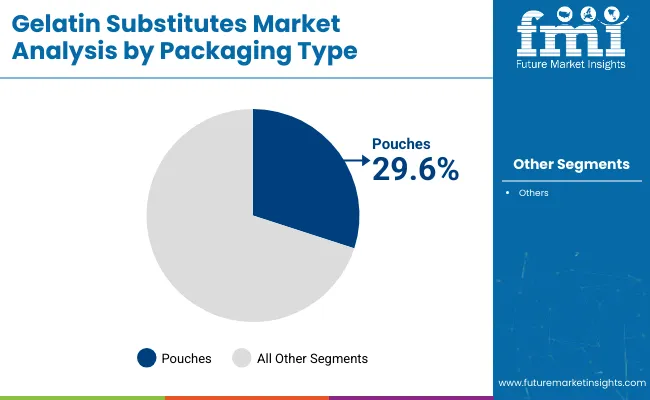
Pouches Dominate Packaging Type Segment with 29.6% Share

Pouches are expected to lead the gelatin substitutes market by packaging type in 2025, capturing an estimated 29.6% share of total sales. Their dominance stems from growing demand in both retail and foodservice channels for resealable, lightweight, and cost-efficient formats.
  • Pouches offer superior shelf appeal, extended product stability, and minimal storage space requirements, advantages that align with e-commerce distribution and bulk purchase trends.
  • For powdered gelatin substitutes, moisture resistance and resealability are crucial, and pouches meet these criteria while reducing packaging waste.
  • Manufacturers favor this format due to lower material usage, ease of printing, and flexible sizing options, which support both single-use and refill markets.

Gelatin Substitutes Market Analysis By Packaging Type

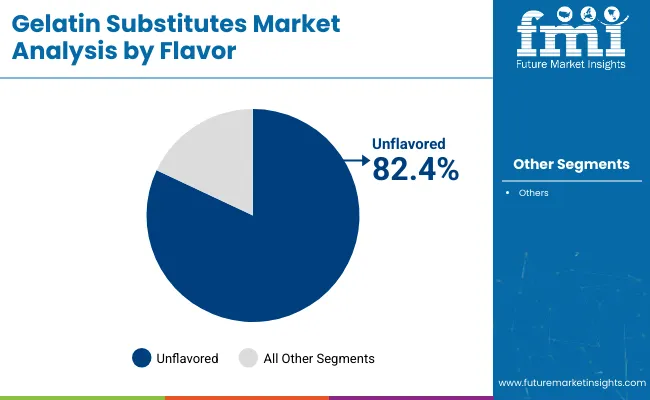
Unflavored Flavor Drive Industry Demand with 82.4% Share

Unflavored gelatin substitutes are projected to dominate the market by flavor in 2025, accounting for approximately 82.4% of total segment revenue. Their leading share is attributed to broad applicability across both savory and sweet product categories without altering the original taste profile.
  • Food and beverage manufacturers prefer unflavoured variants for maximum formulation flexibility, especially in desserts, sauces, beverages, and dairy alternatives. These substitutes offer structural benefits like thickening, gelling, and stabilizing without interfering with sensory attributes, allowing brands to retain authentic or localized flavors.
  • In pharmaceutical and nutraceutical applications, unflavoured formats ensure ingredient compatibility in capsules, syrups, and chewables.
  • Clean-label positioning also resonates with consumers seeking additive-free formulations, supporting consistent adoption in health-conscious product development.

Gelatin Substitutes Market Analysis By Flavor

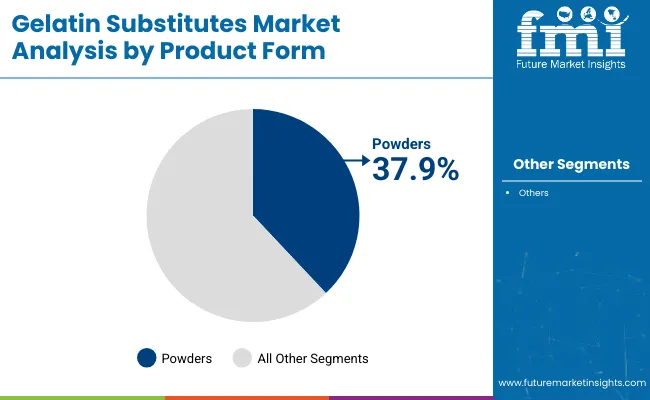
Growing Product Demand for Powders with 37.9% Share

Powders are projected to lead the gelatin substitutes market by product form in 2025, holding an estimated 37.9% share of total revenue. Their dominance stems from formulation flexibility, longer shelf life, and ease of incorporation across multiple applications in food, pharmaceuticals, and nutraceuticals.
  • Powdered formats allow precise dosing, rapid solubility, and compatibility with automated mixing systems, making them ideal for commercial-scale production.
  • In consumer markets, they are favored for home baking, DIY supplement blends, and beverage fortification. Bulk purchasing is also simplified due to their compact storage and low perishability.
  • Manufacturers prefer powder for its cost-effectiveness in transport and packaging, especially in pouches and jars.

Gelatin Substitutes Market Analysis By Product Form

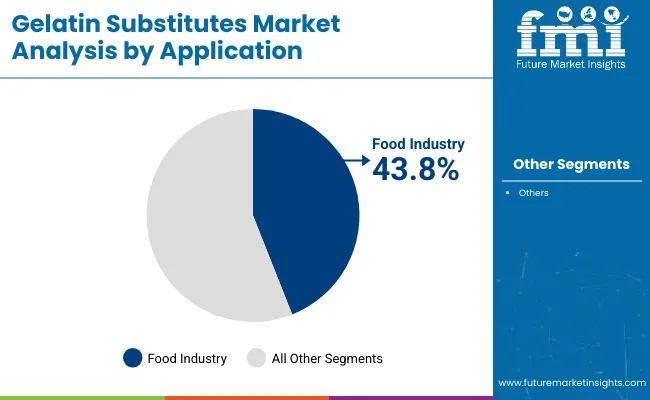
Rising Product Demand in Food Industry with 43.8% Share

The food industry is expected to command about 43.8% of gelatin substitutes revenue in 2025, giving it the largest share among all application categories.
  • Clean-label product strategies have pushed formulators to replace animal gelatin in desserts and snacks, and heat-stable options such as agar-agar or pectin have enabled consistent texture through cold-chain breaks and microwave reheating.
  • Retail traction has been reinforced by e-commerce pack formats, whereas industrial kitchens benefit from bulk powdered grades that integrate seamlessly with continuous mixers.
  • Collectively, these technical, regulatory, and distribution advantages have ensured that food processors continue to prioritize products over traditional animal gelatin, preserving the category’s commanding position across global packaged-foods lines.

Gelatin Substitutes Market Analysis By Application

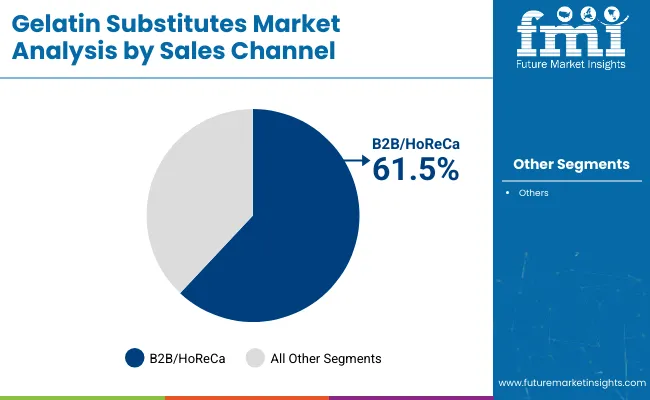
By Sales Channel, B2B / HoReCa Segment Accounts for Over 61.5% Share

The B2B/HoReCa channel is projected to account for 61.5% of total gelatin substitutes sales in 2025, making it the dominant sales channel. This lead is attributed to strong demand from food manufacturers, nutraceutical producers, and pharmaceutical companies requiring consistent volumes of functional gelling agents for large-scale production.
  • Powder and gel forms are being integrated into bakery fillings, dairy analogs, softgel capsules, and dietary supplements.
  • Distributors and ingredient suppliers cater directly to formulators, ensuring customized specifications, bulk availability, and regulatory compliance.
  • The reliability of centralized procurement and technical support further reinforces B2B’s continued dominance over retail-driven B2C formats.

Gelatin Substitutes Market Analysis By Sales Channel

Top Gelatin Substitutes Market Dynamics

Production scalability for plant-based gelling agents has advanced through fermentation technologies and seaweed sourcing, enabling cost-effective, high-performance alternatives. Regulatory harmonization and label mandates have accelerated reformulations, with vegan certifications and functional claims driving consumer trust and adoption.

Plant-Derived Capacity Surges

Industrial output for plant-origin gelling agents has been scaled swiftly as precision-fermentation and algal extraction lines reached commercial throughput in 2024 to 2025. Capital allocation has been prioritized toward modular reactors that lower unit energy, while upstream agreements with seaweed cooperatives allowed raw-material certainty.

Powder flow and hydration performance have been standardized through micronization protocols, permitting interchangeability with legacy animal gelatin in confectionery and encapsulation applications. Cost parity is being approached because co-product valorization offsets processing expense. Cold-chain vulnerabilities have been mitigated by heat-stable gels, enabling broader geographic penetration.

  • Precision-fermentation reactors commissioned in Southeast Asia
  • Long-term seaweed contracts finalized by ingredient suppliers
  • Micronized grades adopted for confectionery retrofits

Regulatory Alignment and Preference Shifts

Global labeling standards are being harmonized, pushing gelatin alternatives toward universal vegan, halal, and kosher certifications. Food-safety authorities have updated positive lists to include refined agar and pectin grades, reducing dossier submission times for new ingredient launches.

Retailers have mandated front-of-pack disclosures that flag animal content; reformulation programs have accelerated as brand-owner risk teams seek allergen reduction and ethical compliance. Clinical evidence linking soluble fiber from pectin to gut-microbiome benefits has been referenced in structure-function claims, whereas carrageenan viscosity has been employed to lower sugar in beverages without texture loss.
  • Multi-jurisdiction vegan seals secured by confectionery brands
  • Fiber-based health claims validated under FDA CFR §101.93
  • QR-code batch tracking integrated by leading distributors

Analysis of Top Countries Producing and Supplying Gelatin Substitutes Globally

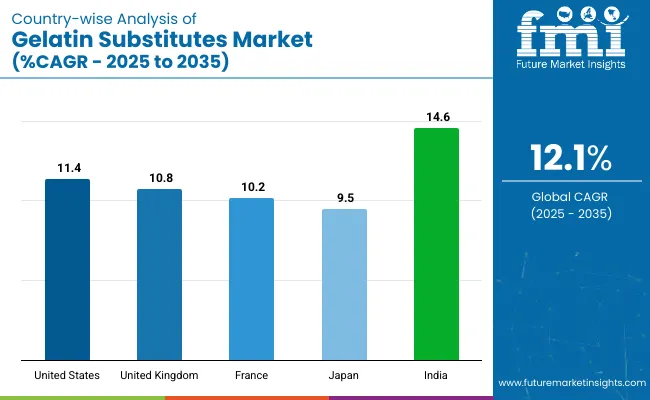
Country Wise Analysis Of Gelatin Substitutes Market

Countries CAGR (2025 to 2035)
United States 11.4%
United Kingdom 10.8%
France 10.2%
Japan 9.5%
India 14.6%

India, part of the BRICS group, is projected to grow the fastest in the gelatin substitutes market with a 14.6% CAGR, driven by vegetarian dietary norms, increasing agar-agar use in sweets and capsules, and state-supported seaweed farming. The United States, an OECD member, follows with 11.4% CAGR, where growth is fueled by vegan soft gels, precision-fermentation advances, and wide retail and e-commerce distribution.

The United Kingdom, also in the OECD, is expanding at 10.8%, shaped by allergen-labeling regulations that have led to the adoption of carrageenan and pectin in desserts and beverages. France, at 10.2%, leverages its pâtisserie tradition with rising use of agar and pectin in clean-label gourmet applications, supported by Brittany’s seaweed supply. Japan records the slowest growth at 9.5%, with demand linked to elderly-focused texture-modified foods and kanten-based sweets rooted in traditional culinary use, reflecting a stable but slower trend within the OECD grouping.

The report covers a detailed analysis of 40+ countries and the top five countries have been shared as a reference.

United States Gelatin Substitutes Industry Expansion

The USA gelatin substitutes market is estimated to grow at 11.4% CAGR during the forecast period. Demand acceleration is being observed as plant-based confectionery and gummy supplement lines continue to replace animal gelatin for allergen-reduction and vegan-label compliance. Food formulators have adopted precision-fermented agar and carrageenan blends that maintain clarity in dairy-free desserts, while beverage processors employ pectin to stabilize low-sugar juice drinks.

HoReCa distributors have shifted to pouches and bulk powders that hydrate rapidly in industrial mixers, reducing preparation time in large commissaries. Retail adoption is supported by clean-label claims, and omnichannel grocery platforms have expanded shelf presence for unflavoured gelatin alternatives. Co-product valorization from algal extraction has narrowed cost gaps, encouraging nationwide rollouts by private-label snack brands.

  • Precision-fermented grades approved under GRAS notice
  • E-commerce share exceeded 18% in 2024 grocery sales
  • Chain restaurants adopted agar glaze in frozen pies

United Kingdom Gelatin Substitutes Market Expansion

The United Kingdom’s gelatin substitutes sector is forecast to advance at 10.8% CAGR through 2035. Growth is underpinned by plant-forward reformulations initiated after the 2024 allergen-labelling update that required clearer disclosure of bovine components. Supermarket own-brand desserts now rely on agar-agar and xanthan gum to achieve heat-stable textures compatible with chilled-chain lapses between distribution hubs and convenience stores.

Craft brewing has integrated carrageenan finings to meet vegan standards sought by taproom patrons, while functional beverage firms deploy pectin to create pulp-suspension in reduced-sugar smoothies. Contract manufacturers in the Midlands have expanded micronization capacity to produce high-flow powders for nutraceutical capsules targeting joint-health and collagen-boost claims.

  • Retailers insist on front-of-pack “animal-free gel” badge
  • Midlands plants added 7,000 t annual micronized output
  • Vegan craft beers adopted carrageenan clarity agents

France Gelatin Substitutes Industry Growth

France’s gelatin substitutes landscape is projected to register a 10.2% CAGR from 2025 to 2035. Domestic pâtisserie brands have moved toward pectin-rich fruit jellies and agar mousses to comply with consumer preference for plant-origin ingredients in premium pastries. Nutritional supplement firms clustered around Lyon have shifted capsule shells to pullulan-agar composites, leveraging local seaweed supplies from Brittany. Texture-focused culinary schools promote agar textbook formulations, accelerating chef-led in fine-dining chains.

The dairy-alternative boom in Provence, centered on almond-based yogurts, uses carrageenan to achieve spoonable viscosity without animal inputs. Institutional catering contracts stipulate halal compliance, steering public-sector kitchens toward gelatin substitutes for gelatinous terrines and aspic dishes.

  • Brittany seaweed cooperatives secured 12-year supply pacts
  • Public food tenders mandate halal-compatible gelling agents
  • QR-coded origin labels rolled out in gourmet confectionery

India Gelatin Substitutes Market Insights

India’s gelatin substitutes arena is anticipated to expand at 14.6% CAGR over the assessment horizon. Vegetarian dietary norms and widespread religious restrictions on bovine and porcine derivatives underpin robust uptake of agar-agar and guar gum in confectionery, dairy sweets, and pharmaceutical capsules. Government-backed seaweed farming clusters in Tamil Nadu supply local processors with raw Gracilaria, lowering material costs for agar producers.

Ayurvedic nutraceutical brands rely on plant-based soft gels to meet clean-label aspirations among urban millennials. Quick-service restaurants employ xanthan-stabilized sauces that maintain viscosity despite high ambient temperatures, ensuring consistent mouthfeel in takeaway meals. E-pharmacy portals have expanded distribution of vegan capsules for immunity and joint-care remedies.

  • Tamil Nadu’s seaweed parks received low-interest capital subsidies
  • Vegan nutraceutical capsules gained 28% online share in 2024
  • QSR chains standardized xanthan sauces for temperature resilience

Analysis of Gelatin Substitutes Market in Japan

Japan’s gelatin substitutes segment is expected to progress at 9.5% CAGR through 2035. Confectionery firms have adopted high-purity agar to sustain the traditional wagashi sector while meeting the rising tourism demand for vegan sweets. Precision-cut kanten sticks produced in Nagano reduce hydration time in ready-mix dessert kits.

Beverage conglomerates have incorporated carrageenan in zero-added-sugar coffee beverages to maintain stable foam during shelf life. Pharmaceutical excipient suppliers near Osaka cast pullulan-agar capsule shells that accommodate temperature-sensitive probiotics. Demographic aging has increased consumption of texture-modified foods, with pectin and guar gum enabling easy-to-swallow gels in hospitals and nursing facilities.

  • Nagano factories introduced rapid-hydrate kanten sticks
  • Functional-claim approvals granted to pectin under FOSHU rules
  • Hospital diets utilized guar-thickened purées for dysphagia

Leading Gelatin Substitutes Suppliers

The gelatin substitutes industry is shaped by established ingredient providers and emerging formulators addressing the demand for plant-based gelling agents in food, nutraceutical, and pharmaceutical applications. Key players such as NOW Foods and Gelita anchor the market with diversified product lines serving retail and B2B channels. The Agar Company (B&V SRL) and Java Biocolloid (Hakiki Group) focus on high-purity agar sourced from red algae, supplying dessert and dairy-alternative manufacturers.

Special Ingredients Ltd. and Great American Spice Company cater to culinary professionals with customizable blends for bakery and confectionery. Niblack Foods, Inc. and Kelco Co., Inc. offer wholesale solutions aligned with clean-label and vegan trends. Ingredion Incorporated and Tate and Lyle Plc drive through texture-modifying systems and scalable hydrocolloid platforms. In Asia, Marine Hydrocolloids plays a leading role in agar-strip exports, supported by seaweed cultivation along India’s southern coast.

Leading Players

  • NOW Foods
  • Gelita
  • The Agar Company (B&V SRL)
  • Java Biocolloid (Hakiki Group)
  • Special Ingredients Ltd.
  • Great American Spice Company
  • Niblack Foods, Inc.
  • Kelco Co., Inc.
  • Ingredion Incorporated
  • Tate and Lyle Plc
  • Marine Hydrocolloids

Report Coverage and Scope Summary

Report Attributes Details
Market Size (2025) USD 1.7 billion
Projected Market Size (2035) USD 5.3 billion
CAGR (2025 to 2035) 12.1%
Base Year for Estimation 2024
Historical Period 2020 to 2024
Projections Period 2025 to 2035
Quantitative Units USD billion for value and million units for volume
Product Type Analyzed (Segment 1) Agar-Agar, Carrageen, Pectin, Cornstarch, Xanthan Gum, Guar Gum, Arrowroot, Instant Clear Gel, Kudzu, and Others.
Packaging Type Analyzed (Segment 2) Bag, Bottle, Box, Pouch, and Others.
Flavor Analyzed (Segment 3) Unflavored And Flavored (Apple, Berry, Coffee, Grape, Raspberry, Strawberry, Vanilla, and Watermelon).
Applications Analyzed (Segment 4) Food Industry (Baking Products, Chocolate And Confectionery, Dairy & Desserts, and Others), Pharmaceutical Industry, Cosmetics and Personal Care Industry, Dietary Supplements, Microbiology And Plant Propagation, and Others.
Product form Analyzed (Segment 5) Capsules, Gummies, Powders, Soft Gels, And Others.
Sales Channel Analyzed (Segment 6) B2B / HoReCa and B2C (Hypermarkets/Supermarkets, Convenience Stores, Mom and Pop Stores, Discount Stores, Food Specialty Stores, Independent Small Groceries, Online Retail, And Other Retail Formats).
Regions Covered North America, Europe, Asia Pacific, Middle East & Africa, Latin America
Countries Covered United States, Canada, Germany, United Kingdom, France, Italy, Spain, China, Japan, South Korea, India, Australia, Brazil, Mexico, Argentina, Saudi Arabia, UAE, South Africa
Key Players NOW Foods, Gelita, The Agar Company (B&V SRL), Java Biocolloid (Hakiki Group), Special Ingredients Ltd., Great American Spice Company, Niblack Foods, Inc., Kelco Co., Inc., Ingredion Incorporated, Tate and Lyle Plc, and Marine Hydrocolloids.
Additional Attributes Dollar sales, growth rate, regional demand, segment share, sourcing trends, pricing benchmarks, B2B vs B2C split, regulatory updates, product form demand, packaging preference, top buyers, competitor share, retail vs bulk share.

Key Gelatin Substitutes Market Segmentation

By Product Type:

The industry is segmented into agar-agar, carrageen, pectin, cornstarch, xanthan gum, guar gum, arrowroot, instant clear gel, kudzu, and others.

By Packaging Type:

The industry is segmented into bag, bottle, box, pouch, and others.

By Flavor:

The industry finds unflavored and flavored (apple, berry, coffee, grape, raspberry, strawberry, vanilla, and watermelon).

By Product Form:

The industry is divided into capsules, gummies, powders, soft gels, and others.

By Application :

The industry finds applications in food industry (baking products, chocolate and confectionery, dairy & desserts, and others), pharmaceutical industry, cosmetics and personal care industry, dietary supplements, microbiology and plant propagation, and others.

By Sales Channel:

The industry is segmented into B2B / HoReCa and B2C (hypermarkets/supermarkets, convenience stores, mom and pop stores, discount stores, food specialty stores, independent small groceries, online retail, and other retail formats).

By Region:

The industry covers regions including North America, Europe, Asia Pacific, Latin America, and the Middle East & Africa.

Table of Content

  1. Executive Summary
    • Global Market Outlook
    • Demand-side Trends
    • Supply-side Trends
    • Technology Roadmap Analysis
    • Analysis and Recommendations
  2. Market Overview
    • Market Coverage / Taxonomy
    • Market Definition / Scope / Limitations
  3. Market Background
    • Market Dynamics
      • Drivers
      • Restraints
      • Opportunity
      • Trends
    • Scenario Forecast
      • Demand in Optimistic Scenario
      • Demand in Likely Scenario
      • Demand in Conservative Scenario
    • Opportunity Map Analysis
    • Product Life Cycle Analysis
    • Supply Chain Analysis
      • Supply Side Participants and their Roles
        • Producers
        • Mid-Level Participants (Traders/ Agents/ Brokers)
        • Wholesalers and Distributors
      • Value Added and Value Created at Node in the Supply Chain
      • List of Raw Material Suppliers
      • List of Existing and Potential Buyer’s
    • Investment Feasibility Matrix
    • Value Chain Analysis
      • Profit Margin Analysis
      • Wholesalers and Distributors
      • Retailers
    • PESTLE and Porter’s Analysis
    • Regulatory Landscape
      • By Key Regions
      • By Key Countries
    • Regional Parent Market Outlook
    • Production and Consumption Statistics
    • Import and Export Statistics
  4. Global Market Analysis 2020 to 2024 and Forecast, 2025 to 2035
    • Historical Market Size Value (USD Billion) Analysis, 2020 to 2024
    • Current and Future Market Size Value (USD Billion) Projections, 2025 to 2035
      • Y-o-Y Growth Trend Analysis
      • Absolute $ Opportunity Analysis
  5. Global Market Pricing Analysis 2020 to 2024 and Forecast 2025 to 2035
  6. Global Market Analysis 2020 to 2024 and Forecast 2025 to 2035, By Product Type
    • Introduction / Key Findings
    • Historical Market Size Value (USD Billion) Analysis By Product Type, 2020 to 2024
    • Current and Future Market Size Value (USD Billion) Analysis and Forecast By Product Type, 2025 to 2035
      • Agar-Agar
      • Carrageen
      • Pectin
      • Cornstarch
      • Xanthan Gum
      • Guar Gum
      • Arrowroot
      • Instant Clear Gel
      • Kudzu
      • Others
    • Y-o-Y Growth Trend Analysis By Product Type, 2020 to 2024
    • Absolute $ Opportunity Analysis By Product Type, 2025 to 2035
  7. Global Market Analysis 2020 to 2024 and Forecast 2025 to 2035, By Packaging Type
    • Introduction / Key Findings
    • Historical Market Size Value (USD Billion) Analysis By Packaging Type, 2020 to 2024
    • Current and Future Market Size Value (USD Billion) Analysis and Forecast By Packaging Type, 2025 to 2035
      • Bag
      • Bottle
      • Box
      • Pouch
      • Others
    • Y-o-Y Growth Trend Analysis By Packaging Type, 2020 to 2024
    • Absolute $ Opportunity Analysis By Packaging Type, 2025 to 2035
  8. Global Market Analysis 2020 to 2024 and Forecast 2025 to 2035, By Flavor
    • Introduction / Key Findings
    • Historical Market Size Value (USD Billion) Analysis By Flavor, 2020 to 2024
    • Current and Future Market Size Value (USD Billion) Analysis and Forecast By Flavor, 2025 to 2035
      • Unflavoured
      • Flavoured
        • Apple
        • Berry
        • Coffee
        • Grape
        • Raspberry
        • Strawberry
        • Vanilla
        • Watermelon
    • Y-o-Y Growth Trend Analysis By Flavor, 2020 to 2024
    • Absolute $ Opportunity Analysis By Flavor, 2025 to 2035
  9. Global Market Analysis 2020 to 2024 and Forecast 2025 to 2035, By Product Form
    • Introduction / Key Findings
    • Historical Market Size Value (USD Billion) Analysis By Product Form, 2020 to 2024
    • Current and Future Market Size Value (USD Billion) Analysis and Forecast By Product Form, 2025 to 2035
      • Capsules
      • Gummies
      • Powders
      • Soft gels
      • Others
    • Y-o-Y Growth Trend Analysis By Product Form, 2020 to 2024
    • Absolute $ Opportunity Analysis By Product Form, 2025 to 2035
  10. Global Market Analysis 2020 to 2024 and Forecast 2025 to 2035, By Application
    • Introduction / Key Findings
    • Historical Market Size Value (USD Billion) Analysis By Application, 2020 to 2024
    • Current and Future Market Size Value (USD Billion) Analysis and Forecast By Application, 2025 to 2035
      • Food Industry
        • Baking Products
        • Chocolate and Confectionery
        • Dairy & Desserts
        • Others
      • Pharmaceutical Industry
      • Cosmetics and Personal Care Industry
      • Dietary Supplements
      • Microbiology and Plant Propagation
      • Others
    • Y-o-Y Growth Trend Analysis By Application, 2020 to 2024
    • Absolute $ Opportunity Analysis By Application, 2025 to 2035
  11. Global Market Analysis 2020 to 2024 and Forecast 2025 to 2035, By Sales Channel
    • Introduction / Key Findings
    • Historical Market Size Value (USD Billion) Analysis By Sales Channel, 2020 to 2024
    • Current and Future Market Size Value (USD Billion) Analysis and Forecast By Sales Channel, 2025 to 2035
      • B2B / HoReCa
      • B2C
        • Hypermarkets / Supermarkets
        • Convenience Stores
        • Mom and Pop Stores
        • Discount Stores
        • Food Specialty Stores
        • Independent Small Groceries
        • Online Retail
        • Others Retail Formats
    • Y-o-Y Growth Trend Analysis By Sales Channel, 2020 to 2024
    • Absolute $ Opportunity Analysis By Sales Channel, 2025 to 2035
  12. Global Market Analysis 2020 to 2024 and Forecast 2025 to 2035, By Region
    • Introduction
    • Historical Market Size Value (USD Billion) Analysis By Region, 2020 to 2024
    • Current Market Size Value (USD Billion) Analysis and Forecast By Region, 2025 to 2035
      • North America
      • Latin America
      • Western Europe
      • Eastern Europe
      • East Asia
      • South Asia & Pacific
      • Middle East and Africa
    • Market Attractiveness Analysis By Region
  13. North America Market Analysis 2020 to 2024 and Forecast 2025 to 2035, By Country
    • Historical Market Size Value (USD Billion) Trend Analysis By Market Taxonomy, 2020 to 2024
    • Market Size Value (USD Billion) Forecast By Market Taxonomy, 2025 to 2035
      • By Country
        • USA
        • Canada
        • Mexico
      • By Product Type
      • By Packaging Type
      • By Flavor
      • By Product Form
      • By Application
      • By Sales Channel
    • Market Attractiveness Analysis
      • By Country
      • By Product Type
      • By Packaging Type
      • By Flavor
      • By Product Form
      • By Application
      • By Sales Channel
    • Key Takeaways
  14. Latin America Market Analysis 2020 to 2024 and Forecast 2025 to 2035, By Country
    • Historical Market Size Value (USD Billion) Trend Analysis By Market Taxonomy, 2020 to 2024
    • Market Size Value (USD Billion) Forecast By Market Taxonomy, 2025 to 2035
      • By Country
        • Brazil
        • Argentina
        • Rest of LATAM
      • By Product Type
      • By Packaging Type
      • By Flavor
      • By Product Form
      • By Application
      • By Sales Channel
    • Market Attractiveness Analysis
      • By Country
      • By Product Type
      • By Packaging Type
      • By Flavor
      • By Product Form
      • By Application
      • By Sales Channel
    • Key Takeaways
  15. Western Europe Market Analysis 2020 to 2024 and Forecast 2025 to 2035, By Country
    • Historical Market Size Value (USD Billion) Trend Analysis By Market Taxonomy, 2020 to 2024
    • Market Size Value (USD Billion) Forecast By Market Taxonomy, 2025 to 2035
      • By Country
        • Germany
        • Italy
        • France
        • UK
        • Spain
        • BENELUX
        • Nordic
        • Rest of W.Europe
      • By Product Type
      • By Packaging Type
      • By Flavor
      • By Product Form
      • By Application
      • By Sales Channel
    • Market Attractiveness Analysis
      • By Country
      • By Product Type
      • By Packaging Type
      • By Flavor
      • By Product Form
      • By Application
      • By Sales Channel
    • Key Takeaways
  16. Eastern Europe Market Analysis 2020 to 2024 and Forecast 2025 to 2035, By Country
    • Historical Market Size Value (USD Billion) Trend Analysis By Market Taxonomy, 2020 to 2024
    • Market Size Value (USD Billion) Forecast By Market Taxonomy, 2025 to 2035
      • By Country
        • Russia
        • Hungary
        • Poland
        • Balkan & Baltics
        • Rest of E. Europe
      • By Product Type
      • By Packaging Type
      • By Flavor
      • By Product Form
      • By Application
      • By Sales Channel
    • Market Attractiveness Analysis
      • By Country
      • By Product Type
      • By Packaging Type
      • By Flavor
      • By Product Form
      • By Application
      • By Sales Channel
    • Key Takeaways
  17. East Asia Market Analysis 2020 to 2024 and Forecast 2025 to 2035, By Country
    • Historical Market Size Value (USD Billion) Trend Analysis By Market Taxonomy, 2020 to 2024
    • Market Size Value (USD Billion) Forecast By Market Taxonomy, 2025 to 2035
      • By Country
        • China
        • Japan
        • South Korea
      • By Product Type
      • By Packaging Type
      • By Flavor
      • By Product Form
      • By Application
      • By Sales Channel
    • Market Attractiveness Analysis
      • By Country
      • By Product Type
      • By Packaging Type
      • By Flavor
      • By Product Form
      • By Application
      • By Sales Channel
    • Key Takeaways
  18. South Asia & Pacific Market Analysis 2020 to 2024 and Forecast 2025 to 2035, By Country
    • Historical Market Size Value (USD Billion) Trend Analysis By Market Taxonomy, 2020 to 2024
    • Market Size Value (USD Billion) Forecast By Market Taxonomy, 2025 to 2035
      • By Country
        • India
        • Australia & New Zealand
        • ASEAN
        • Rest of SAP
      • By Product Type
      • By Packaging Type
      • By Flavor
      • By Product Form
      • By Application
      • By Sales Channel
    • Market Attractiveness Analysis
      • By Country
      • By Product Type
      • By Packaging Type
      • By Flavor
      • By Product Form
      • By Application
      • By Sales Channel
    • Key Takeaways
  19. Middle East and Africa Market Analysis 2020 to 2024 and Forecast 2025 to 2035, By Country
    • Historical Market Size Value (USD Billion) Trend Analysis By Market Taxonomy, 2020 to 2024
    • Market Size Value (USD Billion) Forecast By Market Taxonomy, 2025 to 2035
      • By Country
        • GCC Countries
        • Northern Africa
        • South Africa
        • Turkiye
        • Rest of MEA
      • By Product Type
      • By Packaging Type
      • By Flavor
      • By Product Form
      • By Application
      • By Sales Channel
    • Market Attractiveness Analysis
      • By Country
      • By Product Type
      • By Packaging Type
      • By Flavor
      • By Product Form
      • By Application
      • By Sales Channel
    • Key Takeaways
  20. Key Countries Market Analysis
    • USA
      • Pricing Analysis
      • Market Share Analysis, 2024
        • By Product Type
        • By Packaging Type
        • By Flavor
        • By Product Form
        • By Application
        • By Sales Channel
    • Canada
      • Pricing Analysis
      • Market Share Analysis, 2024
        • By Product Type
        • By Packaging Type
        • By Flavor
        • By Product Form
        • By Application
        • By Sales Channel
    • Brazil
      • Pricing Analysis
      • Market Share Analysis, 2024
        • By Product Type
        • By Packaging Type
        • By Flavor
        • By Product Form
        • By Application
        • By Sales Channel
    • Mexico
      • Pricing Analysis
      • Market Share Analysis, 2024
        • By Product Type
        • By Packaging Type
        • By Flavor
        • By Product Form
        • By Application
        • By Sales Channel
    • Argentina
      • Pricing Analysis
      • Market Share Analysis, 2024
        • By Product Type
        • By Packaging Type
        • By Flavor
        • By Product Form
        • By Application
        • By Sales Channel
  21. Market Structure Analysis
    • Competition Dashboard
    • Competition Benchmarking
    • Market Share Analysis of Top Players
      • By Regional
      • By Product Type
      • By Packaging Type
      • By Flavor
      • By Product Form
      • By Application
      • By Sales Channel
  22. Competition Analysis
    • Competition Deep Dive
      • NOW Foods
        • Overview
        • Product Portfolio
        • Profitability by Market Segments (Product/Age /Sales Channel/Region)
        • Sales Footprint
        • Strategy Overview
          • Marketing Strategy
          • Product Strategy
          • Channel Strategy
      • Gelita
        • Overview
        • Product Portfolio
        • Profitability by Market Segments (Product/Age /Sales Channel/Region)
        • Sales Footprint
        • Strategy Overview
          • Marketing Strategy
          • Product Strategy
          • Channel Strategy
      • The Agar Company (B&V SRL)
        • Overview
        • Product Portfolio
        • Profitability by Market Segments (Product/Age /Sales Channel/Region)
        • Sales Footprint
        • Strategy Overview
          • Marketing Strategy
          • Product Strategy
          • Channel Strategy
      • Java Biocolloid (Hakiki Group)
        • Overview
        • Product Portfolio
        • Profitability by Market Segments (Product/Age /Sales Channel/Region)
        • Sales Footprint
        • Strategy Overview
          • Marketing Strategy
          • Product Strategy
          • Channel Strategy
      • Special Ingredients Ltd.
        • Overview
        • Product Portfolio
        • Profitability by Market Segments (Product/Age /Sales Channel/Region)
        • Sales Footprint
        • Strategy Overview
          • Marketing Strategy
          • Product Strategy
          • Channel Strategy
      • Great American Spice Company
        • Overview
        • Product Portfolio
        • Profitability by Market Segments (Product/Age /Sales Channel/Region)
        • Sales Footprint
        • Strategy Overview
          • Marketing Strategy
          • Product Strategy
          • Channel Strategy
      • Niblack Foods, Inc.
        • Overview
        • Product Portfolio
        • Profitability by Market Segments (Product/Age /Sales Channel/Region)
        • Sales Footprint
        • Strategy Overview
          • Marketing Strategy
          • Product Strategy
          • Channel Strategy
      • Kelco Co., Inc.
        • Overview
        • Product Portfolio
        • Profitability by Market Segments (Product/Age /Sales Channel/Region)
        • Sales Footprint
        • Strategy Overview
          • Marketing Strategy
          • Product Strategy
          • Channel Strategy
      • Ingredion Incorporated
        • Overview
        • Product Portfolio
        • Profitability by Market Segments (Product/Age /Sales Channel/Region)
        • Sales Footprint
        • Strategy Overview
          • Marketing Strategy
          • Product Strategy
          • Channel Strategy
      • Tate and Lyle Plc
        • Overview
        • Product Portfolio
        • Profitability by Market Segments (Product/Age /Sales Channel/Region)
        • Sales Footprint
        • Strategy Overview
          • Marketing Strategy
          • Product Strategy
          • Channel Strategy
      • Marine Hydrocolloids
        • Overview
        • Product Portfolio
        • Profitability by Market Segments (Product/Age /Sales Channel/Region)
        • Sales Footprint
        • Strategy Overview
          • Marketing Strategy
          • Product Strategy
          • Channel Strategy
  23. Assumptions & Acronyms Used
  24. Research Methodology

List of Tables

  • Table 1: Global Market Value (USD Billion) Forecast by Region, 2020 to 2035
  • Table 2: Global Market Value (USD Billion) Forecast by Product Type, 2020 to 2035
  • Table 3: Global Market Value (USD Billion) Forecast by Packaging Type, 2020 to 2035
  • Table 4: Global Market Value (USD Billion) Forecast by Flavor, 2020 to 2035
  • Table 5: Global Market Value (USD Billion) Forecast by Product Form, 2020 to 2035
  • Table 6: Global Market Value (USD Billion) Forecast by Application, 2020 to 2035
  • Table 7: Global Market Value (USD Billion) Forecast by Sales Channel, 2020 to 2035
  • Table 8: North America Market Value (USD Billion) Forecast by Country, 2020 to 2035
  • Table 9: North America Market Value (USD Billion) Forecast by Product Type, 2020 to 2035
  • Table 10: North America Market Value (USD Billion) Forecast by Packaging Type, 2020 to 2035
  • Table 11: North America Market Value (USD Billion) Forecast by Flavor, 2020 to 2035
  • Table 12: North America Market Value (USD Billion) Forecast by Product Form, 2020 to 2035
  • Table 13: North America Market Value (USD Billion) Forecast by Application, 2020 to 2035
  • Table 14: North America Market Value (USD Billion) Forecast by Sales Channel, 2020 to 2035
  • Table 15: Latin America Market Value (USD Billion) Forecast by Country, 2020 to 2035
  • Table 16: Latin America Market Value (USD Billion) Forecast by Product Type, 2020 to 2035
  • Table 17: Latin America Market Value (USD Billion) Forecast by Packaging Type, 2020 to 2035
  • Table 18: Latin America Market Value (USD Billion) Forecast by Flavor, 2020 to 2035
  • Table 19: Latin America Market Value (USD Billion) Forecast by Product Form, 2020 to 2035
  • Table 20: Latin America Market Value (USD Billion) Forecast by Application, 2020 to 2035
  • Table 21: Latin America Market Value (USD Billion) Forecast by Sales Channel, 2020 to 2035
  • Table 22: Western Europe Market Value (USD Billion) Forecast by Country, 2020 to 2035
  • Table 23: Western Europe Market Value (USD Billion) Forecast by Product Type, 2020 to 2035
  • Table 24: Western Europe Market Value (USD Billion) Forecast by Packaging Type, 2020 to 2035
  • Table 25: Western Europe Market Value (USD Billion) Forecast by Flavor, 2020 to 2035
  • Table 26: Western Europe Market Value (USD Billion) Forecast by Product Form, 2020 to 2035
  • Table 27: Western Europe Market Value (USD Billion) Forecast by Application, 2020 to 2035
  • Table 28: Western Europe Market Value (USD Billion) Forecast by Sales Channel, 2020 to 2035
  • Table 29: Eastern Europe Market Value (USD Billion) Forecast by Country, 2020 to 2035
  • Table 30: Eastern Europe Market Value (USD Billion) Forecast by Product Type, 2020 to 2035
  • Table 31: Eastern Europe Market Value (USD Billion) Forecast by Packaging Type, 2020 to 2035
  • Table 32: Eastern Europe Market Value (USD Billion) Forecast by Flavor, 2020 to 2035
  • Table 33: Eastern Europe Market Value (USD Billion) Forecast by Product Form, 2020 to 2035
  • Table 34: Eastern Europe Market Value (USD Billion) Forecast by Application, 2020 to 2035
  • Table 35: Eastern Europe Market Value (USD Billion) Forecast by Sales Channel, 2020 to 2035
  • Table 36: East Asia Market Value (USD Billion) Forecast by Country, 2020 to 2035
  • Table 37: East Asia Market Value (USD Billion) Forecast by Product Type, 2020 to 2035
  • Table 38: East Asia Market Value (USD Billion) Forecast by Packaging Type, 2020 to 2035
  • Table 39: East Asia Market Value (USD Billion) Forecast by Flavor, 2020 to 2035
  • Table 40: East Asia Market Value (USD Billion) Forecast by Product Form, 2020 to 2035
  • Table 41: East Asia Market Value (USD Billion) Forecast by Application, 2020 to 2035
  • Table 42: East Asia Market Value (USD Billion) Forecast by Sales Channel, 2020 to 2035
  • Table 43: South Asia & Pacific Market Value (USD Billion) Forecast by Country, 2020 to 2035
  • Table 44: South Asia & Pacific Market Value (USD Billion) Forecast by Product Type, 2020 to 2035
  • Table 45: South Asia & Pacific Market Value (USD Billion) Forecast by Packaging Type, 2020 to 2035
  • Table 46: South Asia & Pacific Market Value (USD Billion) Forecast by Flavor, 2020 to 2035
  • Table 47: South Asia & Pacific Market Value (USD Billion) Forecast by Product Form, 2020 to 2035
  • Table 48: South Asia & Pacific Market Value (USD Billion) Forecast by Application, 2020 to 2035
  • Table 49: South Asia & Pacific Market Value (USD Billion) Forecast by Sales Channel, 2020 to 2035
  • Table 50: Middle East and Africa Market Value (USD Billion) Forecast by Country, 2020 to 2035
  • Table 51: Middle East and Africa Market Value (USD Billion) Forecast by Product Type, 2020 to 2035
  • Table 52: Middle East and Africa Market Value (USD Billion) Forecast by Packaging Type, 2020 to 2035
  • Table 53: Middle East and Africa Market Value (USD Billion) Forecast by Flavor, 2020 to 2035
  • Table 54: Middle East and Africa Market Value (USD Billion) Forecast by Product Form, 2020 to 2035
  • Table 55: Middle East and Africa Market Value (USD Billion) Forecast by Application, 2020 to 2035
  • Table 56: Middle East and Africa Market Value (USD Billion) Forecast by Sales Channel, 2020 to 2035

List of Figures

  • Figure 1: Global Market Pricing Analysis
  • Figure 2: Global Market Value (USD Billion) Forecast 2020 to 2035
  • Figure 3: Global Market Value Share and BPS Analysis by Product Type, 2025 and 2035
  • Figure 4: Global Market Y-o-Y Growth Comparison by Product Type, 2025 to 2035
  • Figure 5: Global Market Attractiveness Analysis by Product Type
  • Figure 6: Global Market Value Share and BPS Analysis by Packaging Type, 2025 and 2035
  • Figure 7: Global Market Y-o-Y Growth Comparison by Packaging Type, 2025 to 2035
  • Figure 8: Global Market Attractiveness Analysis by Packaging Type
  • Figure 9: Global Market Value Share and BPS Analysis by Flavor, 2025 and 2035
  • Figure 10: Global Market Y-o-Y Growth Comparison by Flavor, 2025 to 2035
  • Figure 11: Global Market Attractiveness Analysis by Flavor
  • Figure 12: Global Market Value Share and BPS Analysis by Product Form, 2025 and 2035
  • Figure 13: Global Market Y-o-Y Growth Comparison by Product Form, 2025 to 2035
  • Figure 14: Global Market Attractiveness Analysis by Product Form
  • Figure 15: Global Market Value Share and BPS Analysis by Application, 2025 and 2035
  • Figure 16: Global Market Y-o-Y Growth Comparison by Application, 2025 to 2035
  • Figure 17: Global Market Attractiveness Analysis by Application
  • Figure 18: Global Market Value Share and BPS Analysis by Sales Channel, 2025 and 2035
  • Figure 19: Global Market Y-o-Y Growth Comparison by Sales Channel, 2025 to 2035
  • Figure 20: Global Market Attractiveness Analysis by Sales Channel
  • Figure 21: Global Market Value (USD Billion) Share and BPS Analysis by Region, 2025 and 2035
  • Figure 22: Global Market Y-o-Y Growth Comparison by Region, 2025 to 2035
  • Figure 23: Global Market Attractiveness Analysis by Region
  • Figure 24: North America Market Incremental $ Opportunity, 2025 to 2035
  • Figure 25: Latin America Market Incremental $ Opportunity, 2025 to 2035
  • Figure 26: Western Europe Market Incremental $ Opportunity, 2025 to 2035
  • Figure 27: Eastern Europe Market Incremental $ Opportunity, 2025 to 2035
  • Figure 28: East Asia Market Incremental $ Opportunity, 2025 to 2035
  • Figure 29: South Asia & Pacific Market Incremental $ Opportunity, 2025 to 2035
  • Figure 30: Middle East and Africa Market Incremental $ Opportunity, 2025 to 2035
  • Figure 31: North America Market Value Share and BPS Analysis by Country, 2025 and 2035
  • Figure 32: North America Market Value Share and BPS Analysis by Product Type, 2025 and 2035
  • Figure 33: North America Market Y-o-Y Growth Comparison by Product Type, 2025 to 2035
  • Figure 34: North America Market Attractiveness Analysis by Product Type
  • Figure 35: North America Market Value Share and BPS Analysis by Packaging Type, 2025 and 2035
  • Figure 36: North America Market Y-o-Y Growth Comparison by Packaging Type, 2025 to 2035
  • Figure 37: North America Market Attractiveness Analysis by Packaging Type
  • Figure 38: North America Market Value Share and BPS Analysis by Flavor, 2025 and 2035
  • Figure 39: North America Market Y-o-Y Growth Comparison by Flavor, 2025 to 2035
  • Figure 40: North America Market Attractiveness Analysis by Flavor
  • Figure 41: North America Market Value Share and BPS Analysis by Product Form, 2025 and 2035
  • Figure 42: North America Market Y-o-Y Growth Comparison by Product Form, 2025 to 2035
  • Figure 43: North America Market Attractiveness Analysis by Product Form
  • Figure 44: North America Market Value Share and BPS Analysis by Application, 2025 and 2035
  • Figure 45: North America Market Y-o-Y Growth Comparison by Application, 2025 to 2035
  • Figure 46: North America Market Attractiveness Analysis by Application
  • Figure 47: North America Market Value Share and BPS Analysis by Sales Channel, 2025 and 2035
  • Figure 48: North America Market Y-o-Y Growth Comparison by Sales Channel, 2025 to 2035
  • Figure 49: North America Market Attractiveness Analysis by Sales Channel
  • Figure 50: Latin America Market Value Share and BPS Analysis by Country, 2025 and 2035
  • Figure 51: Latin America Market Value Share and BPS Analysis by Product Type, 2025 and 2035
  • Figure 52: Latin America Market Y-o-Y Growth Comparison by Product Type, 2025 to 2035
  • Figure 53: Latin America Market Attractiveness Analysis by Product Type
  • Figure 54: Latin America Market Value Share and BPS Analysis by Packaging Type, 2025 and 2035
  • Figure 55: Latin America Market Y-o-Y Growth Comparison by Packaging Type, 2025 to 2035
  • Figure 56: Latin America Market Attractiveness Analysis by Packaging Type
  • Figure 57: Latin America Market Value Share and BPS Analysis by Flavor, 2025 and 2035
  • Figure 58: Latin America Market Y-o-Y Growth Comparison by Flavor, 2025 to 2035
  • Figure 59: Latin America Market Attractiveness Analysis by Flavor
  • Figure 60: Latin America Market Value Share and BPS Analysis by Product Form, 2025 and 2035
  • Figure 61: Latin America Market Y-o-Y Growth Comparison by Product Form, 2025 to 2035
  • Figure 62: Latin America Market Attractiveness Analysis by Product Form
  • Figure 63: Latin America Market Value Share and BPS Analysis by Application, 2025 and 2035
  • Figure 64: Latin America Market Y-o-Y Growth Comparison by Application, 2025 to 2035
  • Figure 65: Latin America Market Attractiveness Analysis by Application
  • Figure 66: Latin America Market Value Share and BPS Analysis by Sales Channel, 2025 and 2035
  • Figure 67: Latin America Market Y-o-Y Growth Comparison by Sales Channel, 2025 to 2035
  • Figure 68: Latin America Market Attractiveness Analysis by Sales Channel
  • Figure 69: Western Europe Market Value Share and BPS Analysis by Country, 2025 and 2035
  • Figure 70: Western Europe Market Value Share and BPS Analysis by Product Type, 2025 and 2035
  • Figure 71: Western Europe Market Y-o-Y Growth Comparison by Product Type, 2025 to 2035
  • Figure 72: Western Europe Market Attractiveness Analysis by Product Type
  • Figure 73: Western Europe Market Value Share and BPS Analysis by Packaging Type, 2025 and 2035
  • Figure 74: Western Europe Market Y-o-Y Growth Comparison by Packaging Type, 2025 to 2035
  • Figure 75: Western Europe Market Attractiveness Analysis by Packaging Type
  • Figure 76: Western Europe Market Value Share and BPS Analysis by Flavor, 2025 and 2035
  • Figure 77: Western Europe Market Y-o-Y Growth Comparison by Flavor, 2025 to 2035
  • Figure 78: Western Europe Market Attractiveness Analysis by Flavor
  • Figure 79: Western Europe Market Value Share and BPS Analysis by Product Form, 2025 and 2035
  • Figure 80: Western Europe Market Y-o-Y Growth Comparison by Product Form, 2025 to 2035
  • Figure 81: Western Europe Market Attractiveness Analysis by Product Form
  • Figure 82: Western Europe Market Value Share and BPS Analysis by Application, 2025 and 2035
  • Figure 83: Western Europe Market Y-o-Y Growth Comparison by Application, 2025 to 2035
  • Figure 84: Western Europe Market Attractiveness Analysis by Application
  • Figure 85: Western Europe Market Value Share and BPS Analysis by Sales Channel, 2025 and 2035
  • Figure 86: Western Europe Market Y-o-Y Growth Comparison by Sales Channel, 2025 to 2035
  • Figure 87: Western Europe Market Attractiveness Analysis by Sales Channel
  • Figure 88: Eastern Europe Market Value Share and BPS Analysis by Country, 2025 and 2035
  • Figure 89: Eastern Europe Market Value Share and BPS Analysis by Product Type, 2025 and 2035
  • Figure 90: Eastern Europe Market Y-o-Y Growth Comparison by Product Type, 2025 to 2035
  • Figure 91: Eastern Europe Market Attractiveness Analysis by Product Type
  • Figure 92: Eastern Europe Market Value Share and BPS Analysis by Packaging Type, 2025 and 2035
  • Figure 93: Eastern Europe Market Y-o-Y Growth Comparison by Packaging Type, 2025 to 2035
  • Figure 94: Eastern Europe Market Attractiveness Analysis by Packaging Type
  • Figure 95: Eastern Europe Market Value Share and BPS Analysis by Flavor, 2025 and 2035
  • Figure 96: Eastern Europe Market Y-o-Y Growth Comparison by Flavor, 2025 to 2035
  • Figure 97: Eastern Europe Market Attractiveness Analysis by Flavor
  • Figure 98: Eastern Europe Market Value Share and BPS Analysis by Product Form, 2025 and 2035
  • Figure 99: Eastern Europe Market Y-o-Y Growth Comparison by Product Form, 2025 to 2035
  • Figure 100: Eastern Europe Market Attractiveness Analysis by Product Form
  • Figure 101: Eastern Europe Market Value Share and BPS Analysis by Application, 2025 and 2035
  • Figure 102: Eastern Europe Market Y-o-Y Growth Comparison by Application, 2025 to 2035
  • Figure 103: Eastern Europe Market Attractiveness Analysis by Application
  • Figure 104: Eastern Europe Market Value Share and BPS Analysis by Sales Channel, 2025 and 2035
  • Figure 105: Eastern Europe Market Y-o-Y Growth Comparison by Sales Channel, 2025 to 2035
  • Figure 106: Eastern Europe Market Attractiveness Analysis by Sales Channel
  • Figure 107: East Asia Market Value Share and BPS Analysis by Country, 2025 and 2035
  • Figure 108: East Asia Market Value Share and BPS Analysis by Product Type, 2025 and 2035
  • Figure 109: East Asia Market Y-o-Y Growth Comparison by Product Type, 2025 to 2035
  • Figure 110: East Asia Market Attractiveness Analysis by Product Type
  • Figure 111: East Asia Market Value Share and BPS Analysis by Packaging Type, 2025 and 2035
  • Figure 112: East Asia Market Y-o-Y Growth Comparison by Packaging Type, 2025 to 2035
  • Figure 113: East Asia Market Attractiveness Analysis by Packaging Type
  • Figure 114: East Asia Market Value Share and BPS Analysis by Flavor, 2025 and 2035
  • Figure 115: East Asia Market Y-o-Y Growth Comparison by Flavor, 2025 to 2035
  • Figure 116: East Asia Market Attractiveness Analysis by Flavor
  • Figure 117: East Asia Market Value Share and BPS Analysis by Product Form, 2025 and 2035
  • Figure 118: East Asia Market Y-o-Y Growth Comparison by Product Form, 2025 to 2035
  • Figure 119: East Asia Market Attractiveness Analysis by Product Form
  • Figure 120: East Asia Market Value Share and BPS Analysis by Application, 2025 and 2035
  • Figure 121: East Asia Market Y-o-Y Growth Comparison by Application, 2025 to 2035
  • Figure 122: East Asia Market Attractiveness Analysis by Application
  • Figure 123: East Asia Market Value Share and BPS Analysis by Sales Channel, 2025 and 2035
  • Figure 124: East Asia Market Y-o-Y Growth Comparison by Sales Channel, 2025 to 2035
  • Figure 125: East Asia Market Attractiveness Analysis by Sales Channel
  • Figure 126: South Asia & Pacific Market Value Share and BPS Analysis by Country, 2025 and 2035
  • Figure 127: South Asia & Pacific Market Value Share and BPS Analysis by Product Type, 2025 and 2035
  • Figure 128: South Asia & Pacific Market Y-o-Y Growth Comparison by Product Type, 2025 to 2035
  • Figure 129: South Asia & Pacific Market Attractiveness Analysis by Product Type
  • Figure 130: South Asia & Pacific Market Value Share and BPS Analysis by Packaging Type, 2025 and 2035
  • Figure 131: South Asia & Pacific Market Y-o-Y Growth Comparison by Packaging Type, 2025 to 2035
  • Figure 132: South Asia & Pacific Market Attractiveness Analysis by Packaging Type
  • Figure 133: South Asia & Pacific Market Value Share and BPS Analysis by Flavor, 2025 and 2035
  • Figure 134: South Asia & Pacific Market Y-o-Y Growth Comparison by Flavor, 2025 to 2035
  • Figure 135: South Asia & Pacific Market Attractiveness Analysis by Flavor
  • Figure 136: South Asia & Pacific Market Value Share and BPS Analysis by Product Form, 2025 and 2035
  • Figure 137: South Asia & Pacific Market Y-o-Y Growth Comparison by Product Form, 2025 to 2035
  • Figure 138: South Asia & Pacific Market Attractiveness Analysis by Product Form
  • Figure 139: South Asia & Pacific Market Value Share and BPS Analysis by Application, 2025 and 2035
  • Figure 140: South Asia & Pacific Market Y-o-Y Growth Comparison by Application, 2025 to 2035
  • Figure 141: South Asia & Pacific Market Attractiveness Analysis by Application
  • Figure 142: South Asia & Pacific Market Value Share and BPS Analysis by Sales Channel, 2025 and 2035
  • Figure 143: South Asia & Pacific Market Y-o-Y Growth Comparison by Sales Channel, 2025 to 2035
  • Figure 144: South Asia & Pacific Market Attractiveness Analysis by Sales Channel
  • Figure 145: Middle East and Africa Market Value Share and BPS Analysis by Country, 2025 and 2035
  • Figure 146: Middle East and Africa Market Value Share and BPS Analysis by Product Type, 2025 and 2035
  • Figure 147: Middle East and Africa Market Y-o-Y Growth Comparison by Product Type, 2025 to 2035
  • Figure 148: Middle East and Africa Market Attractiveness Analysis by Product Type
  • Figure 149: Middle East and Africa Market Value Share and BPS Analysis by Packaging Type, 2025 and 2035
  • Figure 150: Middle East and Africa Market Y-o-Y Growth Comparison by Packaging Type, 2025 to 2035
  • Figure 151: Middle East and Africa Market Attractiveness Analysis by Packaging Type
  • Figure 152: Middle East and Africa Market Value Share and BPS Analysis by Flavor, 2025 and 2035
  • Figure 153: Middle East and Africa Market Y-o-Y Growth Comparison by Flavor, 2025 to 2035
  • Figure 154: Middle East and Africa Market Attractiveness Analysis by Flavor
  • Figure 155: Middle East and Africa Market Value Share and BPS Analysis by Product Form, 2025 and 2035
  • Figure 156: Middle East and Africa Market Y-o-Y Growth Comparison by Product Form, 2025 to 2035
  • Figure 157: Middle East and Africa Market Attractiveness Analysis by Product Form
  • Figure 158: Middle East and Africa Market Value Share and BPS Analysis by Application, 2025 and 2035
  • Figure 159: Middle East and Africa Market Y-o-Y Growth Comparison by Application, 2025 to 2035
  • Figure 160: Middle East and Africa Market Attractiveness Analysis by Application
  • Figure 161: Middle East and Africa Market Value Share and BPS Analysis by Sales Channel, 2025 and 2035
  • Figure 162: Middle East and Africa Market Y-o-Y Growth Comparison by Sales Channel, 2025 to 2035
  • Figure 163: Middle East and Africa Market Attractiveness Analysis by Sales Channel
  • Figure 164: Global Market - Tier Structure Analysis
  • Figure 165: Global Market - Company Share Analysis

Frequently Asked Questions

What is the estimated market size of the gelatin substitutes industry in 2025?

The industry is valued at USD 1.7 billion in 2025.

What is the projected industry size of the gelatin substitutes industry by 2035?

It is forecasted to reach USD 5.3 billion by 2035.

What is the expected CAGR for the gelatin substitutes industry between 2025 and 2035?

The industry is anticipated to grow at a CAGR of 12.1% during this period.

Which segment is expected to lead the gelatin substitutes market in 2025?

Unflavored are projected to lead the market with an 82.4% share in 2025.

Which region is expected to witness the highest growth in the gelatin substitutes market?

Asia Pacific particularly India, is expected to be the key growth region with a projected growth rate of 14.6%.

Explore Similar Insights

Future Market Insights

Gelatin Substitutes Market