
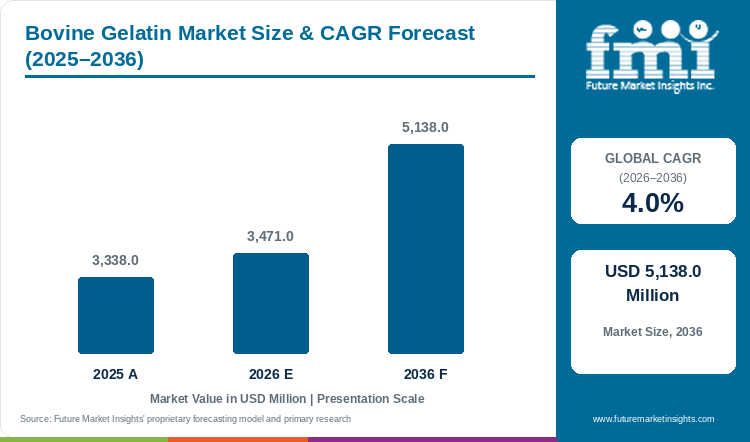
- Market Size (2026)
- USD 3471.0 Mn
- Forecast (2036)
- USD 5138.0 Mn
- CAGR (2026 to 2036)
- 4.0%
How big is the Bovine Gelatin Market in 2026?
The Bovine Gelatin Market is projected to reach USD 5,138.0 million by 2036, growing at a 4.0% CAGR from 2026 to 2036. FMI estimates the market at USD 3,471.0 million in 2026, up from USD 3,338.0 million in 2025. An Indian producer ran its gelatin plant at full capacity in 2025-26 while its gelatin price fell 3.0% [1]. Soft capsule demand in India absorbed the volume that US tariffs displaced [1]. Germany's competition authority cleared Europe's market leader to take control of the third-largest European producer on 27 April 2026 [19]. Cattle supply limits growth, with the US herd at 86.2 million head on 1 January 2026, down from 86.5 million a year earlier [3].
Raw material follows slaughter, because bovine hides and bones are by-products of the meat industry [8]. USDA forecasts world beef output at 60.2 million tonnes in 2026, down from 62.3 million tonnes in 2025 [11]. Brazil and the United States lead, followed by China, the European Union and India [11]. India is the only one of these five with a rising forecast, at 4.9 million tonnes including water buffalo [11]. Output in the other four is forecast lower, so fewer hides and bones will come from those regions [11].
Key Market Trends & Insights
- Darling Ingredients and Tessenderlo Group agreed in December 2025 to combine Rousselot and PB Leiner into one company [2]. The new company would hold about 200,000 metric tons of gelatin and collagen capacity across 22 facilities [2]. Ownership would split 85.0% to 15.0% between the partners [2]. Germany's competition authority cleared the deal on 27 April 2026 and found no critical gelatin market shares in Europe [19]. A half-year report of 27 August 2026 says closing awaits the remaining regulatory approvals [20].
- Sales of collagen peptides, an adjacent product outside the scope of this market, are growing faster than gelatin. A Japanese gelatin group sold JPY 7,265 million of collagen peptides in fiscal 2026, up 12.0% [4]. Its Indian unit raised collagen peptide sales volume by 57.0% in 2025-26 [1]. Producers can convert output between gelatin and peptides with modest investment [19]. Peptide demand therefore competes with gelatin for the same by-product supply [19].
- Trade policy now shapes where bovine gelatin is sold. Nitta Gelatin India said US tariffs made its gelatin uncompetitive in the United States for a substantial period [1]. It moved its volume to the home market [1].
Regional Highlights
- In Asia Pacific, Chinese gelatin exports rose 13.4% to USD 270 million in 2025 [13]. Gelita's Liaoyuan plant in Jilin province expects exports of 30.0% of its 2026 output [5].
- In North America, a shrinking cattle herd limits local raw material [3]. USDA counted 27.6 million beef cows on 1 January 2026, down 1.0% from a year earlier [3]. US buyers rely on imported gelatin, which was worth USD 304 million in 2024 [14].
Bovine Gelatin Market Size and Forecast
Table 1: Bovine Gelatin Market Size and Forecast
| Market size and forecast | Value |
|---|---|
| Market size in 2025 | USD 3,338.0 million |
| Estimated market size in 2026 | USD 3,471.0 million |
| Projected market size by 2036 | USD 5,138.0 million |
| CAGR from 2026 to 2036 | 4.0% |
Source: Future Market Insights analysis of the bovine gelatin market, 2026.
Analyst Perspective
“Capsule makers, confectioners and supplement brands buy bovine gelatin against gel strength, clarity and certification, so producers with their own hide and bone supply and a collagen peptide line can earn more from each tonne of raw material. Cattle availability and trade duties are the main risks to contracted volumes, because both can change landed cost within a season.”
- Nandini Roy Choudhury, Principal Consultant, FMI
How is the Bovine Gelatin Market segmented?
- By type: Type A, Type B.
- By end use: Food and Beverage, Pharmaceutical, Nutraceutical, Personal Care, Others.
- By raw material: Bovine Hide, Bovine Bone.
- By nature: Conventional, Organic.
- By region: North America, Latin America, Europe, East Asia, South Asia, Oceania, Middle East and Africa.
Why does Type B lead by Type in the Bovine Gelatin Market in 2026?
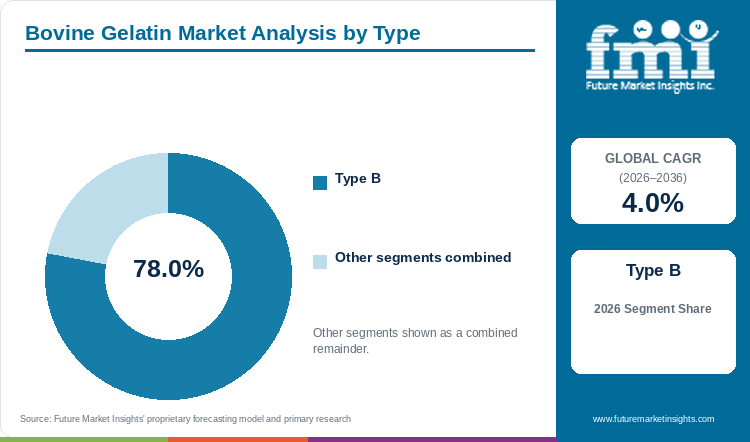
Type B holds 78.0% of the Bovine Gelatin Market by type in 2026.
Bovine hides and bones are treated with lime in the alkaline process that gives Type B gelatin, and producers of bone-based gelatin sell ossein and limed ossein as their raw material grades [1]. Type A is made by acid treatment and is mostly linked to pig skin, so it holds the remaining 22.0% of bovine-linked value, mainly from acid-processed bovine hide lines.
Table 2: Type, 2026 Share
| Leading Share | 2026 market share |
|---|---|
| Type B | 78.0% |
| All Other Segments Combined Share | 22.0% |
Source: Future Market Insights analysis of the bovine gelatin market, 2026.
Why does Food and Beverage lead by End Use in the Bovine Gelatin Market in 2026?
Food and beverage holds 44.0% of the Bovine Gelatin Market by end use in 2026.
Confectionery, dairy, desserts and meat products use gelatin for gel strength and texture at a low cost per tonne, and large groups point to health and nutrition uses of collagen as a reason to hold capacity [6]. Pharmaceutical, nutraceutical, personal care and other uses together hold 56.0%. Capsule and supplement demand is the fastest-growing part of this group, although price competition from plant-based gelling agents in gummies limits its pace.
Table 3: End Use, 2026 Share
| Leading Share | 2026 market share |
|---|---|
| Food and Beverage | 44.0% |
| All Other Segments Combined Share | 56.0% |
Source: Future Market Insights analysis of the bovine gelatin market, 2026.
Why does Bovine Hide lead by Raw Material in the Bovine Gelatin Market in 2026?
Bovine hide holds 56.0% of the Bovine Gelatin Market by raw material in 2026.
Hides come from beef slaughter in large volumes and are accepted for food gelatin under EU rules [7]. Gelatin makers describe bovine bones and hides as by-products of the meat industry that they convert into higher-value ingredients [8]. Hide has become a cheaper input than bone for gelatin, which presses bone gelatin prices [1]. Bovine bone holds the remaining 44.0%. Bone supply is exposed to US tariffs, because reported exports of bovine bone gelatin from India to North America were lower [4].
Table 4: Raw Material, 2026 Share
| Leading Share | 2026 market share |
|---|---|
| Bovine Hide | 56.0% |
| All Other Segments Combined Share | 44.0% |
Source: Future Market Insights analysis of the bovine gelatin market, 2026.
Why does Conventional gelatin lead by Nature in the Bovine Gelatin Market in 2026?
Conventional gelatin accounts for 97.0% of the Bovine Gelatin Market by nature in 2026.
Large plants are built around commodity bone and hide streams that are not separated by farm certification, and falling cattle numbers in the United States tighten the supply of any certified hides [3]. Organic gelatin holds the remaining 3.0% and is sold at a premium to a small group of supplement and food brands.
Table 5: Nature, 2026 Share
| Leading Share | 2026 market share |
|---|---|
| Conventional | 97.0% |
| All Other Segments Combined Share | 3.0% |
Source: Future Market Insights analysis of the bovine gelatin market, 2026.
What are the key drivers, restraints and opportunities?
Driver
Capsule and supplement demand. Rising preference for hard and soft capsules as pharmaceutical and nutraceutical delivery formats supports gelatin demand [1]. US tariffs made one Indian producer's gelatin uncompetitive in the United States, and soft capsule demand at home absorbed the volume [1]. The same producer raised gelatin volume by 6.6% in 2025-26 and ran its gelatin plant at full capacity [1].
Gelatin capacity at Indian and Chinese plants. The Indian producer has a gelatin expansion project progressing on schedule after a full-capacity year [1]. The Liaoyuan plant in Jilin province has 11,000 tons of annual capacity with its latest production line [5]. A 550 metric ton collagen peptide expansion in India is adjacent capacity and does not add bovine gelatin supply [1].
Restraint
Lower gelatin prices and tariff exposure. The Indian producer's gelatin price fell 3.0% and its limed ossein price fell 9.0% in 2025-26 [1]. It attributed the decline to hide becoming a cheaper input than bone and to US tariffs [1]. Higher volumes therefore earn less per tonne, and gelatin sales at its Japanese promoter fell 4.9% in fiscal 2026 [4].
Shrinking cattle herd. Raw material supply is tight in the United States, where the herd fell from 86.5 million head a year earlier [3], so fewer cattle are slaughtered and fewer local hides and bones reach gelatin plants.
Opportunity
Hide-based gelatin supply. Hide has become a cheaper input than bone for gelatin, which favours plants with beef hide access [1]. Brazil leads world beef output at 12.15 million tonnes in 2026 [11]. PB Leiner now fully owns the Acorizal beef hide gelatin plant in Brazil [20].
Trade reopening with India. A US and India framework announced in February 2026 reduced the US tariff on Indian goods to 18.0% [10][21]. The full trade agreement was still unsigned on 20 October 2026 after months of stalled talks [21]. The Indian producer expects a recovery in US sales once an agreement is concluded [1].
Bovine Gelatin Market by Country (2026 to 2036)
Table 6: Bovine Gelatin Market Country Growth Forecast
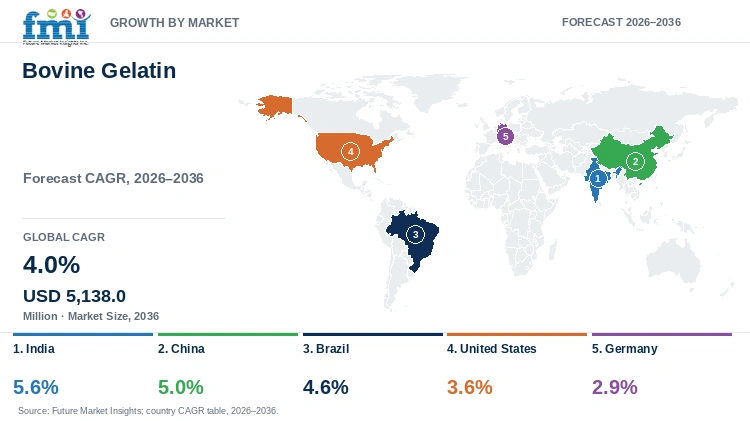
| Country | CAGR, 2026 to 2036 |
|---|---|
| India | 5.6% |
| China | 5.0% |
| Brazil | 4.6% |
| United States | 3.6% |
| Germany | 2.9% |
Source: Future Market Insights analysis of the bovine gelatin market, 2026.
India
Nitta Gelatin India ran its gelatin plant at full capacity in 2025-26 and raised gelatin volume by 6.6% [1]. Gross revenue from operations rose to INR 588.3 crore from INR 527.4 crore [1]. Exports were 33.0% of gelatin sales, so the US tariff outcome matters for growth [1]. The gelatin expansion project is progressing on schedule and supports a 5.6% CAGR for 2026 to 2036 [1].
Raw material supply explains most of India's lead. USDA records India's bovine stock at more than 307 million head and its 2026 calf crop at 72.1 million [11]. Beef output including water buffalo is forecast at 4.9 million tonnes in 2026, up 12.6% from 4.35 million in 2022 [11]. The United States, China and the European Union all produce less than in 2022 [11]. Among the five largest producers, India alone raises output in every year from 2022 to 2027 [11].
Trade data show an industry that exports and imports at similar scale. OEC records Indian gelatin exports of USD 56.3 million in 2024, which is 2.55% of world exports [12]. Imports were USD 46.5 million, and the figures cover gelatin of all origins [12]. China supplied USD 24.8 million of the imports, or 53%, so domestic producers face Chinese competition at home [12]. The United States took USD 13.9 million, which is 25% of Indian exports [12]. A US tariff settlement therefore decides a quarter of Indian export value [12].
China
Gelita's Liaoyuan plant has focused on pharmaceutical excipients and food processing [5]. Domestic pharmaceutical and food demand plus export growth support a 5.0% CAGR for 2026 to 2036. Its latest production line brings annual capacity to 11,000 tons [5]. Local authorities supply water, electricity and gas to the plant [5].
China grows at the second-highest rate although its own cattle base is shrinking. USDA's October circular shows 2026 beef output at 6.8 million tonnes, down from 8.0 million in 2025 [11]. The calf crop fell from 54.1 million head in 2023 to 42.4 million in 2026 [11]. Beef imports face a tariff-rate quota from 2026 to 2028, with a 55% tariff above quota [11]. Growth therefore depends on export and pharmaceutical demand, since domestic cattle supply is falling [11].
Exports carry the growth. OEC records Chinese gelatin exports of USD 238 million in 2024 and USD 270 million in 2025 [13]. That is a rise of 13.4% [13]. China holds 10.8% of world exports and ranks third, and Brazil is its main competitor at USD 294 million [13]. Imports were only USD 33.9 million in 2025, so net exports were about USD 236 million [13]. India led destinations in 2025 at USD 24 million [13]. Overseas contracts therefore decide a rising share of sales at Liaoyuan, where exports should reach 30.0% of 2026 output [5].
Brazil
Brazil has large beef slaughter volumes and is the base of Gelnex, which Darling bought in 2023 [6]. The acquisition brought five plants in South America and 46,000 metric tons of combined gelatin and collagen capacity [6]. A Brazilian beef hide gelatin plant at Acorizal in Mato Grosso moved to full ownership in June 2026 [20]. Raw material access and export reach support a 4.6% CAGR for 2026 to 2036.
Brazil leads on beef output but is entering a tighter phase of the cattle cycle. USDA records beef output of 12.15 million tonnes in 2026, after 12.6 million in 2025 [11]. It forecasts 11.95 million tonnes in 2027 [11]. Calf prices rose 31% in the first seven months of 2026 [15]. USDA expects slaughter to fall 2.6% to 48.2 million head in 2027 as producers retain cows [15]. Fewer animals slaughtered means fewer hides and bones, so growth in Brazilian gelatin volume must come from yield and exports.
Export reach is the offsetting strength. OEC records Brazilian gelatin exports of USD 294 million in 2024, ahead of China at USD 238 million [13]. Brazil supplied USD 71.2 million of US gelatin imports that year [14]. That fell to USD 61.7 million in 2025 and USD 37.9 million in the twelve months to August 2026 [14]. Beef trade is under pressure as well [11]. China's quota gives Brazil about 1.13 million tonnes for 2027, against a 2021 to 2025 average of 1.67 million [11]. EU rules made Brazil ineligible to export beef to the bloc from 3 September 2026 [11]. Brazil therefore pairs its lead in beef output with trade friction in beef and a narrower US gelatin channel [11][14]. Brazilian exporters must replace USD 33.3 million of annual US sales lost since 2024 [14].
United States
The US cattle herd stood at 86.2 million head on 1 January 2026, down from 86.5 million a year earlier [3]. That tightens local raw material for gelatin plants. Tight local supply and tariff exposure on imports hold the US to a 3.6% CAGR for 2026 to 2036.
US beef output is falling, so the raw material pool is shrinking. USDA forecasts 11.3 million tonnes in 2026 and 11.2 million in 2027, against 12.9 million in 2022 [11]. The calf crop is forecast at 32.5 million head in 2026, which is 5.6% below 2022 [11]. Beef cows numbered 27.6 million on 1 January 2026, down 1.0% from a year earlier [3]. Beef imports rose from 1.5 million tonnes in 2022 to 2.9 million in 2026 [11].
Gelatin follows the same pattern. OEC records US gelatin imports of USD 304 million in 2024 [14]. That is 13.7% of world imports, which makes the United States the leading importer [14]. US exports were USD 91.7 million, so imports were 3.3 times exports [14]. Imports declined to USD 263 million in 2025, with Brazil supplying USD 61.7 million, the most of any origin [14]. Chinese shipments fell from USD 26.7 million to USD 18.8 million [14]. The 2024 gelatin trade deficit was USD 212 million [14]. Buyers therefore carry the duty risk on imports that supplied USD 263 million of gelatin in 2025 [14].
Germany
Germany is a mature market with an established pharmaceutical and food base and long-standing gelatin supply from EU plants, so limited volume growth and high costs hold it to a 2.9% CAGR for 2026 to 2036.
Germany's cattle base has stabilised after a decade of decline. Destatis recorded 10.4 million cattle on 3 May 2026, up 0.2% on the year but 17.6% below May 2016 [16]. Cattle holdings fell 18.7% over the same ten years, to 120,300 [16]. USDA expects German dairy and beef cow herds to expand slightly in 2026, while animal welfare standards raise costs [18]. EU beef output is forecast at 6.3 million tonnes in 2027, against 6.7 million tonnes in 2022 [11].
The gelatin base is large but import-dependent. A Eurostat-based study shows Germany led 2024 EU production with EUR 295 million, or 23.0% of the disclosed total [17]. Apparent availability of 43.4 thousand tonnes is the highest of the 18 Member States with complete data [17]. Imports still supply 53.4% of German gross supply [17]. Across the EU, apparent availability grew 1.79% a year from 2014 to 2024, although the post-2017 trend was not statistically significant [17]. Germany reported EUR 296.0 million of exports against EUR 233.2 million of imports, including intra-EU trade [17]. The Bundeskartellamt cleared Europe's market leader to take control of the third-largest producer in April 2026 [19]. It expects enough alternative suppliers to remain available to buyers [19]. Buyers keep alternatives, but a 53.4% import share exposes German prices to origin and duty changes [17][19].
Who are the notable companies in the Bovine Gelatin Market?
Notable companies in the Bovine Gelatin Market include Darling, Tessenderlo, Gelita and Nitta Gelatin.
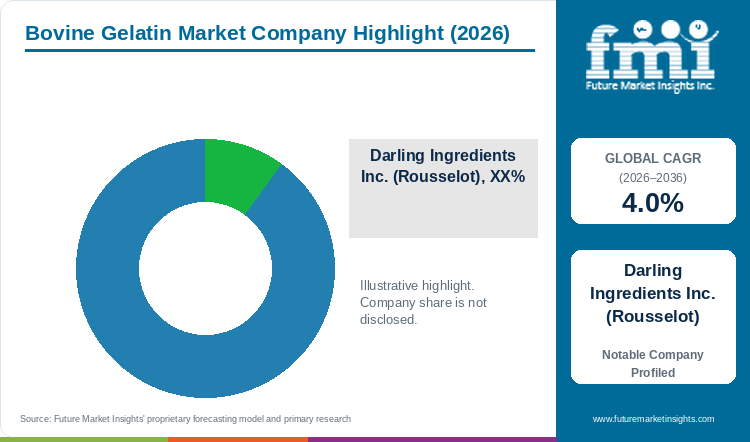
Raw material access separates bovine gelatin suppliers. Hide has become a cheaper input than bone [1], and cattle supply is shrinking in the United States and China [3][11]. Germany's Bundeskartellamt describes Darling Ingredients as Europe's market leader in gelatin and PB Leiner as the third-largest European producer [19]. The authority cleared Darling to take control of PB Leiner on 27 April 2026 [19]. The clearance covers a joint venture with Tessenderlo that bundles gelatin and collagen peptide activities [19]. The venture would hold about 200,000 metric tons of gelatin and collagen capacity across 22 facilities, with Darling owning 85.0% [2]. Tessenderlo's half-year report of 27 August 2026 says closing awaits remaining regulatory approvals [20].
Gelita supplies gelatin and collagen peptides from Germany [5]. Its Liaoyuan plant in Jilin province is described as its largest gelatin base worldwide [5]. The plant has 11,000 tons of annual capacity with its latest production line [5]. Exports are an explicit target there, at 30.0% of output in 2026 [5].
Nitta Gelatin and its Indian unit compete on bone gelatin with export reach [1][4]. Nitta Gelatin reported fiscal 2026 gelatin sales of JPY 27,410 million [4]. Nitta Gelatin India raised gelatin volume by 6.6% in 2025-26 on a plant at full capacity [1]. Exports took 33.0% of its gelatin sales [1]. A gelatin expansion project is progressing on schedule [1]. Its 550 metric ton collagen peptide expansion is adjacent capacity and does not add gelatin supply [1]. The company expects a recovery in US sales if a trade agreement is concluded, which was still unsigned on 20 October 2026 [1][21].
Key Developments in the Bovine Gelatin Market
- In April 2026 Germany's Bundeskartellamt cleared Darling Ingredients to take control of PB Leiner [19]. The clearance covers a joint venture that bundles gelatin and collagen peptide activities [19]. The authority found no critical gelatin market shares in Europe, and closing awaits remaining regulatory approvals [19][20].
- In June 2026 Tessenderlo took full ownership of a Brazilian beef hide gelatin plant at Acorizal [20]. In July 2026 it announced plans to close the Vilvoorde production site in Belgium [20]. A formal agreement with employee representatives followed on 21 August 2026 [20].
Key Players in the Bovine Gelatin Market
- Darling Ingredients Inc. (Rousselot)
- Tessenderlo Group (PB Leiner)
- Gelita AG
- Nitta Gelatin Inc.
- Nitta Gelatin India Ltd
Bovine Gelatin Market Report Scope
Table 7: Bovine Gelatin Market Report Scope
| Coverage field | Report scope |
|---|---|
| Market definition | Gelatin made from bovine hides and bones for food, pharmaceutical, nutraceutical and personal care uses, valued at manufacturer selling prices. Porcine, fish and poultry gelatin and plant-based gelling agents are excluded. |
| Type | Type A; Type B |
| End Use | Food and Beverage; Pharmaceutical; Nutraceutical; Personal Care; Others |
| Raw Material | Bovine Hide; Bovine Bone |
| Nature | Conventional; Organic |
| Regions and profiled countries | North America, Latin America, Europe, East Asia, South Asia, Oceania, Middle East and Africa. Profiled countries: India, China, Brazil, United States, Germany |
| Companies covered | Darling Ingredients Inc. (Rousselot); Tessenderlo Group (PB Leiner); Gelita AG; Nitta Gelatin Inc.; Nitta Gelatin India Ltd |
| Quantitative Units | USD million |
Bovine Gelatin Market by Segments
Bovine Gelatin Market segmented by Type:
- Type A
- Type B
Bovine Gelatin Market segmented by End Use:
- Food and Beverage
- Pharmaceutical
- Nutraceutical
- Personal Care
- Others
Bovine Gelatin Market segmented by Raw Material:
- Bovine Hide
- Bovine Bone
Bovine Gelatin Market segmented by Nature:
- Conventional
- Organic
Bovine Gelatin Market by Region
- North America
- Latin America
- Europe
- East Asia
- South Asia
- Oceania
- Middle East
- Africa
- India
- China
- Brazil
- United States
- Germany
Research Sources and Bibliography
- [1] Nitta Gelatin India Ltd. (2026). Directors' report, 50th Annual Report for the year ended 31 March 2026. https://indiainfoline.com/company/nitta-gelatin-india-ltd-share-price/directors-report/1526
- [2] FoodBev Media. (2025, December 11). Darling Ingredients and Tessenderlo sign agreement to merge collagen and gelatin segments. https://www.foodbev.com/news/darling-ingredients-and-tessenderlo-sign-agreement-to-merge-collagen-and-gelatin-segments
- [3] U.S. Department of Agriculture, National Agricultural Statistics Service. (2026, January 30). Cattle report, January 2026. https://data.nass.usda.gov/Newsroom/printable/2026/01-30-2026.pdf
- [4] Envalith. (2026). Nitta Gelatin Inc. (4977) segments, fiscal year ended March 2026. https://envalith.com/en/companies/4977/segments
- [5] China Daily. (2026, April 28). Gelita Liaoyuan Gelatine, Jilin province. https://global.chinadaily.com.cn/a/202604/28/WS69f050eda310d6866eb45f6c.html
- [6] Darling Ingredients Inc. (2023, April 3). Rousselot/Darling completes acquisition of Brazilian gelatin and collagen producer Gelnex. https://www.darlingii.com/media/news/rousselot-darling-completes-acquisition-of-brazilian-gelatin-and-collagen-producer-gelnex
- [7] Irish Statute Book. (2002). S.I. No. 4/2002, European Communities (Gelatine) Regulations, 2002. https://www.irishstatutebook.ie/2002/en/si/0004.html
- [8] Gelatine Manufacturers of Europe (GME). (2024). Presentation at the Animal Task Force seminar 2024. https://animaltaskforce.eu/wp-content/uploads/2024/11/ATF_seminar2024_06_GME.pdf
- [9] Darling Ingredients Inc. (2026, February 11). Darling Ingredients Inc. Reports Fourth Quarter and Fiscal Year 2025 Results. https://www.darlingii.com/media/news/20260211-darling-ingredients-inc-reports-fourth-quarter-2025-results
- [10] Morgan Lewis. (2026, February 17). US-India trade deal cuts tariffs, eases tensions. https://www.morganlewis.com/ru/pubs/2026/02/us-india-trade-deal-cuts-tariffs-eases-tensions
- [11] U.S. Department of Agriculture, Foreign Agricultural Service. (2026, October 9). Livestock and Poultry: World Markets and Trade. https://apps.fas.usda.gov/psdonline/circulars/livestock_poultry.pdf
- [12] Observatory of Economic Complexity. (2026). Gelatin (HS 3503) in India trade, 2024 data. https://oec.world/en/profile/bilateral-product/gelatin/reporter/ind
- [13] Observatory of Economic Complexity. (2026). Gelatin (HS 3503) in China trade, 2024 and 2025 data. https://oec.world/en/profile/bilateral-product/gelatin/reporter/chn
- [14] Observatory of Economic Complexity. (2026). Gelatin (HS 3503) in United States trade, 2024 and 2025 data. https://oec.world/en/profile/bilateral-product/gelatin/reporter/usa
- [15] U.S. Department of Agriculture, Foreign Agricultural Service. (2026, September 3). Livestock and Products Annual, Brazil, report BR2026-0035. https://apps.fas.usda.gov/newgainapi/api/Report/DownloadReportByFileName?fileName=Livestock+and+Products+Annual_Brasilia_Brazil_BR2026-0035.pdf
- [16] Statistisches Bundesamt (Destatis). (2026, June 26). Press release No. 221: livestock census of 3 May 2026, pigs and cattle. https://www.destatis.de/DE/Presse/Pressemitteilungen/2026/06/PD26_221_413.html
- [17] Santos, J., et al. (2026). The European animal-derived gelatine supply system: production, trade, availability and links to food gel-based applications. Gels, 12(11), 980. https://www.mdpi.com/2310-2861/12/11/980
- [18] U.S. Department of Agriculture, Foreign Agricultural Service. (2026, September 16). Livestock and Products Annual, European Union, report E42026-0070. https://apps.fas.usda.gov/newgainapi/api/Report/DownloadReportByFileName?fileName=Livestock+and+Products+Annual_The+Hague_European+Union_E42026-0070.pdf
- [19] Bundeskartellamt. (2026, April 27). Darling Ingredients darf die Kontrolle über die PB Leiner übernehmen. https://www.bundeskartellamt.de/SharedDocs/Meldung/DE/Pressemitteilungen/2026/04_27_2026_Darling_PBL.html
- [20] Tessenderlo Group. (2026, August 27). Tessenderlo Group HY26 results, press release. https://www.tessenderlo.com/sites/tessenderlo/files/files/2026-08/2026-pr-tessenderlo-group-hy26-results-english_1.pdf
- [21] The Associated Press. (2026, October 20). Marco Rubio says 'we're about as close as you can be' to an India trade deal after talks in Mumbai. Fortune. https://fortune.com/2026/10/20/marco-rubio-india-trade-talks-tariffs-russia-oil/
Table of Content
Table of Content
- Key Takeaways
- Market Size and CAGR
- Top Growth Driver
- Fastest Growing Segment
- Leading Region
- Key Companies
- Emerging Opportunities
- Executive Summary
- Global Market Outlook
- Demand-side Trends
- Supply-side Trends
- Technology Roadmap Analysis
- Analysis and Recommendations
- Analyst Perspective (What is happening? Why now? What should investors know?)
- Key Questions Answered
- How large is the market?
- What is the CAGR?
- What are key trends?
- Which region dominates?
- Who are the leaders?
Read More...
- Market Overview
- Market Coverage / Taxonomy
- Market Definition / Scope / Limitations
- Research Methodology
- Chapter Orientation
- Analytical Lens and Working Hypotheses
- Market Structure, Signals, and Trend Drivers
- Benchmarking and Cross-market Comparability
- Market Sizing, Forecasting, and Opportunity Mapping
- Research Design and Evidence Framework
- Desk Research Programme (Secondary Evidence)
- Expert Input and Fieldwork (Primary Evidence)
- Tooling, Models, and Reference Databases
- Data Engineering and Model Build
- Quality Assurance and Audit Trail
- Market Background
- Market Dynamics (Drivers, Restraints, Opportunity, Trends)
- Scenario Forecast (Optimistic, Likely, Conservative)
- Impact Analysis
- AI Impact
- Sustainability Impact
- Regulatory Impact
- Technology Impact
- Consumer / Buyer Analysis
- Purchase Drivers
- Adoption Barriers
- Buyer Journey
- Opportunity Map Analysis
- Product Life Cycle Analysis
- Supply Chain Analysis
- Investment Feasibility Matrix
- Value Chain Analysis
- PESTLE and Porter's Analysis
- Regulatory Landscape
- Regional Parent Market Outlook
- Production and Consumption Statistics
- Import and Export Statistics
- Global Market Analysis and Forecast, 2021 to 2036
- Historical Market Size Value (USD Million) Analysis, 2021 to 2025
- Current and Future Market Size Value (USD Million) Projections, 2026 to 2036
- Y-o-Y Growth Trend Analysis
- Absolute $ Opportunity Analysis
- Global Market Pricing Analysis, 2021 to 2036
- Global Market Analysis and Forecast, By Type, 2021 to 2036
- Introduction / Key Findings
- Historical Market Size Value (USD Million) Analysis By Type, 2021 to 2025
- Current and Future Market Size Value (USD Million) Analysis and Forecast By Type, 2026 to 2036
- Type A
- Type B
- Y-o-Y Growth Trend Analysis By Type, 2021 to 2025
- Absolute $ Opportunity Analysis By Type, 2026 to 2036
- Global Market Analysis and Forecast, By End Use, 2021 to 2036
- Introduction / Key Findings
- Historical Market Size Value (USD Million) Analysis By End Use, 2021 to 2025
- Current and Future Market Size Value (USD Million) Analysis and Forecast By End Use, 2026 to 2036
- Food and Beverage
- Pharmaceutical
- Nutraceutical
- Personal Care
- Others
- Y-o-Y Growth Trend Analysis By End Use, 2021 to 2025
- Absolute $ Opportunity Analysis By End Use, 2026 to 2036
- Global Market Analysis and Forecast, By Raw Material, 2021 to 2036
- Introduction / Key Findings
- Historical Market Size Value (USD Million) Analysis By Raw Material, 2021 to 2025
- Current and Future Market Size Value (USD Million) Analysis and Forecast By Raw Material, 2026 to 2036
- Bovine Hide
- Bovine Bone
- Y-o-Y Growth Trend Analysis By Raw Material, 2021 to 2025
- Absolute $ Opportunity Analysis By Raw Material, 2026 to 2036
- Global Market Analysis and Forecast, By Nature, 2021 to 2036
- Introduction / Key Findings
- Historical Market Size Value (USD Million) Analysis By Nature, 2021 to 2025
- Current and Future Market Size Value (USD Million) Analysis and Forecast By Nature, 2026 to 2036
- Conventional
- Organic
- Y-o-Y Growth Trend Analysis By Nature, 2021 to 2025
- Absolute $ Opportunity Analysis By Nature, 2026 to 2036
- Global Market Analysis and Forecast, By Region, 2021 to 2036
- Introduction
- Historical Market Size Value (USD Million) Analysis By Region, 2021 to 2025
- Current Market Size Value (USD Million) Analysis and Forecast By Region, 2026 to 2036
- North America
- Latin America
- Europe
- East Asia
- South Asia
- Oceania
- Middle East
- Africa
- Market Attractiveness Analysis By Region
- North America Market Analysis and Forecast, By Country, 2021 to 2036
- Historical Market Size Value (USD Million) Trend Analysis By Market Taxonomy, 2021 to 2025
- Market Size Value (USD Million) Forecast By Market Taxonomy, 2026 to 2036
- By Country
- By Type
- By End Use
- By Raw Material
- By Nature
- Market Attractiveness Analysis
- By Country
- By Type
- By End Use
- By Raw Material
- By Nature
- Key Takeaways
- Latin America Market Analysis and Forecast, By Country
- Historical Market Size Value (USD Million) Trend Analysis By Market Taxonomy, 2021 to 2025
- Market Size Value (USD Million) Forecast By Market Taxonomy, 2026 to 2036
- By Country
- By Type
- By End Use
- By Raw Material
- By Nature
- Market Attractiveness Analysis
- By Country
- By Type
- By End Use
- By Raw Material
- By Nature
- Key Takeaways
- Europe Market Analysis and Forecast, By Country
- Historical Market Size Value (USD Million) Trend Analysis By Market Taxonomy, 2021 to 2025
- Market Size Value (USD Million) Forecast By Market Taxonomy, 2026 to 2036
- By Country
- By Type
- By End Use
- By Raw Material
- By Nature
- Market Attractiveness Analysis
- By Country
- By Type
- By End Use
- By Raw Material
- By Nature
- Key Takeaways
- East Asia Market Analysis and Forecast, By Country
- Historical Market Size Value (USD Million) Trend Analysis By Market Taxonomy, 2021 to 2025
- Market Size Value (USD Million) Forecast By Market Taxonomy, 2026 to 2036
- By Country
- By Type
- By End Use
- By Raw Material
- By Nature
- Market Attractiveness Analysis
- By Country
- By Type
- By End Use
- By Raw Material
- By Nature
- Key Takeaways
- South Asia Market Analysis and Forecast, By Country
- Historical Market Size Value (USD Million) Trend Analysis By Market Taxonomy, 2021 to 2025
- Market Size Value (USD Million) Forecast By Market Taxonomy, 2026 to 2036
- By Country
- By Type
- By End Use
- By Raw Material
- By Nature
- Market Attractiveness Analysis
- By Country
- By Type
- By End Use
- By Raw Material
- By Nature
- Key Takeaways
- Oceania Market Analysis and Forecast, By Country
- Historical Market Size Value (USD Million) Trend Analysis By Market Taxonomy, 2021 to 2025
- Market Size Value (USD Million) Forecast By Market Taxonomy, 2026 to 2036
- By Country
- By Type
- By End Use
- By Raw Material
- By Nature
- Market Attractiveness Analysis
- By Country
- By Type
- By End Use
- By Raw Material
- By Nature
- Key Takeaways
- Middle East Market Analysis and Forecast, By Country
- Historical Market Size Value (USD Million) Trend Analysis By Market Taxonomy, 2021 to 2025
- Market Size Value (USD Million) Forecast By Market Taxonomy, 2026 to 2036
- By Country
- By Type
- By End Use
- By Raw Material
- By Nature
- Market Attractiveness Analysis
- By Country
- By Type
- By End Use
- By Raw Material
- By Nature
- Key Takeaways
- Africa Market Analysis and Forecast, By Country
- Historical Market Size Value (USD Million) Trend Analysis By Market Taxonomy, 2021 to 2025
- Market Size Value (USD Million) Forecast By Market Taxonomy, 2026 to 2036
- By Country
- India
- China
- Brazil
- United States
- Germany
- By Type
- By End Use
- By Raw Material
- By Nature
- By Country
- Market Attractiveness Analysis
- By Country
- By Type
- By End Use
- By Raw Material
- By Nature
- Key Takeaways
- Key Countries Market Analysis
- United States
- Pricing Analysis
- Market Share Analysis, 2025
- By Type
- By End Use
- By Raw Material
- By Nature
- Brazil
- Pricing Analysis
- Market Share Analysis, 2025
- By Type
- By End Use
- By Raw Material
- By Nature
- Germany
- Pricing Analysis
- Market Share Analysis, 2025
- By Type
- By End Use
- By Raw Material
- By Nature
- India
- Pricing Analysis
- Market Share Analysis, 2025
- By Type
- By End Use
- By Raw Material
- By Nature
- China
- Pricing Analysis
- Market Share Analysis, 2025
- By Type
- By End Use
- By Raw Material
- By Nature
- United States
- Market Structure Analysis
- Competition Dashboard
- Competition Benchmarking
- Market Share Analysis of Top Players
- By Regional
- By Type
- By End Use
- By Raw Material
- By Nature
- Emerging Startups
- Innovation Benchmarking
- Competition Analysis
- Competition Deep Dive
- Darling Ingredients Inc. (Rousselot)
- Overview
- Product Portfolio
- Profitability by Market Segments
- Sales Footprint
- Strategy Overview
- Marketing Strategy
- Product Strategy
- Channel Strategy
- Tessenderlo Group (PB Leiner)
- Gelita AG
- Nitta Gelatin Inc.
- Nitta Gelatin India Ltd
- Darling Ingredients Inc. (Rousselot)
- Case Studies
- Success Stories
- Recent Developments
- Competition Deep Dive
- Assumptions & Acronyms Used
List of Tables
- Table 1: Global Market Value (USD Million) Forecast by Region, 2021 to 2036
- Table 2: Global Market Value (USD Million) Forecast by Type, 2021 to 2036
- Table 3: Global Market Value (USD Million) Forecast by End Use, 2021 to 2036
- Table 4: Global Market Value (USD Million) Forecast by Raw Material, 2021 to 2036
- Table 5: Global Market Value (USD Million) Forecast by Nature, 2021 to 2036
- Table 6: North America Market Value (USD Million) Forecast by Country, 2021 to 2036
- Table 7: North America Market Value (USD Million) Forecast by Type, 2021 to 2036
- Table 8: North America Market Value (USD Million) Forecast by End Use, 2021 to 2036
- Table 9: North America Market Value (USD Million) Forecast by Raw Material, 2021 to 2036
- Table 10: North America Market Value (USD Million) Forecast by Nature, 2021 to 2036
- Table 11: Latin America Market Value (USD Million) Forecast by Country, 2021 to 2036
- Table 12: Latin America Market Value (USD Million) Forecast by Type, 2021 to 2036
- Table 13: Latin America Market Value (USD Million) Forecast by End Use, 2021 to 2036
- Table 14: Latin America Market Value (USD Million) Forecast by Raw Material, 2021 to 2036
- Table 15: Latin America Market Value (USD Million) Forecast by Nature, 2021 to 2036
- Table 16: Europe Market Value (USD Million) Forecast by Country, 2021 to 2036
- Table 17: Europe Market Value (USD Million) Forecast by Type, 2021 to 2036
- Table 18: Europe Market Value (USD Million) Forecast by End Use, 2021 to 2036
- Table 19: Europe Market Value (USD Million) Forecast by Raw Material, 2021 to 2036
- Table 20: Europe Market Value (USD Million) Forecast by Nature, 2021 to 2036
- Table 21: East Asia Market Value (USD Million) Forecast by Country, 2021 to 2036
- Table 22: East Asia Market Value (USD Million) Forecast by Type, 2021 to 2036
- Table 23: East Asia Market Value (USD Million) Forecast by End Use, 2021 to 2036
- Table 24: East Asia Market Value (USD Million) Forecast by Raw Material, 2021 to 2036
- Table 25: East Asia Market Value (USD Million) Forecast by Nature, 2021 to 2036
- Table 26: South Asia Market Value (USD Million) Forecast by Country, 2021 to 2036
- Table 27: South Asia Market Value (USD Million) Forecast by Type, 2021 to 2036
- Table 28: South Asia Market Value (USD Million) Forecast by End Use, 2021 to 2036
- Table 29: South Asia Market Value (USD Million) Forecast by Raw Material, 2021 to 2036
- Table 30: South Asia Market Value (USD Million) Forecast by Nature, 2021 to 2036
- Table 31: Oceania Market Value (USD Million) Forecast by Country, 2021 to 2036
- Table 32: Oceania Market Value (USD Million) Forecast by Type, 2021 to 2036
- Table 33: Oceania Market Value (USD Million) Forecast by End Use, 2021 to 2036
- Table 34: Oceania Market Value (USD Million) Forecast by Raw Material, 2021 to 2036
- Table 35: Oceania Market Value (USD Million) Forecast by Nature, 2021 to 2036
- Table 36: Middle East Market Value (USD Million) Forecast by Country, 2021 to 2036
- Table 37: Middle East Market Value (USD Million) Forecast by Type, 2021 to 2036
- Table 38: Middle East Market Value (USD Million) Forecast by End Use, 2021 to 2036
- Table 39: Middle East Market Value (USD Million) Forecast by Raw Material, 2021 to 2036
- Table 40: Middle East Market Value (USD Million) Forecast by Nature, 2021 to 2036
- Table 41: Africa Market Value (USD Million) Forecast by Country, 2021 to 2036
- Table 42: Africa Market Value (USD Million) Forecast by Type, 2021 to 2036
- Table 43: Africa Market Value (USD Million) Forecast by End Use, 2021 to 2036
- Table 44: Africa Market Value (USD Million) Forecast by Raw Material, 2021 to 2036
- Table 45: Africa Market Value (USD Million) Forecast by Nature, 2021 to 2036
List of Figures
- Figure 1: Global Market Pricing Analysis
- Figure 2: Global Market Value (USD Million) Forecast 2021-2036
- Figure 3: Global Market Value Share and BPS Analysis by Type, 2026 and 2036
- Figure 4: Global Market Y-o-Y Growth Comparison by Type, 2026-2036
- Figure 5: Global Market Attractiveness Analysis by Type
- Figure 6: Global Market Value Share and BPS Analysis by End Use, 2026 and 2036
- Figure 7: Global Market Y-o-Y Growth Comparison by End Use, 2026-2036
- Figure 8: Global Market Attractiveness Analysis by End Use
- Figure 9: Global Market Value Share and BPS Analysis by Raw Material, 2026 and 2036
- Figure 10: Global Market Y-o-Y Growth Comparison by Raw Material, 2026-2036
- Figure 11: Global Market Attractiveness Analysis by Raw Material
- Figure 12: Global Market Value Share and BPS Analysis by Nature, 2026 and 2036
- Figure 13: Global Market Y-o-Y Growth Comparison by Nature, 2026-2036
- Figure 14: Global Market Attractiveness Analysis by Nature
- Figure 15: Global Market Value (USD Million) Share and BPS Analysis by Region, 2026 and 2036
- Figure 16: Global Market Y-o-Y Growth Comparison by Region, 2026-2036
- Figure 17: Global Market Attractiveness Analysis by Region
- Figure 18: North America Market Incremental Dollar Opportunity, 2026-2036
- Figure 19: Latin America Market Incremental Dollar Opportunity, 2026-2036
- Figure 20: Europe Market Incremental Dollar Opportunity, 2026-2036
- Figure 21: East Asia Market Incremental Dollar Opportunity, 2026-2036
- Figure 22: South Asia Market Incremental Dollar Opportunity, 2026-2036
- Figure 23: Oceania Market Incremental Dollar Opportunity, 2026-2036
- Figure 24: Middle East Market Incremental Dollar Opportunity, 2026-2036
- Figure 25: Africa Market Incremental Dollar Opportunity, 2026-2036
- Figure 26: North America Market Value Share and BPS Analysis by Country, 2026 and 2036
- Figure 27: North America Market Value Share and BPS Analysis by Type, 2026 and 2036
- Figure 28: North America Market Y-o-Y Growth Comparison by Type, 2026-2036
- Figure 29: North America Market Attractiveness Analysis by Type
- Figure 30: North America Market Value Share and BPS Analysis by End Use, 2026 and 2036
- Figure 31: North America Market Y-o-Y Growth Comparison by End Use, 2026-2036
- Figure 32: North America Market Attractiveness Analysis by End Use
- Figure 33: North America Market Value Share and BPS Analysis by Raw Material, 2026 and 2036
- Figure 34: North America Market Y-o-Y Growth Comparison by Raw Material, 2026-2036
- Figure 35: North America Market Attractiveness Analysis by Raw Material
- Figure 36: North America Market Value Share and BPS Analysis by Nature, 2026 and 2036
- Figure 37: North America Market Y-o-Y Growth Comparison by Nature, 2026-2036
- Figure 38: North America Market Attractiveness Analysis by Nature
- Figure 39: Latin America Market Value Share and BPS Analysis by Country, 2026 and 2036
- Figure 40: Latin America Market Value Share and BPS Analysis by Type, 2026 and 2036
- Figure 41: Latin America Market Y-o-Y Growth Comparison by Type, 2026-2036
- Figure 42: Latin America Market Attractiveness Analysis by Type
- Figure 43: Latin America Market Value Share and BPS Analysis by End Use, 2026 and 2036
- Figure 44: Latin America Market Y-o-Y Growth Comparison by End Use, 2026-2036
- Figure 45: Latin America Market Attractiveness Analysis by End Use
- Figure 46: Latin America Market Value Share and BPS Analysis by Raw Material, 2026 and 2036
- Figure 47: Latin America Market Y-o-Y Growth Comparison by Raw Material, 2026-2036
- Figure 48: Latin America Market Attractiveness Analysis by Raw Material
- Figure 49: Latin America Market Value Share and BPS Analysis by Nature, 2026 and 2036
- Figure 50: Latin America Market Y-o-Y Growth Comparison by Nature, 2026-2036
- Figure 51: Latin America Market Attractiveness Analysis by Nature
- Figure 52: Europe Market Value Share and BPS Analysis by Country, 2026 and 2036
- Figure 53: Europe Market Value Share and BPS Analysis by Type, 2026 and 2036
- Figure 54: Europe Market Y-o-Y Growth Comparison by Type, 2026-2036
- Figure 55: Europe Market Attractiveness Analysis by Type
- Figure 56: Europe Market Value Share and BPS Analysis by End Use, 2026 and 2036
- Figure 57: Europe Market Y-o-Y Growth Comparison by End Use, 2026-2036
- Figure 58: Europe Market Attractiveness Analysis by End Use
- Figure 59: Europe Market Value Share and BPS Analysis by Raw Material, 2026 and 2036
- Figure 60: Europe Market Y-o-Y Growth Comparison by Raw Material, 2026-2036
- Figure 61: Europe Market Attractiveness Analysis by Raw Material
- Figure 62: Europe Market Value Share and BPS Analysis by Nature, 2026 and 2036
- Figure 63: Europe Market Y-o-Y Growth Comparison by Nature, 2026-2036
- Figure 64: Europe Market Attractiveness Analysis by Nature
- Figure 65: East Asia Market Value Share and BPS Analysis by Country, 2026 and 2036
- Figure 66: East Asia Market Value Share and BPS Analysis by Type, 2026 and 2036
- Figure 67: East Asia Market Y-o-Y Growth Comparison by Type, 2026-2036
- Figure 68: East Asia Market Attractiveness Analysis by Type
- Figure 69: East Asia Market Value Share and BPS Analysis by End Use, 2026 and 2036
- Figure 70: East Asia Market Y-o-Y Growth Comparison by End Use, 2026-2036
- Figure 71: East Asia Market Attractiveness Analysis by End Use
- Figure 72: East Asia Market Value Share and BPS Analysis by Raw Material, 2026 and 2036
- Figure 73: East Asia Market Y-o-Y Growth Comparison by Raw Material, 2026-2036
- Figure 74: East Asia Market Attractiveness Analysis by Raw Material
- Figure 75: East Asia Market Value Share and BPS Analysis by Nature, 2026 and 2036
- Figure 76: East Asia Market Y-o-Y Growth Comparison by Nature, 2026-2036
- Figure 77: East Asia Market Attractiveness Analysis by Nature
- Figure 78: South Asia Market Value Share and BPS Analysis by Country, 2026 and 2036
- Figure 79: South Asia Market Value Share and BPS Analysis by Type, 2026 and 2036
- Figure 80: South Asia Market Y-o-Y Growth Comparison by Type, 2026-2036
- Figure 81: South Asia Market Attractiveness Analysis by Type
- Figure 82: South Asia Market Value Share and BPS Analysis by End Use, 2026 and 2036
- Figure 83: South Asia Market Y-o-Y Growth Comparison by End Use, 2026-2036
- Figure 84: South Asia Market Attractiveness Analysis by End Use
- Figure 85: South Asia Market Value Share and BPS Analysis by Raw Material, 2026 and 2036
- Figure 86: South Asia Market Y-o-Y Growth Comparison by Raw Material, 2026-2036
- Figure 87: South Asia Market Attractiveness Analysis by Raw Material
- Figure 88: South Asia Market Value Share and BPS Analysis by Nature, 2026 and 2036
- Figure 89: South Asia Market Y-o-Y Growth Comparison by Nature, 2026-2036
- Figure 90: South Asia Market Attractiveness Analysis by Nature
- Figure 91: Oceania Market Value Share and BPS Analysis by Country, 2026 and 2036
- Figure 92: Oceania Market Value Share and BPS Analysis by Type, 2026 and 2036
- Figure 93: Oceania Market Y-o-Y Growth Comparison by Type, 2026-2036
- Figure 94: Oceania Market Attractiveness Analysis by Type
- Figure 95: Oceania Market Value Share and BPS Analysis by End Use, 2026 and 2036
- Figure 96: Oceania Market Y-o-Y Growth Comparison by End Use, 2026-2036
- Figure 97: Oceania Market Attractiveness Analysis by End Use
- Figure 98: Oceania Market Value Share and BPS Analysis by Raw Material, 2026 and 2036
- Figure 99: Oceania Market Y-o-Y Growth Comparison by Raw Material, 2026-2036
- Figure 100: Oceania Market Attractiveness Analysis by Raw Material
- Figure 101: Oceania Market Value Share and BPS Analysis by Nature, 2026 and 2036
- Figure 102: Oceania Market Y-o-Y Growth Comparison by Nature, 2026-2036
- Figure 103: Oceania Market Attractiveness Analysis by Nature
- Figure 104: Middle East Market Value Share and BPS Analysis by Country, 2026 and 2036
- Figure 105: Middle East Market Value Share and BPS Analysis by Type, 2026 and 2036
- Figure 106: Middle East Market Y-o-Y Growth Comparison by Type, 2026-2036
- Figure 107: Middle East Market Attractiveness Analysis by Type
- Figure 108: Middle East Market Value Share and BPS Analysis by End Use, 2026 and 2036
- Figure 109: Middle East Market Y-o-Y Growth Comparison by End Use, 2026-2036
- Figure 110: Middle East Market Attractiveness Analysis by End Use
- Figure 111: Middle East Market Value Share and BPS Analysis by Raw Material, 2026 and 2036
- Figure 112: Middle East Market Y-o-Y Growth Comparison by Raw Material, 2026-2036
- Figure 113: Middle East Market Attractiveness Analysis by Raw Material
- Figure 114: Middle East Market Value Share and BPS Analysis by Nature, 2026 and 2036
- Figure 115: Middle East Market Y-o-Y Growth Comparison by Nature, 2026-2036
- Figure 116: Middle East Market Attractiveness Analysis by Nature
- Figure 117: Africa Market Value Share and BPS Analysis by Country, 2026 and 2036
- Figure 118: Africa Market Value Share and BPS Analysis by Type, 2026 and 2036
- Figure 119: Africa Market Y-o-Y Growth Comparison by Type, 2026-2036
- Figure 120: Africa Market Attractiveness Analysis by Type
- Figure 121: Africa Market Value Share and BPS Analysis by End Use, 2026 and 2036
- Figure 122: Africa Market Y-o-Y Growth Comparison by End Use, 2026-2036
- Figure 123: Africa Market Attractiveness Analysis by End Use
- Figure 124: Africa Market Value Share and BPS Analysis by Raw Material, 2026 and 2036
- Figure 125: Africa Market Y-o-Y Growth Comparison by Raw Material, 2026-2036
- Figure 126: Africa Market Attractiveness Analysis by Raw Material
- Figure 127: Africa Market Value Share and BPS Analysis by Nature, 2026 and 2036
- Figure 128: Africa Market Y-o-Y Growth Comparison by Nature, 2026-2036
- Figure 129: Africa Market Attractiveness Analysis by Nature
- Figure 130: Global Market - Tier Structure Analysis
- Figure 131: Global Market - Company Share Analysis
Frequently Asked Questions
How big is the bovine gelatin market in 2026?
FMI estimates the market at USD 3,471.0 million in 2026, up from USD 3,338.0 million in 2025. It is forecast to reach USD 5,138.0 million by 2036 at a 4.0% CAGR.
Which type leads the bovine gelatin market in 2026?
Type B leads by type with 78.0% in 2026. Type A holds the remaining 22.0%.
Which end use leads the bovine gelatin market?
Food and beverage leads with 44.0% in 2026. Pharmaceutical, nutraceutical, personal care and other uses together hold 56.0%.
Which country is forecast to grow fastest through 2036?
India has the highest forecast CAGR among the profiled countries at 5.6% during 2026 to 2036, followed by China at 5.0%.
How do tariffs affect bovine gelatin suppliers?
Tariffs change which origins can sell in a market at a viable price. A February 2026 US and India framework reduced the US tariff on Indian goods to 18.0% [10][21]. The full trade agreement was still unsigned on 20 October 2026 [21].
What limits bovine gelatin supply?
Cattle numbers are the main limit, since the US herd was 86.2 million head on 1 January 2026, below the 86.5 million a year earlier [3].
Preview the report firsthand - request a free sample
Get SampleGet the brochure for pricing and purchase details.
Get PDF
