Baking Molds And Trays Market
Bakeries Shift towards Modern Techniques Encourages the Demand for Baking Molds & Trays: Explore the Latest Trends with FMI
Baking Molds & Trays Market by Cavity Type, Material, End Use & Region | Forecast 2023 to 2033
Baking Molds & Trays Market Outlook
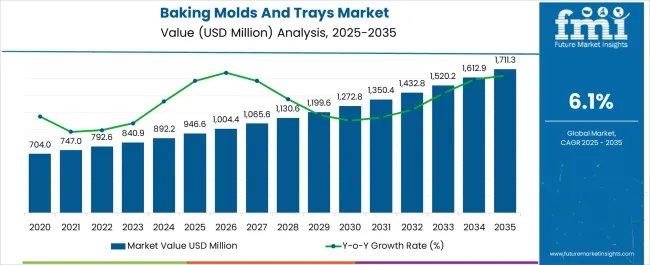
The global baking molds & trays market size is poised to reach US$ 840.9 million in 2023, finds Future Market Insights (FMI) in a recent market analysis. Sales of baking molds & trays are expected to expand at a significant 6.1% CAGR between 2023 and 2033.
It is anticipated that rising consumer demand for convenience food increases the production of bakery goods and fuels market demand. As baking molds and trays are used to bake a variety of bakery goods, the demand for ready-to-eat snacks and convenience foods is expected to increase.
The expansion of bakeries and confectioneries in industrialized nations like the United States, Canada, and Germany is anticipated to positively affect market expansion. For instance, the United States bread and confectionery industry generated approximately USD 35 billion in revenue in 2019, up from USD 33 billion in 2018.
Accordingly, the market is anticipated to increase favorably and reach a value of US$ 1,520.3 million by 2033.
Attributes |
Details |
Baking Molds & Trays Market CAGR (2023 to 2033) |
6.1% |
Baking Molds & Trays Market Size (2023) |
US$ 840.9 million |
Baking Molds & Trays Market Size (2033) |
US$ 1,520.3 million |
Let us know your requirement to get
100% FREE customization
How Does the Market Outlook for Baking Molds and Trays Compare Between 2023 to 2033 and 2016 to 2022?
Growth in the fast-moving consumer goods industry has caused accelerated growth in the baking molds & trays sector. It is predicted to rise at 6.1% CAGR from 2023 to 2033, in comparison to the 3.1% CAGR registered from 2016 to 2022. The market accounted for nearly 1.8% of the bakery & confectionery market in 2021.
Particulars |
Details |
Jan-Jun (H1), 2021 (A) |
3.0% |
Jan-Jun (H1), 2022 Projected (P) |
2.7% |
Jan-Jun (H1), 2022 Outlook (O) |
3.4% |
BPS: H1,2022 (O) - H1,2022 (A) |
40 |
BPS: H1,2022 (O) - H1,2021 (A) |
70 |
Globally, an economic surge has resulted in the rise in consumption of bakery and confectionery products, which makes the market expand at a Y-o-Y of 3.2% in 2023.
On the back of these factors, the global baking molds & trays industry is anticipated to create an incremental opportunity of US$ 684 million during the assessment period. The market showed an amazing jump from US$ 665.3 million in 2016 to US$ 814.66 million in 2022.
Restaurants and bakeries are shifting towards non-stick baking molds & trays to reduce the time and labor invested in cleaning utensils. Traditionally usage of plastic molds & trays was very common in the food services industry, but lately, it has been transitioning to lightweight, durable, safe, and hygienic silicone molds & trays.
The bakery and confectionery segment is anticipated to expand almost 2 times its current value, by the end of 2033.
Short-term growth (2023 to 2026): A growing inclination towards e-Commerce is observed, and the industry is expected to grow steadily during the forecast period. Big brands are already acknowledging the value of e-commerce and wholesale packaging, without compromising on consumer satisfaction.
Medium-term growth (2027 to 2030): An increase in disposable income has caused consumers in emerging economies to spend more on the food and food services sector, and this trend is expected to continue in the coming years.
Long-term growth (2031 to 2033): The increasing mass production of bakery and confectionery food items has spurred the demand for baking molds & trays in commercial and industrial sectors. This continues to create a conducive environment for baking molds & trays sector growth through 2033.
How does Demand for Hygienic Packaging Solutions Drive Baking Molds & Trays Market?
Increasing awareness about the use of hygienic packaging solutions for various food packaging applications in emerging economies offers immense growth opportunities to the baking molds & trays market.
Consumers prefer ready-to-eat meals available in the microwave and oven-safe packaging that suit their busy lifestyles and need for hassle-free cooking operations. While demand is picking up globally, low penetration in some emerging economies due to fewer suppliers and manufacturers offering packaging solutions might hinder the growth of the market.
To capitalize on untapped potential in emerging economies, market players are collaborating with regional and local players. Expansion strategies adopted by them are expected to bode well for the global market.
Find your sweet spots for generating winning opportunities in this market.
Talk to AnalystComparative View of the Baking Molds & Trays Market
Baking Molds & Trays Market:
Attributes |
Baking Molds & Trays Market |
CAGR (2023 to 2033) |
6.1% |
Market Value (2033) |
US$ 1,520.3 million |
Growth Factor |
High demand for ready-to-eat food |
Opportunity |
Increased awareness about hygiene packaging |
Key Trends |
Rising e-commerce industry |
Molded Pulp Basket Market:
Attributes |
Molded Pulp Basket Market |
CAGR (2023 to 2033) |
4.3% |
Market Value (2033) |
US$ 7.34 billion |
Growth Factor |
Growing demand for sustainable boxes |
Opportunity |
The shift in consumer preferences |
Key Trends |
The growing trend for aesthetically appealing packaging |
Trays Market:
Attributes |
Trays Market |
CAGR (2023 to 2033) |
7.3% |
Market Value (2033) |
US$ 33.8 billion |
Growth Factor |
Growing consumption of packaged food |
Opportunity |
Contribution to electrical and electronic company |
Key Trends |
Key players focus on customization. |
Country-wise Insights
Why is the United States Baking Molds & Trays Sector Considered Lucrative?
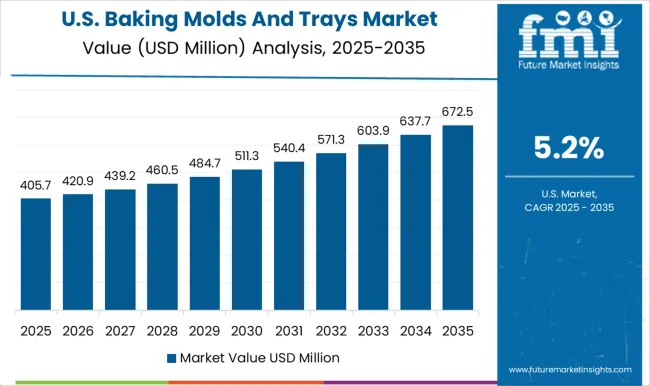
North America is forecast to be the most money-making market. The United States dominated the market with a share of 15.2% in 2022. According to the analysis, the United States is expected to hold almost 80% of the North America baking molds & trays market till 2033.
As per the American Bakers Association, the baking industry generates a profit of almost 2% of the GDP of the United States. The baked products manufactured and sold in the United States surpassed US$ 124.1 million in 2022. Consumers have more preference for bread besides rolls and cakes, and this consumption is increasing at a fast pace.
What is the Growth Outlook for the United Kingdom Baking Molds & Trays Sector?
In the United Kingdom, the market for baking trays and molds has been expanding significantly. In 2022, the market was worth US$ 21.4 million. The popularity of baking as a hobby and the rising number of home bakers have played a significant role in this growth.
The market is anticipated to expand at a predicted CAGR of 4.86%, with a value of US$ 32.8 million during the forecast period. The expanding trend of healthy eating, as well as the rising demand for convenience and specialty goods, are anticipated to fuel this expansion.
The most widely used baking trays and molds are those constructed of silicone, glass, and metal. Metal molds, which make up about 70% of the market, account for the majority of sales. However, as they are simple to use, simple to clean, and have excellent non-stick properties, silicone molds are becoming more and more well-liked.
Asia Pacific Outlook
Country | China |
Market CAGR (2023 to 2033) | 6.53% |
Market Value 2022 | US$ 65.5 million |
Market Value 2033 | US$ 115.7 million |
Country | India |
Market CAGR (2023 to 2033) | 8.36% |
Market Value 2022 | US$ 38.3 million |
Market Value 2033 | US$ 78.8 million |
Why are Baking Molds & Trays Manufacturers Eyeing to Strengthen their Footprints in China?
China has always gained global popularity due to its stronghold in infrastructural & industrial growth. In 2021, the country is projected to account for over 36% of the baking molds & trays sector in East Asia.
Besides increasing uptake of the latest technologies, the low cost of manufacturing and availability of cheap labor has positioned China to exhibit strong growth in the East Asia baking molds & trays business.
According to the National Health & Nutrition Survey, China is Asia’s leading market for the food & food services industry, also making it highly lucrative for sales of baking molds & trays manufacturers.
How does the Expansion of the Food & Food Services Industry Impact India's Baking Molds & Trays Market?
India is the leading shareholder, accounting for almost 25% of sales in the South Asia baking molds & trays sector by 2033. The expansion and penetration of the baking & confectionery services present lucrative opportunities for baking molds & trays industry growth in India. As per FMI, the demand for reusable mold is considerably high in the country.
How does Japan Baking Molds & Trays Market Fare?
As per FMI, Japan had a market share of 6.3% and a worth of US$ 51.5 million in 2022. Japan is one of the key producers of baking molds & trays in East Asia. Manufacturers from Japan are keenly focusing on developing safe products for consumers.
Also, major bakery & confectionary providers from Japan are transitioning from plastic molds & trays to silicone and wooden molds & trays, which are sustainable and do not cause a carbon footprint. Subsequently, the Japan baking molds & trays market created an incremental opportunity of US$ 55.4 million during the forecast period.
Section 419 (Section 350h) of the Food and Drug Administration (FDA), states the standards for produce safety. These safety regulations are set to boost the market for safe and hygienic food preparing and packaging solutions like baking molds & trays in Japan. To fulfill this regulation, many of the key players in Japan are planning to shift towards clean room facilities and green baking containers.

A unified Market Research Subscription Platform, built for today's disparate research needs.
Category-wise Insights
Why is Multiple Cavity Preferred in the Baking Molds & Trays Market?
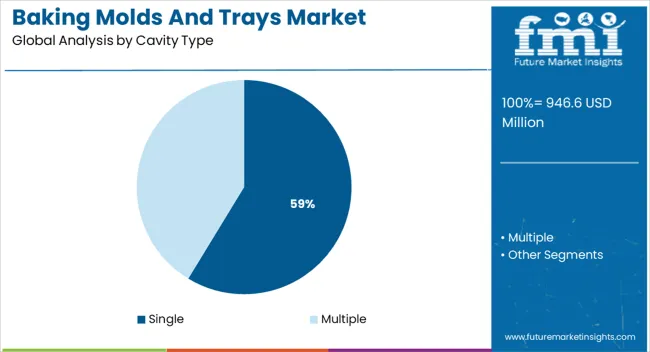
Multiple cavities are widely preferred in the market due to the convenience it offers, due to which they commanded over 79.9% of the market share in 2022. Globally, the demand for convenience in day-to-day life has transformed packaging, as consumers who are vastly leading busy lifestyles are likely to have more influence on the packaging industry than any other existing factor.
Attributes such as convenience in storage and handling, and ease of usage, have largely affected the use of packaging. Due to this, people are more inclined towards purchasing bakery & confectionary products. As a result, the usage of multiple cavity baking molds & trays is likely to expand by 2.02 times by 2033.
Which is the Preferred Material for Baking Molds & Trays Manufacturing?
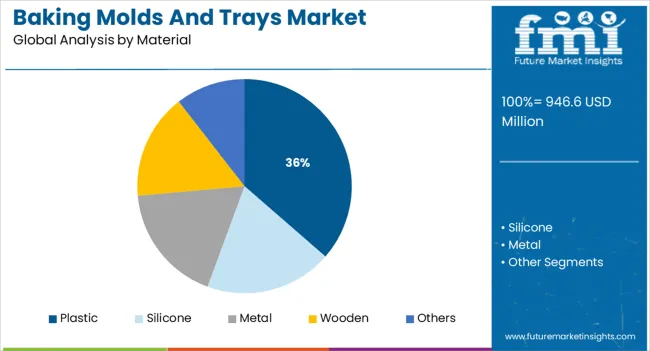
Metal is widely used in the market due to its flexibility, durability, and lightweight properties. Metal accounted for about 32.6% of the market share in 2022. North America and Europe are largely emphasizing sustainable development and implementing strict rules to curb the carbon footprint.
The trend is moving away from plastic as a basic material and toward silicone.
Silicone has a large market share since it is a better environmentally friendly solution and can be recycled after being used for a while.
Who are the Leading End Users of Baking Molds & Trays?
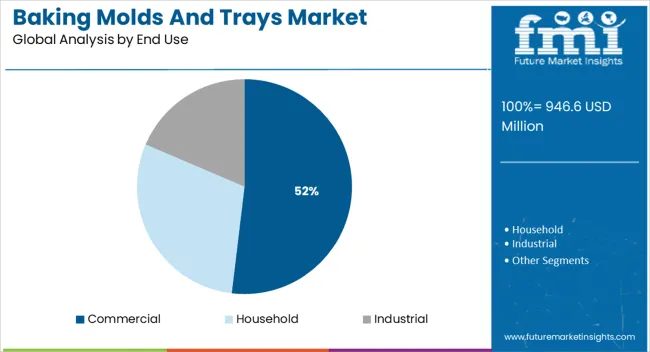
The industrial segment leads the global baking molds & trays holding market. It accounted for a share of about 57% in the year 2020. The industrial segment continues to lead the market due to the high demand for factory-produced bakery & confectionery products, chocolates, and bread among others.
Competitive Landscape
Baking Molds & Trays Start-ups Meeting the Need for Commercial Bakers
The market is fiercely competitive, with many start-ups concentrating on offering cutting-edge solutions for the baking sector. Bake Boss, Bakershacks, and Bake Rite are a few of the top start-up businesses in the baking molds and trays sector.
These businesses are concentrating on offering an extensive selection of molds and trays of high caliber that are made to satisfy the requirements of industrial bakers. These startups also put a lot of effort into giving their clients personalized solutions.
Fresh Strategies Supports Baking Molds & Trays Industry Players to Focus on Sustainable Products
Companies operating in the baking molds & trays market are aiming at expansion and strategic partnerships with other manufacturers to expand their product manufacturing capabilities, product portfolio, and global presence.
- In July 2021, Guardini S.p.A. launched a B-Nat Line which is a high-quality sustainable product that is 100% manufactured in Italy.
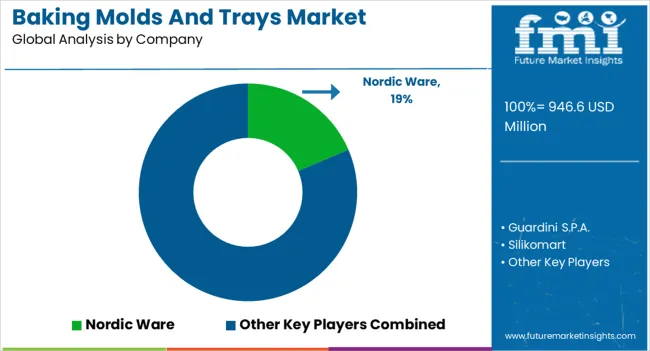
- In March 2021, Nordic Ware underwent expansion as home baking surged amid the COVID pandemic. The company’s sales increased by over 400%, and construction is underway for a 22,000-square-foot addition to the fulfillment center. Later on, Nordic Ware moved on to phase-2 expansion by building 45,000 square feet of warehouse space.
- In March 2021, Bold Maker introduced New THC Chocolate Bar Polycarbonate Mold, which is a 9-piece multiple cavity baking molds made from FDA 21 CFR Compliant Polycarbonate.
- In October 2020, Hans Brunner GmbH expanded by opening its first overseas subsidiary in Brazil. With the ability to communicate in the local language & elimination of time differences, companies can complete customer projects efficiently.
- In May 2019, Guardini S.p.A. launched the Elite brand, which is a range of elegant design baking molds characterized by high thickness. Due to its high quality, it has excellent resistance to wear and showcases high non-stick performance.
Key players
- Nordic Ware
- Guardini S.p.A.
- SILIKOMART S.r.l.
- Pavoni Italia S.p.A.
- Hans Brunner GmbH
- Dongguan AASIN Technology Co. Ltd.
- Panibois
- Bold Maker
- TEMMA SHIKI
- Rubber Silicone Molds
- Schneider GmbH
- Suzhou Nuoyi Silicone Products Co. Ltd.
- JF Sheet Metal Technology Co. Ltd.
- Shenzhen Milabao Houseware Co. Ltd.
- SHEEL Industries
- Motiba Silicone Pvt. Ltd.
- Indigo Metalware
- Lekue USA
- Rolex Tin & Metal Works
- First Impression Molds
- Yangjiang YJCB Trade Co. Ltd.
- Implast Chocolate Moulds Company
Key Segments
By Cavity Type:
- Single
- Multiple
By Material:
- Plastic
- Silicone
- Metal
- Wooden
- Others
By End Use:
- Commercial
- Household
- Industrial
By Region:
- North America
- Latin America
- Europe
- South Asia
- East Asia
- Middle East & Africa
- Oceania
Frequently Asked Questions
How Much is the Baking Molds & Trays Market Worth?
The baking molds & trays market is estimated to be worth US$ 840.9 million in 2023.
What is the Demand Outlook for the Baking Molds & Trays Market?
The baking molds & trays sector is expected to have a CAGR of 6.1% by 2033.
What is the Historical Baking Molds & Trays Market Share?
The baking molds & trays market expanded at a share of US$ 814.66 million in 2022.
What is the North America Baking Molds & Trays Market Outlook?
North America accounted for a 15.2% share in the baking molds & trays sector in 2022.
Which is the United Kingdom Baking Molds & Trays Market Outlook?
The United Kingdom accounts for 4.86% CAGR in the baking molds & trays market by 2033.
Table of Content
1. Executive Summary | Baking Molds And Trays Market 1.1. Global Market Outlook 1.2. Demand-side Trends 1.3. Supply-side Trends 1.4. Technology Roadmap Analysis 1.5. Analysis and Recommendations 2. Market Overview 2.1. Market Coverage / Taxonomy 2.2. Market Definition / Scope / Limitations 3. Market Background 3.1. Market Dynamics 3.1.1. Drivers 3.1.2. Restraints 3.1.3. Opportunity 3.1.4. Trends 3.2. Scenario Forecast 3.2.1. Demand in Optimistic Scenario 3.2.2. Demand in Likely Scenario 3.2.3. Demand in Conservative Scenario 3.3. Opportunity Map Analysis 3.4. Product Life Cycle Analysis 3.5. Supply Chain Analysis 3.5.1. Supply Side Participants and their Roles 3.5.1.1. Producers 3.5.1.2. Mid-Level Participants (Traders/ Agents/ Brokers) 3.5.1.3. Wholesalers and Distributors 3.5.2. Value Added and Value Created at Node in the Supply Chain 3.5.3. List of Raw Material Suppliers 3.5.4. List of Existing and Potential Buyer’s 3.6. Investment Feasibility Matrix 3.7. Value Chain Analysis 3.7.1. Profit Margin Analysis 3.7.2. Wholesalers and Distributors 3.7.3. Retailers 3.8. PESTLE and Porter’s Analysis 3.9. Regulatory Landscape 3.9.1. By Key Regions 3.9.2. By Key Countries 3.10. Regional Parent Market Outlook 3.11. Production and Consumption Statistics 3.12. Import and Export Statistics 4. Global Market Analysis 2018 to 2022 and Forecast, 2023 to 2033 4.1. Historical Market Size Value (US$ Million) & Volume (Units) Analysis, 2018 to 2022 4.2. Current and Future Market Size Value (US$ Million) & Volume (Units) Projections, 2023 to 2033 4.2.1. Y-o-Y Growth Trend Analysis 4.2.2. Absolute $ Opportunity Analysis 5. Global Market Analysis 2018 to 2022 and Forecast 2023 to 2033, By Cavity Type 5.1. Introduction / Key Findings 5.2. Historical Market Size Value (US$ Million) & Volume (Units) Analysis By Cavity Type, 2018 to 2022 5.3. Current and Future Market Size Value (US$ Million) & Volume (Units) Analysis and Forecast By Cavity Type, 2023 to 2033 5.3.1. Single 5.3.2. Multiple 5.4. Y-o-Y Growth Trend Analysis By Cavity Type, 2018 to 2022 5.5. Absolute $ Opportunity Analysis By Cavity Type, 2023 to 2033 6. Global Market Analysis 2018 to 2022 and Forecast 2023 to 2033, By Material 6.1. Introduction / Key Findings 6.2. Historical Market Size Value (US$ Million) & Volume (Units) Analysis By Material, 2018 to 2022 6.3. Current and Future Market Size Value (US$ Million) & Volume (Units) Analysis and Forecast By Material, 2023 to 2033 6.3.1. Plastic 6.3.2. Silicone 6.3.3. Metal 6.3.4. Wooden 6.3.5. Others 6.4. Y-o-Y Growth Trend Analysis By Material, 2018 to 2022 6.5. Absolute $ Opportunity Analysis By Material, 2023 to 2033 7. Global Market Analysis 2018 to 2022 and Forecast 2023 to 2033, By End Use 7.1. Introduction / Key Findings 7.2. Historical Market Size Value (US$ Million) & Volume (Units) Analysis By End Use, 2018 to 2022 7.3. Current and Future Market Size Value (US$ Million) & Volume (Units) Analysis and Forecast By End Use, 2023 to 2033 7.3.1. Commercial 7.3.2. Household 7.3.3. Industrial 7.4. Y-o-Y Growth Trend Analysis By End Use, 2018 to 2022 7.5. Absolute $ Opportunity Analysis By End Use, 2023 to 2033 8. Global Market Analysis 2018 to 2022 and Forecast 2023 to 2033, By Region 8.1. Introduction 8.2. Historical Market Size Value (US$ Million) & Volume (Units) Analysis By Region, 2018 to 2022 8.3. Current Market Size Value (US$ Million) & Volume (Units) Analysis and Forecast By Region, 2023 to 2033 8.3.1. North America 8.3.2. Latin America 8.3.3. Europe 8.3.4. Asia Pacific 8.3.5. MEA 8.4. Market Attractiveness Analysis By Region 9. North America Market Analysis 2018 to 2022 and Forecast 2023 to 2033, By Country 9.1. Historical Market Size Value (US$ Million) & Volume (Units) Trend Analysis By Market Taxonomy, 2018 to 2022 9.2. Market Size Value (US$ Million) & Volume (Units) Forecast By Market Taxonomy, 2023 to 2033 9.2.1. By Country 9.2.1.1. The USA 9.2.1.2. Canada 9.2.2. By Cavity Type 9.2.3. By Material 9.2.4. By End Use 9.3. Market Attractiveness Analysis 9.3.1. By Country 9.3.2. By Cavity Type 9.3.3. By Material 9.3.4. By End Use 9.4. Key Takeaways 10. Latin America Market Analysis 2018 to 2022 and Forecast 2023 to 2033, By Country 10.1. Historical Market Size Value (US$ Million) & Volume (Units) Trend Analysis By Market Taxonomy, 2018 to 2022 10.2. Market Size Value (US$ Million) & Volume (Units) Forecast By Market Taxonomy, 2023 to 2033 10.2.1. By Country 10.2.1.1. Brazil 10.2.1.2. Mexico 10.2.1.3. Rest of Latin America 10.2.2. By Cavity Type 10.2.3. By Material 10.2.4. By End Use 10.3. Market Attractiveness Analysis 10.3.1. By Country 10.3.2. By Cavity Type 10.3.3. By Material 10.3.4. By End Use 10.4. Key Takeaways 11. Europe Market Analysis 2018 to 2022 and Forecast 2023 to 2033, By Country 11.1. Historical Market Size Value (US$ Million) & Volume (Units) Trend Analysis By Market Taxonomy, 2018 to 2022 11.2. Market Size Value (US$ Million) & Volume (Units) Forecast By Market Taxonomy, 2023 to 2033 11.2.1. By Country 11.2.1.1. Germany 11.2.1.2. United Kingdom 11.2.1.3. France 11.2.1.4. Spain 11.2.1.5. Italy 11.2.1.6. Rest of Europe 11.2.2. By Cavity Type 11.2.3. By Material 11.2.4. By End Use 11.3. Market Attractiveness Analysis 11.3.1. By Country 11.3.2. By Cavity Type 11.3.3. By Material 11.3.4. By End Use 11.4. Key Takeaways 12. Asia Pacific Market Analysis 2018 to 2022 and Forecast 2023 to 2033, By Country 12.1. Historical Market Size Value (US$ Million) & Volume (Units) Trend Analysis By Market Taxonomy, 2018 to 2022 12.2. Market Size Value (US$ Million) & Volume (Units) Forecast By Market Taxonomy, 2023 to 2033 12.2.1. By Country 12.2.1.1. China 12.2.1.2. Japan 12.2.1.3. South Korea 12.2.1.4. Singapore 12.2.1.5. Thailand 12.2.1.6. Indonesia 12.2.1.7. Australia 12.2.1.8. New Zealand 12.2.1.9. Rest of Asia Pacific 12.2.2. By Cavity Type 12.2.3. By Material 12.2.4. By End Use 12.3. Market Attractiveness Analysis 12.3.1. By Country 12.3.2. By Cavity Type 12.3.3. By Material 12.3.4. By End Use 12.4. Key Takeaways 13. MEA Market Analysis 2018 to 2022 and Forecast 2023 to 2033, By Country 13.1. Historical Market Size Value (US$ Million) & Volume (Units) Trend Analysis By Market Taxonomy, 2018 to 2022 13.2. Market Size Value (US$ Million) & Volume (Units) Forecast By Market Taxonomy, 2023 to 2033 13.2.1. By Country 13.2.1.1. GCC Countries 13.2.1.2. South Africa 13.2.1.3. Israel 13.2.1.4. Rest of MEA 13.2.2. By Cavity Type 13.2.3. By Material 13.2.4. By End Use 13.3. Market Attractiveness Analysis 13.3.1. By Country 13.3.2. By Cavity Type 13.3.3. By Material 13.3.4. By End Use 13.4. Key Takeaways 14. Key Countries Market Analysis 14.1. USA 14.1.1. Pricing Analysis 14.1.2. Market Share Analysis, 2022 14.1.2.1. By Cavity Type 14.1.2.2. By Material 14.1.2.3. By End Use 14.2. Canada 14.2.1. Pricing Analysis 14.2.2. Market Share Analysis, 2022 14.2.2.1. By Cavity Type 14.2.2.2. By Material 14.2.2.3. By End Use 14.3. Brazil 14.3.1. Pricing Analysis 14.3.2. Market Share Analysis, 2022 14.3.2.1. By Cavity Type 14.3.2.2. By Material 14.3.2.3. By End Use 14.4. Mexico 14.4.1. Pricing Analysis 14.4.2. Market Share Analysis, 2022 14.4.2.1. By Cavity Type 14.4.2.2. By Material 14.4.2.3. By End Use 14.5. Germany 14.5.1. Pricing Analysis 14.5.2. Market Share Analysis, 2022 14.5.2.1. By Cavity Type 14.5.2.2. By Material 14.5.2.3. By End Use 14.6. United Kingdom 14.6.1. Pricing Analysis 14.6.2. Market Share Analysis, 2022 14.6.2.1. By Cavity Type 14.6.2.2. By Material 14.6.2.3. By End Use 14.7. France 14.7.1. Pricing Analysis 14.7.2. Market Share Analysis, 2022 14.7.2.1. By Cavity Type 14.7.2.2. By Material 14.7.2.3. By End Use 14.8. Spain 14.8.1. Pricing Analysis 14.8.2. Market Share Analysis, 2022 14.8.2.1. By Cavity Type 14.8.2.2. By Material 14.8.2.3. By End Use 14.9. Italy 14.9.1. Pricing Analysis 14.9.2. Market Share Analysis, 2022 14.9.2.1. By Cavity Type 14.9.2.2. By Material 14.9.2.3. By End Use 14.10. China 14.10.1. Pricing Analysis 14.10.2. Market Share Analysis, 2022 14.10.2.1. By Cavity Type 14.10.2.2. By Material 14.10.2.3. By End Use 14.11. Japan 14.11.1. Pricing Analysis 14.11.2. Market Share Analysis, 2022 14.11.2.1. By Cavity Type 14.11.2.2. By Material 14.11.2.3. By End Use 14.12. South Korea 14.12.1. Pricing Analysis 14.12.2. Market Share Analysis, 2022 14.12.2.1. By Cavity Type 14.12.2.2. By Material 14.12.2.3. By End Use 14.13. Singapore 14.13.1. Pricing Analysis 14.13.2. Market Share Analysis, 2022 14.13.2.1. By Cavity Type 14.13.2.2. By Material 14.13.2.3. By End Use 14.14. Thailand 14.14.1. Pricing Analysis 14.14.2. Market Share Analysis, 2022 14.14.2.1. By Cavity Type 14.14.2.2. By Material 14.14.2.3. By End Use 14.15. Indonesia 14.15.1. Pricing Analysis 14.15.2. Market Share Analysis, 2022 14.15.2.1. By Cavity Type 14.15.2.2. By Material 14.15.2.3. By End Use 14.16. Australia 14.16.1. Pricing Analysis 14.16.2. Market Share Analysis, 2022 14.16.2.1. By Cavity Type 14.16.2.2. By Material 14.16.2.3. By End Use 14.17. New Zealand 14.17.1. Pricing Analysis 14.17.2. Market Share Analysis, 2022 14.17.2.1. By Cavity Type 14.17.2.2. By Material 14.17.2.3. By End Use 14.18. GCC Countries 14.18.1. Pricing Analysis 14.18.2. Market Share Analysis, 2022 14.18.2.1. By Cavity Type 14.18.2.2. By Material 14.18.2.3. By End Use 14.19. South Africa 14.19.1. Pricing Analysis 14.19.2. Market Share Analysis, 2022 14.19.2.1. By Cavity Type 14.19.2.2. By Material 14.19.2.3. By End Use 14.20. Israel 14.20.1. Pricing Analysis 14.20.2. Market Share Analysis, 2022 14.20.2.1. By Cavity Type 14.20.2.2. By Material 14.20.2.3. By End Use 15. Market Structure Analysis 15.1. Competition Dashboard 15.2. Competition Benchmarking 15.3. Market Share Analysis of Top Players 15.3.1. By Regional 15.3.2. By Cavity Type 15.3.3. By Material 15.3.4. By End Use 16. Competition Analysis 16.1. Competition Deep Dive 16.1.1. Nordic Ware 16.1.1.1. Overview 16.1.1.2. Product Portfolio 16.1.1.3. Profitability by Market Segments 16.1.1.4. Sales Footprint 16.1.1.5. Strategy Overview 16.1.1.5.1. Marketing Strategy 16.1.1.5.2. Product Strategy 16.1.1.5.3. Channel Strategy 16.1.2. Guardini S.P.A. 16.1.2.1. Overview 16.1.2.2. Product Portfolio 16.1.2.3. Profitability by Market Segments 16.1.2.4. Sales Footprint 16.1.2.5. Strategy Overview 16.1.2.5.1. Marketing Strategy 16.1.2.5.2. Product Strategy 16.1.2.5.3. Channel Strategy 16.1.3. Silikomart 16.1.3.1. Overview 16.1.3.2. Product Portfolio 16.1.3.3. Profitability by Market Segments 16.1.3.4. Sales Footprint 16.1.3.5. Strategy Overview 16.1.3.5.1. Marketing Strategy 16.1.3.5.2. Product Strategy 16.1.3.5.3. Channel Strategy 16.1.4. Pavoni Italia 16.1.4.1. Overview 16.1.4.2. Product Portfolio 16.1.4.3. Profitability by Market Segments 16.1.4.4. Sales Footprint 16.1.4.5. Strategy Overview 16.1.4.5.1. Marketing Strategy 16.1.4.5.2. Product Strategy 16.1.4.5.3. Channel Strategy 16.1.5. Hans Brunner GmbH 16.1.5.1. Overview 16.1.5.2. Product Portfolio 16.1.5.3. Profitability by Market Segments 16.1.5.4. Sales Footprint 16.1.5.5. Strategy Overview 16.1.5.5.1. Marketing Strategy 16.1.5.5.2. Product Strategy 16.1.5.5.3. Channel Strategy 16.1.6. Panibois 16.1.6.1. Overview 16.1.6.2. Product Portfolio 16.1.6.3. Profitability by Market Segments 16.1.6.4. Sales Footprint 16.1.6.5. Strategy Overview 16.1.6.5.1. Marketing Strategy 16.1.6.5.2. Product Strategy 16.1.6.5.3. Channel Strategy 16.1.7. Bold Maker 16.1.7.1. Overview 16.1.7.2. Product Portfolio 16.1.7.3. Profitability by Market Segments 16.1.7.4. Sales Footprint 16.1.7.5. Strategy Overview 16.1.7.5.1. Marketing Strategy 16.1.7.5.2. Product Strategy 16.1.7.5.3. Channel Strategy 16.1.8. TEMMA SHIKI 16.1.8.1. Overview 16.1.8.2. Product Portfolio 16.1.8.3. Profitability by Market Segments 16.1.8.4. Sales Footprint 16.1.8.5. Strategy Overview 16.1.8.5.1. Marketing Strategy 16.1.8.5.2. Product Strategy 16.1.8.5.3. Channel Strategy 16.1.9. Schneider GmbH 16.1.9.1. Overview 16.1.9.2. Product Portfolio 16.1.9.3. Profitability by Market Segments 16.1.9.4. Sales Footprint 16.1.9.5. Strategy Overview 16.1.9.5.1. Marketing Strategy 16.1.9.5.2. Product Strategy 16.1.9.5.3. Channel Strategy 16.1.10. Indigo Metalware 16.1.10.1. Overview 16.1.10.2. Product Portfolio 16.1.10.3. Profitability by Market Segments 16.1.10.4. Sales Footprint 16.1.10.5. Strategy Overview 16.1.10.5.1. Marketing Strategy 16.1.10.5.2. Product Strategy 16.1.10.5.3. Channel Strategy 17. Assumptions & Acronyms Used 18. Research Methodology
Let us know your requirement to get
100% FREE customization
List of Tables
Table 1: Global Market Value (US$ Million) Forecast by Region, 2018 to 2033 Table 2: Global Market Volume (Units) Forecast by Region, 2018 to 2033 Table 3: Global Market Value (US$ Million) Forecast by Cavity Type, 2018 to 2033 Table 4: Global Market Volume (Units) Forecast by Cavity Type, 2018 to 2033 Table 5: Global Market Value (US$ Million) Forecast by Material, 2018 to 2033 Table 6: Global Market Volume (Units) Forecast by Material, 2018 to 2033 Table 7: Global Market Value (US$ Million) Forecast by End Use, 2018 to 2033 Table 8: Global Market Volume (Units) Forecast by End Use, 2018 to 2033 Table 9: North America Market Value (US$ Million) Forecast by Country, 2018 to 2033 Table 10: North America Market Volume (Units) Forecast by Country, 2018 to 2033 Table 11: North America Market Value (US$ Million) Forecast by Cavity Type, 2018 to 2033 Table 12: North America Market Volume (Units) Forecast by Cavity Type, 2018 to 2033 Table 13: North America Market Value (US$ Million) Forecast by Material, 2018 to 2033 Table 14: North America Market Volume (Units) Forecast by Material, 2018 to 2033 Table 15: North America Market Value (US$ Million) Forecast by End Use, 2018 to 2033 Table 16: North America Market Volume (Units) Forecast by End Use, 2018 to 2033 Table 17: Latin America Market Value (US$ Million) Forecast by Country, 2018 to 2033 Table 18: Latin America Market Volume (Units) Forecast by Country, 2018 to 2033 Table 19: Latin America Market Value (US$ Million) Forecast by Cavity Type, 2018 to 2033 Table 20: Latin America Market Volume (Units) Forecast by Cavity Type, 2018 to 2033 Table 21: Latin America Market Value (US$ Million) Forecast by Material, 2018 to 2033 Table 22: Latin America Market Volume (Units) Forecast by Material, 2018 to 2033 Table 23: Latin America Market Value (US$ Million) Forecast by End Use, 2018 to 2033 Table 24: Latin America Market Volume (Units) Forecast by End Use, 2018 to 2033 Table 25: Europe Market Value (US$ Million) Forecast by Country, 2018 to 2033 Table 26: Europe Market Volume (Units) Forecast by Country, 2018 to 2033 Table 27: Europe Market Value (US$ Million) Forecast by Cavity Type, 2018 to 2033 Table 28: Europe Market Volume (Units) Forecast by Cavity Type, 2018 to 2033 Table 29: Europe Market Value (US$ Million) Forecast by Material, 2018 to 2033 Table 30: Europe Market Volume (Units) Forecast by Material, 2018 to 2033 Table 31: Europe Market Value (US$ Million) Forecast by End Use, 2018 to 2033 Table 32: Europe Market Volume (Units) Forecast by End Use, 2018 to 2033 Table 33: Asia Pacific Market Value (US$ Million) Forecast by Country, 2018 to 2033 Table 34: Asia Pacific Market Volume (Units) Forecast by Country, 2018 to 2033 Table 35: Asia Pacific Market Value (US$ Million) Forecast by Cavity Type, 2018 to 2033 Table 36: Asia Pacific Market Volume (Units) Forecast by Cavity Type, 2018 to 2033 Table 37: Asia Pacific Market Value (US$ Million) Forecast by Material, 2018 to 2033 Table 38: Asia Pacific Market Volume (Units) Forecast by Material, 2018 to 2033 Table 39: Asia Pacific Market Value (US$ Million) Forecast by End Use, 2018 to 2033 Table 40: Asia Pacific Market Volume (Units) Forecast by End Use, 2018 to 2033 Table 41: MEA Market Value (US$ Million) Forecast by Country, 2018 to 2033 Table 42: MEA Market Volume (Units) Forecast by Country, 2018 to 2033 Table 43: MEA Market Value (US$ Million) Forecast by Cavity Type, 2018 to 2033 Table 44: MEA Market Volume (Units) Forecast by Cavity Type, 2018 to 2033 Table 45: MEA Market Value (US$ Million) Forecast by Material, 2018 to 2033 Table 46: MEA Market Volume (Units) Forecast by Material, 2018 to 2033 Table 47: MEA Market Value (US$ Million) Forecast by End Use, 2018 to 2033 Table 48: MEA Market Volume (Units) Forecast by End Use, 2018 to 2033
Find your sweet spots for generating winning opportunities in this market.
Talk to AnalystList of Charts
Figure 1: Global Market Value (US$ Million) by Cavity Type, 2023 to 2033 Figure 2: Global Market Value (US$ Million) by Material, 2023 to 2033 Figure 3: Global Market Value (US$ Million) by End Use, 2023 to 2033 Figure 4: Global Market Value (US$ Million) by Region, 2023 to 2033 Figure 5: Global Market Value (US$ Million) Analysis by Region, 2018 to 2033 Figure 6: Global Market Volume (Units) Analysis by Region, 2018 to 2033 Figure 7: Global Market Value Share (%) and BPS Analysis by Region, 2023 to 2033 Figure 8: Global Market Y-o-Y Growth (%) Projections by Region, 2023 to 2033 Figure 9: Global Market Value (US$ Million) Analysis by Cavity Type, 2018 to 2033 Figure 10: Global Market Volume (Units) Analysis by Cavity Type, 2018 to 2033 Figure 11: Global Market Value Share (%) and BPS Analysis by Cavity Type, 2023 to 2033 Figure 12: Global Market Y-o-Y Growth (%) Projections by Cavity Type, 2023 to 2033 Figure 13: Global Market Value (US$ Million) Analysis by Material, 2018 to 2033 Figure 14: Global Market Volume (Units) Analysis by Material, 2018 to 2033 Figure 15: Global Market Value Share (%) and BPS Analysis by Material, 2023 to 2033 Figure 16: Global Market Y-o-Y Growth (%) Projections by Material, 2023 to 2033 Figure 17: Global Market Value (US$ Million) Analysis by End Use, 2018 to 2033 Figure 18: Global Market Volume (Units) Analysis by End Use, 2018 to 2033 Figure 19: Global Market Value Share (%) and BPS Analysis by End Use, 2023 to 2033 Figure 20: Global Market Y-o-Y Growth (%) Projections by End Use, 2023 to 2033 Figure 21: Global Market Attractiveness by Cavity Type, 2023 to 2033 Figure 22: Global Market Attractiveness by Material, 2023 to 2033 Figure 23: Global Market Attractiveness by End Use, 2023 to 2033 Figure 24: Global Market Attractiveness by Region, 2023 to 2033 Figure 25: North America Market Value (US$ Million) by Cavity Type, 2023 to 2033 Figure 26: North America Market Value (US$ Million) by Material, 2023 to 2033 Figure 27: North America Market Value (US$ Million) by End Use, 2023 to 2033 Figure 28: North America Market Value (US$ Million) by Country, 2023 to 2033 Figure 29: North America Market Value (US$ Million) Analysis by Country, 2018 to 2033 Figure 30: North America Market Volume (Units) Analysis by Country, 2018 to 2033 Figure 31: North America Market Value Share (%) and BPS Analysis by Country, 2023 to 2033 Figure 32: North America Market Y-o-Y Growth (%) Projections by Country, 2023 to 2033 Figure 33: North America Market Value (US$ Million) Analysis by Cavity Type, 2018 to 2033 Figure 34: North America Market Volume (Units) Analysis by Cavity Type, 2018 to 2033 Figure 35: North America Market Value Share (%) and BPS Analysis by Cavity Type, 2023 to 2033 Figure 36: North America Market Y-o-Y Growth (%) Projections by Cavity Type, 2023 to 2033 Figure 37: North America Market Value (US$ Million) Analysis by Material, 2018 to 2033 Figure 38: North America Market Volume (Units) Analysis by Material, 2018 to 2033 Figure 39: North America Market Value Share (%) and BPS Analysis by Material, 2023 to 2033 Figure 40: North America Market Y-o-Y Growth (%) Projections by Material, 2023 to 2033 Figure 41: North America Market Value (US$ Million) Analysis by End Use, 2018 to 2033 Figure 42: North America Market Volume (Units) Analysis by End Use, 2018 to 2033 Figure 43: North America Market Value Share (%) and BPS Analysis by End Use, 2023 to 2033 Figure 44: North America Market Y-o-Y Growth (%) Projections by End Use, 2023 to 2033 Figure 45: North America Market Attractiveness by Cavity Type, 2023 to 2033 Figure 46: North America Market Attractiveness by Material, 2023 to 2033 Figure 47: North America Market Attractiveness by End Use, 2023 to 2033 Figure 48: North America Market Attractiveness by Country, 2023 to 2033 Figure 49: Latin America Market Value (US$ Million) by Cavity Type, 2023 to 2033 Figure 50: Latin America Market Value (US$ Million) by Material, 2023 to 2033 Figure 51: Latin America Market Value (US$ Million) by End Use, 2023 to 2033 Figure 52: Latin America Market Value (US$ Million) by Country, 2023 to 2033 Figure 53: Latin America Market Value (US$ Million) Analysis by Country, 2018 to 2033 Figure 54: Latin America Market Volume (Units) Analysis by Country, 2018 to 2033 Figure 55: Latin America Market Value Share (%) and BPS Analysis by Country, 2023 to 2033 Figure 56: Latin America Market Y-o-Y Growth (%) Projections by Country, 2023 to 2033 Figure 57: Latin America Market Value (US$ Million) Analysis by Cavity Type, 2018 to 2033 Figure 58: Latin America Market Volume (Units) Analysis by Cavity Type, 2018 to 2033 Figure 59: Latin America Market Value Share (%) and BPS Analysis by Cavity Type, 2023 to 2033 Figure 60: Latin America Market Y-o-Y Growth (%) Projections by Cavity Type, 2023 to 2033 Figure 61: Latin America Market Value (US$ Million) Analysis by Material, 2018 to 2033 Figure 62: Latin America Market Volume (Units) Analysis by Material, 2018 to 2033 Figure 63: Latin America Market Value Share (%) and BPS Analysis by Material, 2023 to 2033 Figure 64: Latin America Market Y-o-Y Growth (%) Projections by Material, 2023 to 2033 Figure 65: Latin America Market Value (US$ Million) Analysis by End Use, 2018 to 2033 Figure 66: Latin America Market Volume (Units) Analysis by End Use, 2018 to 2033 Figure 67: Latin America Market Value Share (%) and BPS Analysis by End Use, 2023 to 2033 Figure 68: Latin America Market Y-o-Y Growth (%) Projections by End Use, 2023 to 2033 Figure 69: Latin America Market Attractiveness by Cavity Type, 2023 to 2033 Figure 70: Latin America Market Attractiveness by Material, 2023 to 2033 Figure 71: Latin America Market Attractiveness by End Use, 2023 to 2033 Figure 72: Latin America Market Attractiveness by Country, 2023 to 2033 Figure 73: Europe Market Value (US$ Million) by Cavity Type, 2023 to 2033 Figure 74: Europe Market Value (US$ Million) by Material, 2023 to 2033 Figure 75: Europe Market Value (US$ Million) by End Use, 2023 to 2033 Figure 76: Europe Market Value (US$ Million) by Country, 2023 to 2033 Figure 77: Europe Market Value (US$ Million) Analysis by Country, 2018 to 2033 Figure 78: Europe Market Volume (Units) Analysis by Country, 2018 to 2033 Figure 79: Europe Market Value Share (%) and BPS Analysis by Country, 2023 to 2033 Figure 80: Europe Market Y-o-Y Growth (%) Projections by Country, 2023 to 2033 Figure 81: Europe Market Value (US$ Million) Analysis by Cavity Type, 2018 to 2033 Figure 82: Europe Market Volume (Units) Analysis by Cavity Type, 2018 to 2033 Figure 83: Europe Market Value Share (%) and BPS Analysis by Cavity Type, 2023 to 2033 Figure 84: Europe Market Y-o-Y Growth (%) Projections by Cavity Type, 2023 to 2033 Figure 85: Europe Market Value (US$ Million) Analysis by Material, 2018 to 2033 Figure 86: Europe Market Volume (Units) Analysis by Material, 2018 to 2033 Figure 87: Europe Market Value Share (%) and BPS Analysis by Material, 2023 to 2033 Figure 88: Europe Market Y-o-Y Growth (%) Projections by Material, 2023 to 2033 Figure 89: Europe Market Value (US$ Million) Analysis by End Use, 2018 to 2033 Figure 90: Europe Market Volume (Units) Analysis by End Use, 2018 to 2033 Figure 91: Europe Market Value Share (%) and BPS Analysis by End Use, 2023 to 2033 Figure 92: Europe Market Y-o-Y Growth (%) Projections by End Use, 2023 to 2033 Figure 93: Europe Market Attractiveness by Cavity Type, 2023 to 2033 Figure 94: Europe Market Attractiveness by Material, 2023 to 2033 Figure 95: Europe Market Attractiveness by End Use, 2023 to 2033 Figure 96: Europe Market Attractiveness by Country, 2023 to 2033 Figure 97: Asia Pacific Market Value (US$ Million) by Cavity Type, 2023 to 2033 Figure 98: Asia Pacific Market Value (US$ Million) by Material, 2023 to 2033 Figure 99: Asia Pacific Market Value (US$ Million) by End Use, 2023 to 2033 Figure 100: Asia Pacific Market Value (US$ Million) by Country, 2023 to 2033 Figure 101: Asia Pacific Market Value (US$ Million) Analysis by Country, 2018 to 2033 Figure 102: Asia Pacific Market Volume (Units) Analysis by Country, 2018 to 2033 Figure 103: Asia Pacific Market Value Share (%) and BPS Analysis by Country, 2023 to 2033 Figure 104: Asia Pacific Market Y-o-Y Growth (%) Projections by Country, 2023 to 2033 Figure 105: Asia Pacific Market Value (US$ Million) Analysis by Cavity Type, 2018 to 2033 Figure 106: Asia Pacific Market Volume (Units) Analysis by Cavity Type, 2018 to 2033 Figure 107: Asia Pacific Market Value Share (%) and BPS Analysis by Cavity Type, 2023 to 2033 Figure 108: Asia Pacific Market Y-o-Y Growth (%) Projections by Cavity Type, 2023 to 2033 Figure 109: Asia Pacific Market Value (US$ Million) Analysis by Material, 2018 to 2033 Figure 110: Asia Pacific Market Volume (Units) Analysis by Material, 2018 to 2033 Figure 111: Asia Pacific Market Value Share (%) and BPS Analysis by Material, 2023 to 2033 Figure 112: Asia Pacific Market Y-o-Y Growth (%) Projections by Material, 2023 to 2033 Figure 113: Asia Pacific Market Value (US$ Million) Analysis by End Use, 2018 to 2033 Figure 114: Asia Pacific Market Volume (Units) Analysis by End Use, 2018 to 2033 Figure 115: Asia Pacific Market Value Share (%) and BPS Analysis by End Use, 2023 to 2033 Figure 116: Asia Pacific Market Y-o-Y Growth (%) Projections by End Use, 2023 to 2033 Figure 117: Asia Pacific Market Attractiveness by Cavity Type, 2023 to 2033 Figure 118: Asia Pacific Market Attractiveness by Material, 2023 to 2033 Figure 119: Asia Pacific Market Attractiveness by End Use, 2023 to 2033 Figure 120: Asia Pacific Market Attractiveness by Country, 2023 to 2033 Figure 121: MEA Market Value (US$ Million) by Cavity Type, 2023 to 2033 Figure 122: MEA Market Value (US$ Million) by Material, 2023 to 2033 Figure 123: MEA Market Value (US$ Million) by End Use, 2023 to 2033 Figure 124: MEA Market Value (US$ Million) by Country, 2023 to 2033 Figure 125: MEA Market Value (US$ Million) Analysis by Country, 2018 to 2033 Figure 126: MEA Market Volume (Units) Analysis by Country, 2018 to 2033 Figure 127: MEA Market Value Share (%) and BPS Analysis by Country, 2023 to 2033 Figure 128: MEA Market Y-o-Y Growth (%) Projections by Country, 2023 to 2033 Figure 129: MEA Market Value (US$ Million) Analysis by Cavity Type, 2018 to 2033 Figure 130: MEA Market Volume (Units) Analysis by Cavity Type, 2018 to 2033 Figure 131: MEA Market Value Share (%) and BPS Analysis by Cavity Type, 2023 to 2033 Figure 132: MEA Market Y-o-Y Growth (%) Projections by Cavity Type, 2023 to 2033 Figure 133: MEA Market Value (US$ Million) Analysis by Material, 2018 to 2033 Figure 134: MEA Market Volume (Units) Analysis by Material, 2018 to 2033 Figure 135: MEA Market Value Share (%) and BPS Analysis by Material, 2023 to 2033 Figure 136: MEA Market Y-o-Y Growth (%) Projections by Material, 2023 to 2033 Figure 137: MEA Market Value (US$ Million) Analysis by End Use, 2018 to 2033 Figure 138: MEA Market Volume (Units) Analysis by End Use, 2018 to 2033 Figure 139: MEA Market Value Share (%) and BPS Analysis by End Use, 2023 to 2033 Figure 140: MEA Market Y-o-Y Growth (%) Projections by End Use, 2023 to 2033 Figure 141: MEA Market Attractiveness by Cavity Type, 2023 to 2033 Figure 142: MEA Market Attractiveness by Material, 2023 to 2033 Figure 143: MEA Market Attractiveness by End Use, 2023 to 2033 Figure 144: MEA Market Attractiveness by Country, 2023 to 2033
Need specific information?
Request CustomizationExplore Packaging Insights
View Reports