Shelf Display Trays Market Size, Share, and Forecast Outlook 2025 to 2035

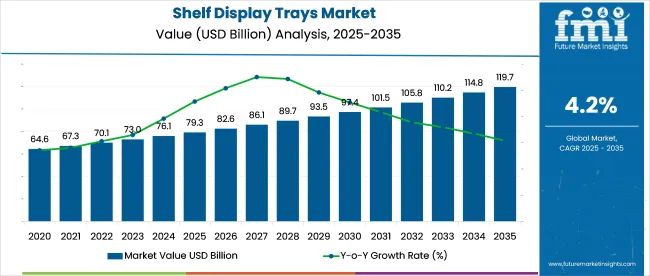
In 2025, the global shelf display trays market is valued at USD 79.3 billion and is projected to reach USD 119.7 billion by 2035 at a CAGR of 4.2%. Early growth through 2027 is driven by consistent demand from supermarket and hypermarket formats, with the market forecast to reach USD 86.0 billion.
Quick Stats of Shelf Display Trays Market

  • Market Value (2025): USD 79.3 billion
  • Forecast Value (2035): USD 119.7 billion
  • Forecast CAGR: 4.2%
  • Material Leader in 2025: Cardboard (57.6% market share)
  • Top End Use: Food & Beverage (48.9% share)
  • Key Growth Country: USA is the fastest-growing market with 4.5% CAGR
  • Leading Player: HL Display AB holds 23 % industry share

Shelf Display Trays Market Market Value Analysis

Metric Value
Market Size in 2025 USD 79.3 billion
Projected Market Size in 2035 USD 119.7 billion
CAGR (2025 to 2035) 4.2%

From 2028 to 2032, increased adoption across food, beverage, and personal care segments supports growth. The use of die-cut corrugated trays and high-resolution folding cartons gains traction, pushing the market to USD 104.3 billion by 2032.

Between 2033 and 2035, the market emphasizes recyclable substrates and molded fiber solutions, aligning with packaging circularity and sustainability targets. By 2035, the market closes at USD 119.7 billion, with annual growth rates holding steady between 4.1% and 4.3%. Growth is reinforced by automated manufacturing, retail mandates for green packaging, and innovations in flat-pack tray formats and digitally printed short-run solutions.

The shelf display trays market holds a niche but growing share within its parent markets. In the retail packaging market, it accounts for roughly 5-8%, driven by the need for organized and visually appealing product displays. Within the point-of-purchase (POP) display market, its share is around 10-15%, as brands increasingly use trays for in-store promotions.

In the food and beverage packaging market, shelf display trays make up 6-10%, given their use in fresh produce, snacks, and ready-to-eat meals. The plastics and materials manufacturing market allocates 3-5% to these trays, as they compete with other packaging solutions.

In e-commerce and logistics packaging, their share is 4-7%, as retailers adopt them for omnichannel retail strategies. Growth is supported by ecofriendly trends, with a shift toward recyclable and biodegradable materials, driving a projected 5-7% CAGR over the coming years.

Jan Blankiewicz, product innovation manager at Mondi Corrugated Solutions, highlights the practical value of small portion packs in improving both hygiene and convenience. He explains that these packs allow consumers to pick up fresh produce directly from the shelf without handling, reducing the risk of contamination.

They simplify the shopping process by removing the need for scales or additional sachets. The packaging also protects fragile items such as tomatoes during transport. This format supports current retail preferences for safer, more efficient packaging solutions while helping preserve product integrity from store to home.

Analyzing Shelf Display Trays Market by Top Investment Segment

The shelf display trays market continues to gain traction across multi-format retail and point-of-sale merchandising. Over 55% of total units are produced using cost-efficient cardboard, while stackable tray formats are in high demand among warehouse clubs and modern retail chains.
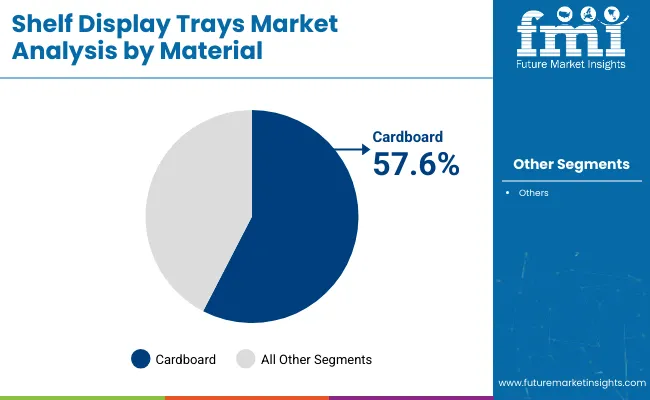
Cardboard Trays Dominate Shelf Display with 57.6% Share in 2025

Shelf Display Trays Market Analysis By Material

Cardboard trays are forecasted to lead the global market with a commanding 57.6% share in 2025. Their lightweight, foldable design and print adaptability make them highly suitable for FMCG and promotional retail use. Producers like DS Smith, International Paper, and Georgia-Pacific are expanding corrugated tray production for regional and global distribution. E-commerce spillover into physical retail has led brands to demand shelf-ready formats that combine structural integrity with visual branding.
  • DS Smith reports over 60% of retail packaging contracts in Europe now include corrugated tray requirements.
  • International Paper offers rapid prototyping for custom die-cut cardboard trays tailored for high-SKU categories.
  • Retailers reduce inventory holding costs by using cardboard trays for seasonal promotional rotations.

Food & Beverage Applications to Capture 48.9% Market Share

Shelf Display Trays Market Analysis By End Use

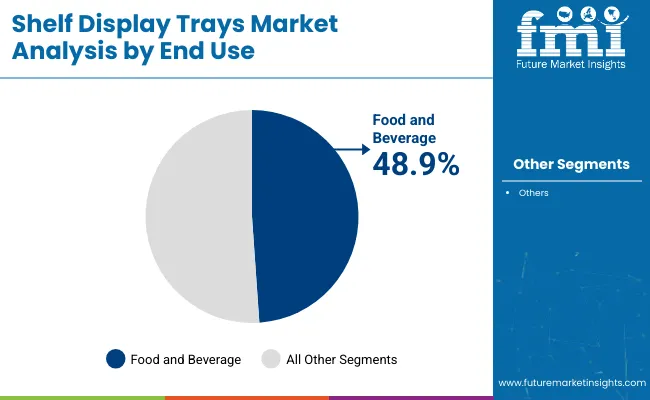
Food & beverage remains the largest consumer of shelf display trays, accounting for 48.9% of demand in 2025. The growth is tied to high rotation categories such as snacks, confectionery, RTD beverages, and dairy. Companies including Coca-Cola, Ferrero, and Danone use display trays for in-store promotion and bulk merchandising. Modern trade and convenience retail formats push demand for multipack display units that maximize shelf presence and SKU visibility.
  • Coca-Cola deploys stackable PET trays in C-store chains to support high turnover of 330ml can multipacks.
  • Ferrero integrates cardboard display trays into dual-purpose transit and seasonal POS applications.
  • Danone uses slanted corrugated trays to display yogurt packs for refrigeration-friendly units.

Stackable Designs to Command 34.2% of Market Share by 2025

Shelf Display Trays Market Analysis By Design

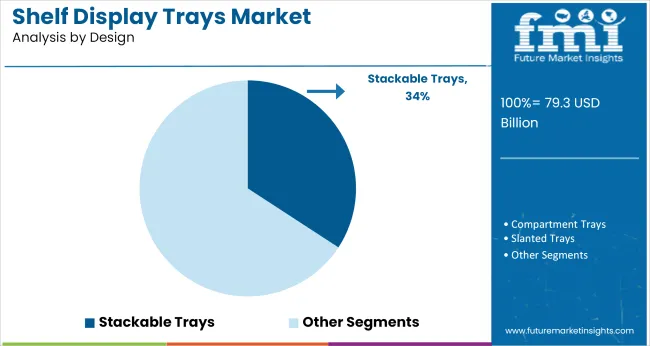
Stackable tray designs are projected to lead the format category with 34.2% market share. Their appeal lies in efficient vertical space usage and structural interlock during transport and shelf-stocking. Popular in beverages, snacks, and homecare, stackable trays are being adopted across cash-and-carry formats and high-volume discounters. Manufacturers like Mondi, FP International, and Sonoco focus on ergonomic stackable formats with modular load-bearing capability.
  • Mondi’s nested stackable trays allow 22% more product volume per pallet in beverage logistics.
  • FP International serves bulk retail brands with HDPE stackable trays tailored for laundry and cleaning items.
  • Sonoco’s stackable SKUs are designed for automated shelf-loading in Tier 1 supermarket chains.

12-18 Inch Size Segment to Account for 41.3% in 2025

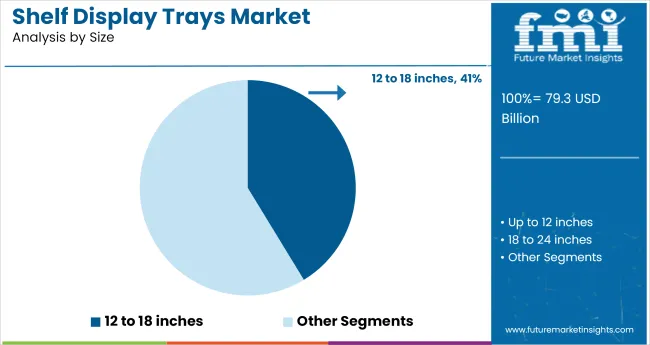
Shelf Display Trays Market Analysis By Size

Trays sized 12 to 18 inches are projected to hold 41.3% market share, offering optimal space utility and merchandising flexibility. They support moderate product weight and are compatible with shelf depths in grocery, pharmacy, and cosmetic retail formats. Brands like L’Oréal, Kraft Heinz, and Revlon select this size for retail units needing strong facings without overloading shelf real estate. The size range aligns with retail compliance for both gondola and end-cap placement.

  • L’Oréal utilizes 14-inch compartment trays to segment cosmetics by shade and function.
  • Kraft Heinz uses 16-inch trays for cross-promotional packs such as ketchup-mayo bundles.
  • Revlon’s seasonal offers are distributed using 12-15 inch trays to fit pharmacy shelf fixtures.

Top Shelf Display Trays Market Dynamics

Shelf display trays are seeing broader use as retailer’s streamline shelf replenishment and enhance product visibility. Branded variants are gaining ground in discount and wholesale formats. Brands are adapting tray designs to comply with recyclability thresholds, while labor-reduction metrics continue to influence tray selection across large-format retail and grocery outlets.

Retail Format Shifts Drive Tray Integration in High-Turn Categories

Adoption of shelf display trays rose by 11.2% year-on-year across structured retail channels in the first half of 2025, led by discount and bulk-sale formats. High-rotation SKUs in beverages, personal care, and snack foods are increasingly shipped in shelf-ready formats, reducing in-store restocking times by 27-31%.

Retail operations data from the United Kingdom showed labor savings of 19 million British pounds in the second quarter alone through the expanded use of tray-enabled packaging in dry goods categories. In North America, over 68% of new FMCG product placements in hypermarkets now launch with corrugated shelf trays, aligning with planogram efficiency benchmarks and standardized shelving dimensions. Multi-pack configurations placed in branded die-cut trays are helping accelerate throughput at aisle ends and promotional displays.

Material Transition and Merchandising Function Shape Tray Evolution

Retail packaging policies and circularity targets are prompting a shift away from laminated plastic and mixed-material trays. As of mid to 2025, 54% of shelf display trays used across Western Europe met recognized recyclability benchmarks under EN 13430. Large converters reported a 17% uptick in tray demand incorporating more than 80% post-consumer recycled content.

Major European retailers have introduced new onboarding requirements mandating tray size compatibility with racking systems and pallet schemes. In Germany and the Nordic markets, own-brand SKUs accounted for more than one-third of tray-based merchandising campaigns in Q2, reflecting expanded use of shelf trays for visual blocking and private-label amplification.

Tray redesign cycles have been compressed to 45-60 days for seasonal rotations, aided by modular structural templates and faster turnaround in flexographic printing workflows.
Top Countries Manufacturing, Adopting, and Supplying Shelf Display Trays Across Retail and Consumer Channels

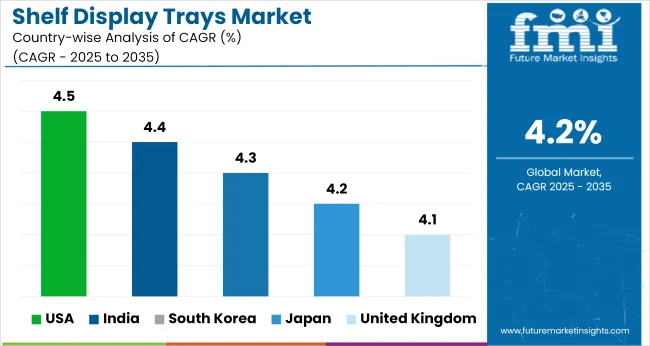
Shelf Display Trays Market Cagr Analysis By Country

Country CAGR (2025 to 2035)
USA 4.5
India 4.4
South Korea 4.3
Japan 4.2
United Kingdom 4.1

The global shelf display trays market is projected to expand at a CAGR of 4.2% between 2025 and 2035. The United States (OECD) leads among the profiled countries with 4.5%, placing it 0.3 percentage points above the global baseline. India (BRICS) follows at 4.4% (+0.2%), while South Korea (OECD) records 4.3% (+0.1%) and Japan (OECD) matches the global average at 4.2%.

The United Kingdom (OECD) trails slightly with 4.1% (-0.1%). This variation reflects regional approaches to in-store visual merchandising, packaging integration in point-of-sale systems, and investments in modular retail infrastructure. BRICS and OECD markets both contribute to steady growth, though growth in BRICS economies is linked more to expansion in organized retail formats, while OECD markets show incremental gains from display redesign and marketing convergence.

The report covers detailed analysis of 40+ countries, with the top five countries shared as a reference.
Performance Analysis of Shelf Display Trays Market in the United States

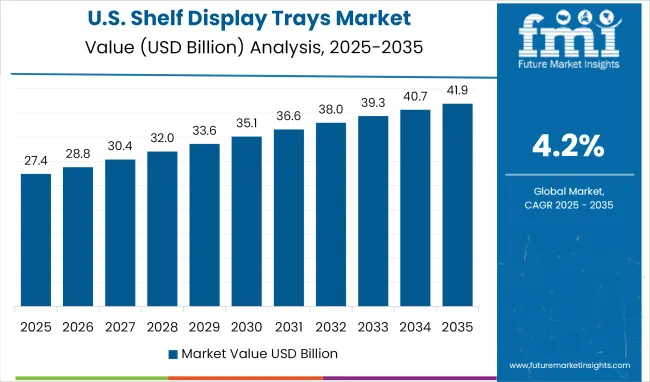
Shelf Display Trays Market Country Value Analysis

Between 2020 and 2024, shelf display trays gained wide acceptance in high-turnover retail formats such as club stores, dollar chains, and supermarkets. Growth was supported by rising SKU fragmentation and shelf-ready packaging adoption.

The market is forecast to grow at a CAGR of 4.5% through 2035, driven by automation in warehouse-to-shelf replenishment and growing demand for recyclable corrugated trays. Retailers are adopting display trays with high-graphic print and integrated merchandising features to drive impulse purchases. Seasonal product rotations in FMCG and pet food aisles are also boosting tray demand with shorter life cycles and modular designs.

  • Over 58% of new product launches in USA grocery used shelf-ready formats by 2024
  • Corrugated tray formats with die-cut branding rose 22% in use between 2020 and 2024
  • Over 65% of big-box retailers are shifting to automated tray-based shelf replenishment

Growth Assessment of Shelf Display Trays Market in the United Kingdom

The UK market grew steadily between 2020 and 2024, with retailers adopting shelf display trays to streamline restocking and reduce secondary packaging waste. Display trays became standard in supermarket bakery, beverages, and confectionery aisles. The market is projected to expand at a CAGR of 4.1% through 2035, driven by sustainability mandates and growth of private label offerings.

Retailers are demanding mono-material, easy-tear trays compatible with in-store logistics. E-commerce grocery and click-and-collect formats are also contributing to demand for hybrid shelf-display systems that double as shipping cartons.

  • 43% of FMCG brands in the UK adopted 100% recyclable shelf trays by 2024
  • Mono-material board formats grew 16% CAGR during 2020 to 2024
  • Click-and-collect retail contributed 19% of shelf tray demand in 2023

Shelf Display Trays Market Trends in Japan

The shelf displays trays industry in Japan expanded during 2020 to 2024 due to rising urban retail density and convenience store restocking frequency. Compact, high-visibility trays became integral in ready-to-eat, beauty, and functional beverage categories.

Through 2035, the market is expected to grow at a CAGR of 4.2%, driven by labor-saving logistics and demand for presentation-ready packaging. Manufacturers are investing in RFID-embedded trays and foldable PET tray structures to support reusability goals. Trays designed for space-efficient vertical displays are increasingly used in metro and suburban retail environments.

  • 51% of shelf trays used in food retail are now collapsible or fold-flat formats
  • RFID-enabled display trays grew 24% CAGR from 2021 to 2024 in drugstores
  • Labor optimization in convenience retail is driving demand for prefilled display trays

Market Dynamics of Shelf Display Trays in South Korea

South Korea’s market expanded at a steady rate during 2020 to 2024, supported by the rise of modern retail formats, especially in beauty and beverage categories. Through 2035, shelf display trays are projected to grow at a CAGR of 4.3%, driven by demand for space-efficient displays, integrated QR-code marketing, and recyclable substrates.

Premium tray formats with UV printing and high stiffness are increasingly adopted in lifestyle and tech retail. Rapid inventory turnover in K-beauty and health product segments is reshaping structural requirements for modular, retail-ready trays.

  • In 2024, over 40% of personal care SKUs were shipped in QR-coded retail display trays
  • Rigid board tray demand in beverage rose 18% CAGR from 2020 to 2024
  • E-commerce pickup points now account for 14% of shelf tray distribution in Korea

Forecast Overview of Shelf Display Trays Market in India

The shelf displays trays industry in India is projected to grow at a CAGR of 4.4% through 2035. During 2020 to 2024, growth was driven by rapid penetration of organized retail and urban supermarket chains. Corrugated shelf trays gained traction across dairy, snacks, and OTC pharmaceuticals.

Looking ahead, expanding Tier 2 and Tier 3 retail, as well as the boom in modern grocery formats, will boost demand for low-cost, print-ready trays. Brands are adopting ready-to-sell tray formats to minimize in-store labor and enhance brand visibility. Flexo-printed and die-punched trays are becoming more common in regional distribution networks.
  • Organised retail accounted for 37% of total shelf tray demand in 2024
  • Snack and impulse food brands used shelf display trays in over 50% of rollouts
  • Flexo-printed corrugated trays grew at 21% CAGR in urban supermarkets (2020 to 2024)

Leading Shelf Display Tray Manufacturers

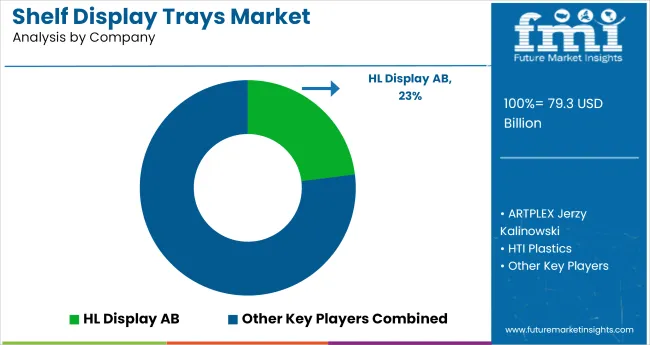
Shelf Display Trays Market Analysis By Company

The shelf display tray market is dominated by key players like ANL Packaging, VPK Group, and Macpac Ltd., who invest in R&D and product launches to maintain competitiveness. For example, HL Display AB introduced modular tray systems for retail efficiency, while LINPAC Packaging developed lightweight yet durable designs.

Emerging players like Indigo Prints Private Limited and Bennett Packaging focus on customization and regional distribution to carve out niches. Larger firms such as Delkor Systems and HTI Plastics leverage automation and economies of scale, while smaller competitors like ARTPLEX Jerzy Kalinowski differentiate through bespoke solutions.

High entry barriers include substantial capital requirements for manufacturing equipment and compliance with industry standards. Established brands benefit from long-term retail contracts, making market penetration difficult for newcomers. Intellectual property protections further restrict competition, though regional manufacturers like Indigo Prints gain footholds with cost-effective alternatives. Dominant players control pricing, forcing smaller firms to rely on innovation or localized strategies.

Recent Industry News

  • June 24, 2024 - Sonoco acquires Eviosys for USA USD 3.9 billion
  • Sonoco expanded its packaging portfolio by acquiring Eviosys, enhancing its position in food and display tray solutions across Europe. The deal adds advanced forming and lidding systems, supporting retail-ready packaging for shelf display applications.
  • November 19, 2024 - Amcor merges with Berry Global in USA USD 8.4 billion deal
  • The merger forms one of the largest global packaging entities, consolidating production lines and expanding capabilities in corrugated and molded display trays for retail environments. The combined entity aims to optimize tray customization and in-store handling efficiency.

Leading Players

  • ANL Packaging
  • VPK Group
  • Macpac Ltd.
  • Bennett Packaging
  • Indigo Prints Private Limited
  • HL Display AB
  • ARTPLEX Jerzy Kalinowski
  • HTI Plastics
  • LINPAC Packaging
  • Delkor Systems, Inc

Report Scope of Shelf Display Trays Market

Report Attributes Details
Market Size (2025) USD 79.3 billion
Projected Market Size (2035) USD 119.7 billion
CAGR (2025 to 2035) 4.2%
Base Year 2024
Historical Data Range 2020 to 2024
Forecast Period 2025 to 2035
Quantitative Units USD billion (revenue), million units (volume)
Material Segmentation Plastic, Cardboard, Metal, Others (Wood, Glass)
Size Segmentation Up to 12 inches, 12 to 18 inches, 18 to 24 inches, Above 24 inches
Design Segmentation Flat Trays, Compartment Trays, Slanted Trays, Stackable Trays
End Use Segmentation Food & Beverage, Cosmetics & Personal Care, Electronics & Appliances, Retail
Regional Coverage North America, Latin America, Europe, East Asia, South Asia, Oceania, Middle East and Africa
Countries Tracked United States, Canada, Germany, United Kingdom, France, China, Japan, India, Brazil, Australia, GCC countries
Key Companies Profiled ANL Packaging, VPK Group, Macpac Ltd., Bennett Packaging, Indigo Prints Private Limited, HL Display AB, ARTPLEX Jerzy Kalinowski, HTI Plastics, LINPAC Packaging, Delkor Systems, Inc
Additional Attributes Dollar sales, share by tray size and end-use sector, preference for stackable and slanted formats in retail merchandising, growth in shelf-ready packaging adoption, influence of automated warehousing and retail display upgrades

Key Segments

By Material:

  • Plastic
  • Cardboard
  • Metal
  • Others (Wood, Glass)

By Size:

  • Up to 12 inches
  • 12 to 18 inches
  • 18 to 24 inches
  • Above 24 inches

By Design:

  • Flat Trays
  • Compartment Trays
  • Slanted Trays
  • Stackable Trays

By End Use:

  • Food & Beverage
  • Cosmetics & Personal Care
  • Electronics & Appliances
  • Retail

By Region:

  • North America
  • Latin America
  • Europe
  • East Asia
  • South Asia
  • Oceania
  • MEA

Table of Content

  1. Executive Summary
    • Global Market Outlook
    • Demand-side Trends
    • Supply-side Trends
    • Technology Roadmap Analysis
    • Analysis and Recommendations
  2. Market Overview
    • Market Coverage / Taxonomy
    • Market Definition / Scope / Limitations
  3. Market Background
    • Market Dynamics
      • Drivers
      • Restraints
      • Opportunity
      • Trends
    • Scenario Forecast
      • Demand in Optimistic Scenario
      • Demand in Likely Scenario
      • Demand in Conservative Scenario
    • Opportunity Map Analysis
    • Product Life Cycle Analysis
    • Supply Chain Analysis
      • Supply Side Participants and their Roles
        • Producers
        • Mid-Level Participants (Traders/ Agents/ Brokers)
        • Wholesalers and Distributors
      • Value Added and Value Created at Node in the Supply Chain
      • List of Raw Material Suppliers
      • List of Existing and Potential Buyer’s
    • Investment Feasibility Matrix
    • Value Chain Analysis
      • Profit Margin Analysis
      • Wholesalers and Distributors
      • Retailers
    • PESTLE and Porter’s Analysis
    • Regulatory Landscape
      • By Key Regions
      • By Key Countries
    • Regional Parent Market Outlook
    • Production and Consumption Statistics
    • Import and Export Statistics
  4. Global Market Analysis 2020 to 2024 and Forecast, 2025 to 2035
    • Historical Market Size Value (USD Billion) & Volume (Thousand Units) Analysis, 2020 to 2024
    • Current and Future Market Size Value (USD Billion) & Volume (Thousand Units) Projections, 2025 to 2035
      • Y-o-Y Growth Trend Analysis
      • Absolute $ Opportunity Analysis
  5. Global Market Pricing Analysis 2020 to 2024 and Forecast 2025 to 2035
  6. Global Market Analysis 2020 to 2024 and Forecast 2025 to 2035, By Material
    • Introduction / Key Findings
    • Historical Market Size Value (USD Billion) & Volume (Thousand Units) Analysis By Material, 2020 to 2024
    • Current and Future Market Size Value (USD Billion) & Volume (Thousand Units) Analysis and Forecast By Material, 2025 to 2035
      • Plastic
      • Cardboard
      • Metal
      • Others (Wood, Glass)
    • Y-o-Y Growth Trend Analysis By Material, 2020 to 2024
    • Absolute $ Opportunity Analysis By Material, 2025 to 2035
  7. Global Market Analysis 2020 to 2024 and Forecast 2025 to 2035, By Size
    • Introduction / Key Findings
    • Historical Market Size Value (USD Billion) & Volume (Thousand Units) Analysis By Size, 2020 to 2024
    • Current and Future Market Size Value (USD Billion) & Volume (Thousand Units) Analysis and Forecast By Size, 2025 to 2035
      • Up to 12 inches
      • 12 to 18 inches
      • 18 to 24 inches
      • Above 24 inches
    • Y-o-Y Growth Trend Analysis By Size, 2020 to 2024
    • Absolute $ Opportunity Analysis By Size, 2025 to 2035
  8. Global Market Analysis 2020 to 2024 and Forecast 2025 to 2035, By Design
    • Introduction / Key Findings
    • Historical Market Size Value (USD Billion) & Volume (Thousand Units) Analysis By Design, 2020 to 2024
    • Current and Future Market Size Value (USD Billion) & Volume (Thousand Units) Analysis and Forecast By Design, 2025 to 2035
      • Flat Trays
      • Compartment Trays
      • Slanted Trays
      • Stackable Trays
    • Y-o-Y Growth Trend Analysis By Design, 2020 to 2024
    • Absolute $ Opportunity Analysis By Design, 2025 to 2035
  9. Global Market Analysis 2020 to 2024 and Forecast 2025 to 2035, By End Use
    • Introduction / Key Findings
    • Historical Market Size Value (USD Billion) & Volume (Thousand Units) Analysis By End Use, 2020 to 2024
    • Current and Future Market Size Value (USD Billion) & Volume (Thousand Units) Analysis and Forecast By End Use, 2025 to 2035
      • Food & Beverage
      • Cosmetics & Personal Care
      • Electronics & Appliances
      • Retail
    • Y-o-Y Growth Trend Analysis By End Use, 2020 to 2024
    • Absolute $ Opportunity Analysis By End Use, 2025 to 2035
  10. Global Market Analysis 2020 to 2024 and Forecast 2025 to 2035, By Region
    • Introduction
    • Historical Market Size Value (USD Billion) & Volume (Thousand Units) Analysis By Region, 2020 to 2024
    • Current Market Size Value (USD Billion) & Volume (Thousand Units) Analysis and Forecast By Region, 2025 to 2035
      • North America
      • Latin America
      • Western Europe
      • Eastern Europe
      • East Asia
      • South Asia & Pacific
      • Middle East and Africa
    • Market Attractiveness Analysis By Region
  11. North America Market Analysis 2020 to 2024 and Forecast 2025 to 2035, By Country
    • Historical Market Size Value (USD Billion) & Volume (Thousand Units) Trend Analysis By Market Taxonomy, 2020 to 2024
    • Market Size Value (USD Billion) & Volume (Thousand Units) Forecast By Market Taxonomy, 2025 to 2035
      • By Country
        • USA
        • Canada
        • Mexico
      • By Material
      • By Size
      • By Design
      • By End Use
    • Market Attractiveness Analysis
      • By Country
      • By Material
      • By Size
      • By Design
      • By End Use
    • Key Takeaways
  12. Latin America Market Analysis 2020 to 2024 and Forecast 2025 to 2035, By Country
    • Historical Market Size Value (USD Billion) & Volume (Thousand Units) Trend Analysis By Market Taxonomy, 2020 to 2024
    • Market Size Value (USD Billion) & Volume (Thousand Units) Forecast By Market Taxonomy, 2025 to 2035
      • By Country
        • Brazil
        • Argentina
        • Rest of LATAM
      • By Material
      • By Size
      • By Design
      • By End Use
    • Market Attractiveness Analysis
      • By Country
      • By Material
      • By Size
      • By Design
      • By End Use
    • Key Takeaways
  13. Western Europe Market Analysis 2020 to 2024 and Forecast 2025 to 2035, By Country
    • Historical Market Size Value (USD Billion) & Volume (Thousand Units) Trend Analysis By Market Taxonomy, 2020 to 2024
    • Market Size Value (USD Billion) & Volume (Thousand Units) Forecast By Market Taxonomy, 2025 to 2035
      • By Country
        • Germany
        • Italy
        • France
        • UK
        • Spain
        • BENELUX
        • Nordic
        • Rest of W.Europe
      • By Material
      • By Size
      • By Design
      • By End Use
    • Market Attractiveness Analysis
      • By Country
      • By Material
      • By Size
      • By Design
      • By End Use
    • Key Takeaways
  14. Eastern Europe Market Analysis 2020 to 2024 and Forecast 2025 to 2035, By Country
    • Historical Market Size Value (USD Billion) & Volume (Thousand Units) Trend Analysis By Market Taxonomy, 2020 to 2024
    • Market Size Value (USD Billion) & Volume (Thousand Units) Forecast By Market Taxonomy, 2025 to 2035
      • By Country
        • Russia
        • Hungary
        • Poland
        • Balkan & Baltics
        • Rest of E. Europe
      • By Material
      • By Size
      • By Design
      • By End Use
    • Market Attractiveness Analysis
      • By Country
      • By Material
      • By Size
      • By Design
      • By End Use
    • Key Takeaways
  15. East Asia Market Analysis 2020 to 2024 and Forecast 2025 to 2035, By Country
    • Historical Market Size Value (USD Billion) & Volume (Thousand Units) Trend Analysis By Market Taxonomy, 2020 to 2024
    • Market Size Value (USD Billion) & Volume (Thousand Units) Forecast By Market Taxonomy, 2025 to 2035
      • By Country
        • China
        • Japan
        • South Korea
      • By Material
      • By Size
      • By Design
      • By End Use
    • Market Attractiveness Analysis
      • By Country
      • By Material
      • By Size
      • By Design
      • By End Use
    • Key Takeaways
  16. South Asia & Pacific Market Analysis 2020 to 2024 and Forecast 2025 to 2035, By Country
    • Historical Market Size Value (USD Billion) & Volume (Thousand Units) Trend Analysis By Market Taxonomy, 2020 to 2024
    • Market Size Value (USD Billion) & Volume (Thousand Units) Forecast By Market Taxonomy, 2025 to 2035
      • By Country
        • India
        • Australia & New Zealand
        • ASEAN
        • Rest of SAP
      • By Material
      • By Size
      • By Design
      • By End Use
    • Market Attractiveness Analysis
      • By Country
      • By Material
      • By Size
      • By Design
      • By End Use
    • Key Takeaways
  17. Middle East and Africa Market Analysis 2020 to 2024 and Forecast 2025 to 2035, By Country
    • Historical Market Size Value (USD Billion) & Volume (Thousand Units) Trend Analysis By Market Taxonomy, 2020 to 2024
    • Market Size Value (USD Billion) & Volume (Thousand Units) Forecast By Market Taxonomy, 2025 to 2035
      • By Country
        • GCC Countries
        • Northern Africa
        • South Africa
        • Turkiye
        • Rest of MEA
      • By Material
      • By Size
      • By Design
      • By End Use
    • Market Attractiveness Analysis
      • By Country
      • By Material
      • By Size
      • By Design
      • By End Use
    • Key Takeaways
  18. Key Countries Market Analysis
    • USA
      • Pricing Analysis
      • Market Share Analysis, 2024
        • By Material
        • By Size
        • By Design
        • By End Use
    • Canada
      • Pricing Analysis
      • Market Share Analysis, 2024
        • By Material
        • By Size
        • By Design
        • By End Use
    • Brazil
      • Pricing Analysis
      • Market Share Analysis, 2024
        • By Material
        • By Size
        • By Design
        • By End Use
    • Mexico
      • Pricing Analysis
      • Market Share Analysis, 2024
        • By Material
        • By Size
        • By Design
        • By End Use
    • Argentina
      • Pricing Analysis
      • Market Share Analysis, 2024
        • By Material
        • By Size
        • By Design
        • By End Use
  19. Market Structure Analysis
    • Competition Dashboard
    • Competition Benchmarking
    • Market Share Analysis of Top Players
      • By Regional
      • By Material
      • By Size
      • By Design
      • By End Use
  20. Competition Analysis
    • Competition Deep Dive
      • ANL Packaging
        • Overview
        • Product Portfolio
        • Profitability by Market Segments (Product/Age /Sales Channel/Region)
        • Sales Footprint
        • Strategy Overview
          • Marketing Strategy
          • Product Strategy
          • Channel Strategy
      • VPK Group
        • Overview
        • Product Portfolio
        • Profitability by Market Segments (Product/Age /Sales Channel/Region)
        • Sales Footprint
        • Strategy Overview
          • Marketing Strategy
          • Product Strategy
          • Channel Strategy
      • Macpac Ltd.
        • Overview
        • Product Portfolio
        • Profitability by Market Segments (Product/Age /Sales Channel/Region)
        • Sales Footprint
        • Strategy Overview
          • Marketing Strategy
          • Product Strategy
          • Channel Strategy
      • Bennett Packaging
        • Overview
        • Product Portfolio
        • Profitability by Market Segments (Product/Age /Sales Channel/Region)
        • Sales Footprint
        • Strategy Overview
          • Marketing Strategy
          • Product Strategy
          • Channel Strategy
      • Indigo Prints Private Limited
        • Overview
        • Product Portfolio
        • Profitability by Market Segments (Product/Age /Sales Channel/Region)
        • Sales Footprint
        • Strategy Overview
          • Marketing Strategy
          • Product Strategy
          • Channel Strategy
      • HL Display AB
        • Overview
        • Product Portfolio
        • Profitability by Market Segments (Product/Age /Sales Channel/Region)
        • Sales Footprint
        • Strategy Overview
          • Marketing Strategy
          • Product Strategy
          • Channel Strategy
      • ARTPLEX Jerzy Kalinowski
        • Overview
        • Product Portfolio
        • Profitability by Market Segments (Product/Age /Sales Channel/Region)
        • Sales Footprint
        • Strategy Overview
          • Marketing Strategy
          • Product Strategy
          • Channel Strategy
      • HTI Plastics
        • Overview
        • Product Portfolio
        • Profitability by Market Segments (Product/Age /Sales Channel/Region)
        • Sales Footprint
        • Strategy Overview
          • Marketing Strategy
          • Product Strategy
          • Channel Strategy
      • LINPAC Packaging
        • Overview
        • Product Portfolio
        • Profitability by Market Segments (Product/Age /Sales Channel/Region)
        • Sales Footprint
        • Strategy Overview
          • Marketing Strategy
          • Product Strategy
          • Channel Strategy
      • Delkor Systems, Inc
        • Overview
        • Product Portfolio
        • Profitability by Market Segments (Product/Age /Sales Channel/Region)
        • Sales Footprint
        • Strategy Overview
          • Marketing Strategy
          • Product Strategy
          • Channel Strategy
  21. Assumptions & Acronyms Used
  22. Research Methodology

List of Tables

  • Table 1: Global Market Value (USD Billion) Forecast by Region, 2020-2035
  • Table 2: Global Market Volume (Thousand Units) Forecast by Region, 2020-2035
  • Table 3: Global Market Value (USD Billion) Forecast by Material, 2020-2035
  • Table 4: Global Market Volume (Thousand Units) Forecast by Material, 2020-2035
  • Table 5: Global Market Value (USD Billion) Forecast by Size, 2020-2035
  • Table 6: Global Market Volume (Thousand Units) Forecast by Size, 2020-2035
  • Table 7: Global Market Value (USD Billion) Forecast by Design, 2020-2035
  • Table 8: Global Market Volume (Thousand Units) Forecast by Design, 2020-2035
  • Table 9: Global Market Value (USD Billion) Forecast by End Use, 2020-2035
  • Table 10: Global Market Volume (Thousand Units) Forecast by End Use, 2020-2035
  • Table 11: North America Market Value (USD Billion) Forecast by Country, 2020-2035
  • Table 12: North America Market Volume (Thousand Units) Forecast by Country, 2020-2035
  • Table 13: North America Market Value (USD Billion) Forecast by Material, 2020-2035
  • Table 14: North America Market Volume (Thousand Units) Forecast by Material, 2020-2035
  • Table 15: North America Market Value (USD Billion) Forecast by Size, 2020-2035
  • Table 16: North America Market Volume (Thousand Units) Forecast by Size, 2020-2035
  • Table 17: North America Market Value (USD Billion) Forecast by Design, 2020-2035
  • Table 18: North America Market Volume (Thousand Units) Forecast by Design, 2020-2035
  • Table 19: North America Market Value (USD Billion) Forecast by End Use, 2020-2035
  • Table 20: North America Market Volume (Thousand Units) Forecast by End Use, 2020-2035
  • Table 21: Latin America Market Value (USD Billion) Forecast by Country, 2020-2035
  • Table 22: Latin America Market Volume (Thousand Units) Forecast by Country, 2020-2035
  • Table 23: Latin America Market Value (USD Billion) Forecast by Material, 2020-2035
  • Table 24: Latin America Market Volume (Thousand Units) Forecast by Material, 2020-2035
  • Table 25: Latin America Market Value (USD Billion) Forecast by Size, 2020-2035
  • Table 26: Latin America Market Volume (Thousand Units) Forecast by Size, 2020-2035
  • Table 27: Latin America Market Value (USD Billion) Forecast by Design, 2020-2035
  • Table 28: Latin America Market Volume (Thousand Units) Forecast by Design, 2020-2035
  • Table 29: Latin America Market Value (USD Billion) Forecast by End Use, 2020-2035
  • Table 30: Latin America Market Volume (Thousand Units) Forecast by End Use, 2020-2035
  • Table 31: Western Europe Market Value (USD Billion) Forecast by Country, 2020-2035
  • Table 32: Western Europe Market Volume (Thousand Units) Forecast by Country, 2020-2035
  • Table 33: Western Europe Market Value (USD Billion) Forecast by Material, 2020-2035
  • Table 34: Western Europe Market Volume (Thousand Units) Forecast by Material, 2020-2035
  • Table 35: Western Europe Market Value (USD Billion) Forecast by Size, 2020-2035
  • Table 36: Western Europe Market Volume (Thousand Units) Forecast by Size, 2020-2035
  • Table 37: Western Europe Market Value (USD Billion) Forecast by Design, 2020-2035
  • Table 38: Western Europe Market Volume (Thousand Units) Forecast by Design, 2020-2035
  • Table 39: Western Europe Market Value (USD Billion) Forecast by End Use, 2020-2035
  • Table 40: Western Europe Market Volume (Thousand Units) Forecast by End Use, 2020-2035
  • Table 41: Eastern Europe Market Value (USD Billion) Forecast by Country, 2020-2035
  • Table 42: Eastern Europe Market Volume (Thousand Units) Forecast by Country, 2020-2035
  • Table 43: Eastern Europe Market Value (USD Billion) Forecast by Material, 2020-2035
  • Table 44: Eastern Europe Market Volume (Thousand Units) Forecast by Material, 2020-2035
  • Table 45: Eastern Europe Market Value (USD Billion) Forecast by Size, 2020-2035
  • Table 46: Eastern Europe Market Volume (Thousand Units) Forecast by Size, 2020-2035
  • Table 47: Eastern Europe Market Value (USD Billion) Forecast by Design, 2020-2035
  • Table 48: Eastern Europe Market Volume (Thousand Units) Forecast by Design, 2020-2035
  • Table 49: Eastern Europe Market Value (USD Billion) Forecast by End Use, 2020-2035
  • Table 50: Eastern Europe Market Volume (Thousand Units) Forecast by End Use, 2020-2035
  • Table 51: East Asia Market Value (USD Billion) Forecast by Country, 2020-2035
  • Table 52: East Asia Market Volume (Thousand Units) Forecast by Country, 2020-2035
  • Table 53: East Asia Market Value (USD Billion) Forecast by Material, 2020-2035
  • Table 54: East Asia Market Volume (Thousand Units) Forecast by Material, 2020-2035
  • Table 55: East Asia Market Value (USD Billion) Forecast by Size, 2020-2035
  • Table 56: East Asia Market Volume (Thousand Units) Forecast by Size, 2020-2035
  • Table 57: East Asia Market Value (USD Billion) Forecast by Design, 2020-2035
  • Table 58: East Asia Market Volume (Thousand Units) Forecast by Design, 2020-2035
  • Table 59: East Asia Market Value (USD Billion) Forecast by End Use, 2020-2035
  • Table 60: East Asia Market Volume (Thousand Units) Forecast by End Use, 2020-2035
  • Table 61: South Asia & Pacific Market Value (USD Billion) Forecast by Country, 2020-2035
  • Table 62: South Asia & Pacific Market Volume (Thousand Units) Forecast by Country, 2020-2035
  • Table 63: South Asia & Pacific Market Value (USD Billion) Forecast by Material, 2020-2035
  • Table 64: South Asia & Pacific Market Volume (Thousand Units) Forecast by Material, 2020-2035
  • Table 65: South Asia & Pacific Market Value (USD Billion) Forecast by Size, 2020-2035
  • Table 66: South Asia & Pacific Market Volume (Thousand Units) Forecast by Size, 2020-2035
  • Table 67: South Asia & Pacific Market Value (USD Billion) Forecast by Design, 2020-2035
  • Table 68: South Asia & Pacific Market Volume (Thousand Units) Forecast by Design, 2020-2035
  • Table 69: South Asia & Pacific Market Value (USD Billion) Forecast by End Use, 2020-2035
  • Table 70: South Asia & Pacific Market Volume (Thousand Units) Forecast by End Use, 2020-2035
  • Table 71: Middle East and Africa Market Value (USD Billion) Forecast by Country, 2020-2035
  • Table 72: Middle East and Africa Market Volume (Thousand Units) Forecast by Country, 2020-2035
  • Table 73: Middle East and Africa Market Value (USD Billion) Forecast by Material, 2020-2035
  • Table 74: Middle East and Africa Market Volume (Thousand Units) Forecast by Material, 2020-2035
  • Table 75: Middle East and Africa Market Value (USD Billion) Forecast by Size, 2020-2035
  • Table 76: Middle East and Africa Market Volume (Thousand Units) Forecast by Size, 2020-2035
  • Table 77: Middle East and Africa Market Value (USD Billion) Forecast by Design, 2020-2035
  • Table 78: Middle East and Africa Market Volume (Thousand Units) Forecast by Design, 2020-2035
  • Table 79: Middle East and Africa Market Value (USD Billion) Forecast by End Use, 2020-2035
  • Table 80: Middle East and Africa Market Volume (Thousand Units) Forecast by End Use, 2020-2035

List of Figures

  • Figure 1: Global Market Volume (Thousand Units) Forecast 2020-2035
  • Figure 2: Global Market Pricing Analysis
  • Figure 3: Global Market Value (USD Billion) Forecast 2020-2035
  • Figure 4: Global Market Value Share and BPS Analysis by Material, 2025 and 2035
  • Figure 5: Global Market Y-o-Y Growth Comparison by Material, 2025-2035
  • Figure 6: Global Market Attractiveness Analysis by Material
  • Figure 7: Global Market Value Share and BPS Analysis by Size, 2025 and 2035
  • Figure 8: Global Market Y-o-Y Growth Comparison by Size, 2025-2035
  • Figure 9: Global Market Attractiveness Analysis by Size
  • Figure 10: Global Market Value Share and BPS Analysis by Design, 2025 and 2035
  • Figure 11: Global Market Y-o-Y Growth Comparison by Design, 2025-2035
  • Figure 12: Global Market Attractiveness Analysis by Design
  • Figure 13: Global Market Value Share and BPS Analysis by End Use, 2025 and 2035
  • Figure 14: Global Market Y-o-Y Growth Comparison by End Use, 2025-2035
  • Figure 15: Global Market Attractiveness Analysis by End Use
  • Figure 16: Global Market Value (USD Billion) Share and BPS Analysis by Region, 2025 and 2035
  • Figure 17: Global Market Y-o-Y Growth Comparison by Region, 2025-2035
  • Figure 18: Global Market Attractiveness Analysis by Region
  • Figure 19: North America Market Incremental $ Opportunity, 2025-2035
  • Figure 20: Latin America Market Incremental $ Opportunity, 2025-2035
  • Figure 21: Western Europe Market Incremental $ Opportunity, 2025-2035
  • Figure 22: Eastern Europe Market Incremental $ Opportunity, 2025-2035
  • Figure 23: East Asia Market Incremental $ Opportunity, 2025-2035
  • Figure 24: South Asia & Pacific Market Incremental $ Opportunity, 2025-2035
  • Figure 25: Middle East and Africa Market Incremental $ Opportunity, 2025-2035
  • Figure 26: North America Market Value Share and BPS Analysis by Country, 2025 and 2035
  • Figure 27: North America Market Value Share and BPS Analysis by Material, 2025 and 2035
  • Figure 28: North America Market Y-o-Y Growth Comparison by Material, 2025-2035
  • Figure 29: North America Market Attractiveness Analysis by Material
  • Figure 30: North America Market Value Share and BPS Analysis by Size, 2025 and 2035
  • Figure 31: North America Market Y-o-Y Growth Comparison by Size, 2025-2035
  • Figure 32: North America Market Attractiveness Analysis by Size
  • Figure 33: North America Market Value Share and BPS Analysis by Design, 2025 and 2035
  • Figure 34: North America Market Y-o-Y Growth Comparison by Design, 2025-2035
  • Figure 35: North America Market Attractiveness Analysis by Design
  • Figure 36: North America Market Value Share and BPS Analysis by End Use, 2025 and 2035
  • Figure 37: North America Market Y-o-Y Growth Comparison by End Use, 2025-2035
  • Figure 38: North America Market Attractiveness Analysis by End Use
  • Figure 39: Latin America Market Value Share and BPS Analysis by Country, 2025 and 2035
  • Figure 40: Latin America Market Value Share and BPS Analysis by Material, 2025 and 2035
  • Figure 41: Latin America Market Y-o-Y Growth Comparison by Material, 2025-2035
  • Figure 42: Latin America Market Attractiveness Analysis by Material
  • Figure 43: Latin America Market Value Share and BPS Analysis by Size, 2025 and 2035
  • Figure 44: Latin America Market Y-o-Y Growth Comparison by Size, 2025-2035
  • Figure 45: Latin America Market Attractiveness Analysis by Size
  • Figure 46: Latin America Market Value Share and BPS Analysis by Design, 2025 and 2035
  • Figure 47: Latin America Market Y-o-Y Growth Comparison by Design, 2025-2035
  • Figure 48: Latin America Market Attractiveness Analysis by Design
  • Figure 49: Latin America Market Value Share and BPS Analysis by End Use, 2025 and 2035
  • Figure 50: Latin America Market Y-o-Y Growth Comparison by End Use, 2025-2035
  • Figure 51: Latin America Market Attractiveness Analysis by End Use
  • Figure 52: Western Europe Market Value Share and BPS Analysis by Country, 2025 and 2035
  • Figure 53: Western Europe Market Value Share and BPS Analysis by Material, 2025 and 2035
  • Figure 54: Western Europe Market Y-o-Y Growth Comparison by Material, 2025-2035
  • Figure 55: Western Europe Market Attractiveness Analysis by Material
  • Figure 56: Western Europe Market Value Share and BPS Analysis by Size, 2025 and 2035
  • Figure 57: Western Europe Market Y-o-Y Growth Comparison by Size, 2025-2035
  • Figure 58: Western Europe Market Attractiveness Analysis by Size
  • Figure 59: Western Europe Market Value Share and BPS Analysis by Design, 2025 and 2035
  • Figure 60: Western Europe Market Y-o-Y Growth Comparison by Design, 2025-2035
  • Figure 61: Western Europe Market Attractiveness Analysis by Design
  • Figure 62: Western Europe Market Value Share and BPS Analysis by End Use, 2025 and 2035
  • Figure 63: Western Europe Market Y-o-Y Growth Comparison by End Use, 2025-2035
  • Figure 64: Western Europe Market Attractiveness Analysis by End Use
  • Figure 65: Eastern Europe Market Value Share and BPS Analysis by Country, 2025 and 2035
  • Figure 66: Eastern Europe Market Value Share and BPS Analysis by Material, 2025 and 2035
  • Figure 67: Eastern Europe Market Y-o-Y Growth Comparison by Material, 2025-2035
  • Figure 68: Eastern Europe Market Attractiveness Analysis by Material
  • Figure 69: Eastern Europe Market Value Share and BPS Analysis by Size, 2025 and 2035
  • Figure 70: Eastern Europe Market Y-o-Y Growth Comparison by Size, 2025-2035
  • Figure 71: Eastern Europe Market Attractiveness Analysis by Size
  • Figure 72: Eastern Europe Market Value Share and BPS Analysis by Design, 2025 and 2035
  • Figure 73: Eastern Europe Market Y-o-Y Growth Comparison by Design, 2025-2035
  • Figure 74: Eastern Europe Market Attractiveness Analysis by Design
  • Figure 75: Eastern Europe Market Value Share and BPS Analysis by End Use, 2025 and 2035
  • Figure 76: Eastern Europe Market Y-o-Y Growth Comparison by End Use, 2025-2035
  • Figure 77: Eastern Europe Market Attractiveness Analysis by End Use
  • Figure 78: East Asia Market Value Share and BPS Analysis by Country, 2025 and 2035
  • Figure 79: East Asia Market Value Share and BPS Analysis by Material, 2025 and 2035
  • Figure 80: East Asia Market Y-o-Y Growth Comparison by Material, 2025-2035
  • Figure 81: East Asia Market Attractiveness Analysis by Material
  • Figure 82: East Asia Market Value Share and BPS Analysis by Size, 2025 and 2035
  • Figure 83: East Asia Market Y-o-Y Growth Comparison by Size, 2025-2035
  • Figure 84: East Asia Market Attractiveness Analysis by Size
  • Figure 85: East Asia Market Value Share and BPS Analysis by Design, 2025 and 2035
  • Figure 86: East Asia Market Y-o-Y Growth Comparison by Design, 2025-2035
  • Figure 87: East Asia Market Attractiveness Analysis by Design
  • Figure 88: East Asia Market Value Share and BPS Analysis by End Use, 2025 and 2035
  • Figure 89: East Asia Market Y-o-Y Growth Comparison by End Use, 2025-2035
  • Figure 90: East Asia Market Attractiveness Analysis by End Use
  • Figure 91: South Asia & Pacific Market Value Share and BPS Analysis by Country, 2025 and 2035
  • Figure 92: South Asia & Pacific Market Value Share and BPS Analysis by Material, 2025 and 2035
  • Figure 93: South Asia & Pacific Market Y-o-Y Growth Comparison by Material, 2025-2035
  • Figure 94: South Asia & Pacific Market Attractiveness Analysis by Material
  • Figure 95: South Asia & Pacific Market Value Share and BPS Analysis by Size, 2025 and 2035
  • Figure 96: South Asia & Pacific Market Y-o-Y Growth Comparison by Size, 2025-2035
  • Figure 97: South Asia & Pacific Market Attractiveness Analysis by Size
  • Figure 98: South Asia & Pacific Market Value Share and BPS Analysis by Design, 2025 and 2035
  • Figure 99: South Asia & Pacific Market Y-o-Y Growth Comparison by Design, 2025-2035
  • Figure 100: South Asia & Pacific Market Attractiveness Analysis by Design
  • Figure 101: South Asia & Pacific Market Value Share and BPS Analysis by End Use, 2025 and 2035
  • Figure 102: South Asia & Pacific Market Y-o-Y Growth Comparison by End Use, 2025-2035
  • Figure 103: South Asia & Pacific Market Attractiveness Analysis by End Use
  • Figure 104: Middle East and Africa Market Value Share and BPS Analysis by Country, 2025 and 2035
  • Figure 105: Middle East and Africa Market Value Share and BPS Analysis by Material, 2025 and 2035
  • Figure 106: Middle East and Africa Market Y-o-Y Growth Comparison by Material, 2025-2035
  • Figure 107: Middle East and Africa Market Attractiveness Analysis by Material
  • Figure 108: Middle East and Africa Market Value Share and BPS Analysis by Size, 2025 and 2035
  • Figure 109: Middle East and Africa Market Y-o-Y Growth Comparison by Size, 2025-2035
  • Figure 110: Middle East and Africa Market Attractiveness Analysis by Size
  • Figure 111: Middle East and Africa Market Value Share and BPS Analysis by Design, 2025 and 2035
  • Figure 112: Middle East and Africa Market Y-o-Y Growth Comparison by Design, 2025-2035
  • Figure 113: Middle East and Africa Market Attractiveness Analysis by Design
  • Figure 114: Middle East and Africa Market Value Share and BPS Analysis by End Use, 2025 and 2035
  • Figure 115: Middle East and Africa Market Y-o-Y Growth Comparison by End Use, 2025-2035
  • Figure 116: Middle East and Africa Market Attractiveness Analysis by End Use
  • Figure 117: Global Market - Tier Structure Analysis
  • Figure 118: Global Market - Company Share Analysis

Frequently Asked Questions

What is the projected market size of the shelf display trays industry by 2035?

The industry is expected to reach USD 119.7 billion by 2035.

What is the CAGR of the shelf display trays market from 2025 to 2035?

The industry is projected to grow at a CAGR of 4.2% during the forecast period.

Which material dominates the shelf display trays market in 2025?

Cardboard holds the leading position with a 57.6% share in 2025.

What share does the food & beverage sector hold in shelf tray consumption in 2025?

The sector accounts for 48.9% of global shelf tray demand in 2025.

Who is the leading player in the global shelf display trays market and what is their market share?

HL Display AB is the leading player, holding a 23% share of the global market.

Explore Similar Insights

Future Market Insights

Shelf Display Trays Market