Reports
- Global Locations -
Headquarters
Future Market Insights, Inc.
Christiana Corporate, 200
Continental Drive, Suite 401,
Newark, Delaware - 19713,
United States
Americas
Future Market Insights, Inc.
616 Corporate Way, Suite 2-9018,
Valley Cottage, NY 10989, United States
MEA
Future Market Insights
1602-6 Jumeirah Bay X2 Tower, Plot No: JLT-PH2-X2A,
Jumeirah Lakes Towers, Dubai,
United Arab Emirates
Europe
Future Market Insights
3rd Floor, 207 Regent Street,
W1B 3HH London
United Kingdom
Asia Pacific
Future Market Insights
Office No. 401-A, 4th Floor,
VANTAGE 9, S.No. 36/1/1,
Baner, Pune 411045, India
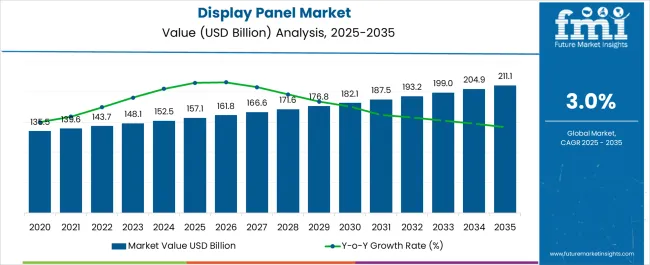
Global display panel market demand is anticipated to be valued at US$ 148,053.0 million in 2023, forecast a CAGR of 4.4% to be valued at US$ 228451.9 million from 2023 to 2033. Growth is attributed to the increasing advancement in consumer electronics. From 2018 to 2022, a CAGR of 3% was registered for the display panel market.
The display technologies industry offers thin film liquid crystal display (TFT-LCD) glass and other advanced display products which are used in applications such as televisions, smartphones, tablets, notebooks, wearable, gaming consoles, automotive, electronics, and other emerging technologies.
Data Points | Key Statistics |
---|---|
Growth Rate (2018 to 2022) | 3.0% CAGR |
Projected Growth Rate (2023-2033) | 4.4% CAGR |
Expected Market Value (2023) | US$ 148,053.0 million |
Category | Application |
---|---|
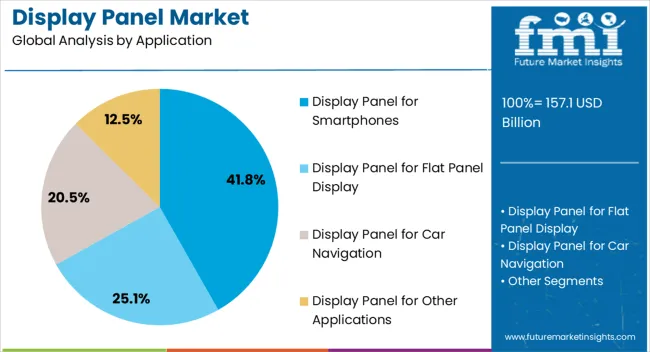
Leading Segment | Display panel for Flat Panel Display |
Market Share | 29.5% |
Category | Technology |
---|---|
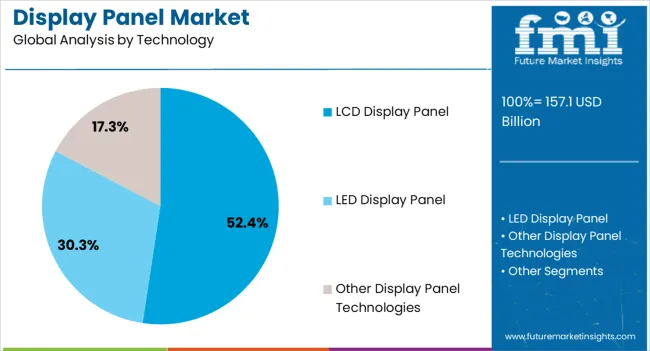
Leading Segment | LED Display Panel |
Market Share | 43.4% |
The demand for these end products heavily drives the display industry. With the advancement in technologies, there is an increase in awareness among the customers about the display panels or touch screens that enable them to interact with a computer. The display panel acts as a display screen that showcases control components and offers a platform to the consumers to exchange messages or interact.
Display panels have multiple applications, including in television screens, automobiles, smartphones, ATMs, smart wearables, and others. Adoption and awareness of many other devices are directly interlinked to the display panel market, such as smart devices, televisions, infotainment systems in automobiles, etc.
Global television shipment has been experiencing slow growth recently, at the same time, applications in various other devices, such as smartphones and gaming consoles, are increasing, which is negating the impact on the growth.
Don't pay for what you don't need
Customize your report by selecting specific countries or regions and save 30%!
Increasing Application of Display Panels in Different Sectors Provide Opportunity for the Growth of the Market
The application of display panels across various sectors, such as education and government offices, retail, and hospitality, is expected to boost the revenue of global display panels in the coming years.
Liquid Crystal Display (LCD) is gaining popularity as it is energy efficient and also offers better picture quality than other technologies. Flat panel display technology is also gaining popularity in the education system, hence flat panel display manufacturers are also working on developing interactive flat panel displays.
The emergence of multi-touch screens, reduction in replacement cycles, and changing consumer usage patterns are expected to drive the growth of display panels in the forecast period. Increasing demand in the automotive segment, technological advancements, and government initiatives toward smart cities is further positively impacting the growth of the global display panel market. Increasing demand for display panels from AR/VR, military, and defense is driving the market for display panels.
One of the major challenges of the display panel market is the higher cost and thickness of the display of these devices as compared to other modules. The display panel market is expected to witness sluggish and unpredictable growth owing to a quantitative decline in the number of LCD displays.
Moreover, financial uncertainty and macroeconomic situations around the world, such as fluctuating currency exchange rates and economic difficulties, are some of the major factors hindering the growth of the display panel market. However, increased competition from alternative technologies and LCD panel complex structures is likely to limit the growth of the display panel market.
Presence of Leading Manufacturers in the Region Boost the Growth of the Market in North America
As per FMI, the North American market is slated to account for 35.9% of the total market share. The rise in consumer demand for large LCD televisions, increasing the screen size of smartphones, and growth in the development of automotive displays are some of the factors driving demand for a display panel in the United States
Key players in the country have been developing, producing, and selling high-quality display panels. These display panels are implemented in different industry verticals such as automotive, entertainment, medical, and others. The manufacturers of the display panel are constantly undergoing product advancements as the factors such as increasing production of consumer electronics are creating a huge opportunity for display panels to drive the growth of the world display panel market.
The key factor for driving the display panel market in North America is the presence of major industry players. There is an increase in adoption of the touchscreen display panel in the country from video display device manufacturers. Such factors are contributing to the growth of the display panel market. For instance, in February 2022, Microtips Technology, the leading global manufacturer and supplier of LCD Modules, launched MTD0200DDP03RF-1, a great 2.0-inch IPS display for small projects. Also produce a full gamut of TFT Display Modules, Active Matrix and Passive Matrix OLED Modules, Graphic and Character Monochrome LCD Modules, and Fully Custom LCD Modules.
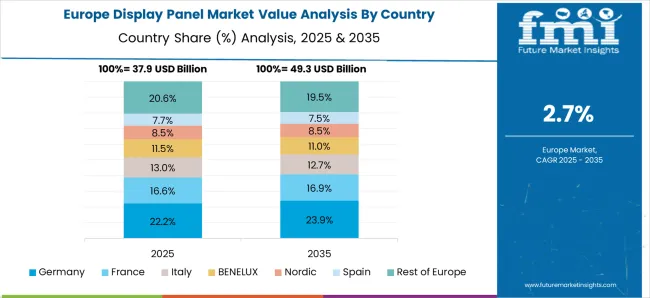
Growing Use of LCD Displays in Region Drives the Sales of Display Panel Market During Forecasting Period
According to Future Market Insights, Europe is expected to provide immense growth opportunities for the display panel market due to an increase in the adoption of consumer electronics devices, including televisions, mobile devices, laptops, tablets, and desktop monitors. The European display panel market accounts for 24.7%share of the total global market
The demand for display panels has risen dramatically. The increasing usage of LCD displays in various industries in these regions is boosting the display panel market. Moreover, rapid advancements being made in technology coupled with increasing investments in Research and Development are anticipated to drive the market further.
There is a surge in demand for OLED displays in regions due to advantages like viewing angles and black levels. Smartphone manufacturers are developing foldable phone models that incorporate flexible OLED displays. This is likely to further have a massive potential for display panel growth over the forecast period.
Get the data you need at a Fraction of the cost
Personalize your report by choosing insights you need
and save 40%!
Advancement in the Education Sector in The Region to Boost the Growth of the Display Panel Market
The Asia Pacific is anticipated to gain market share during the forecast period. Product launches, acquisitions, distribution agreements, alliances, and geographical expansion by local players, especially in China and India, are expected to propel the display panel market in the region.
The development of education infrastructure in Japan, China, and India also creates an opportunity for manufacturers to offer advanced interactive display panels. Governments in various countries in the region are also taking initiatives to modify education systems and make them technologically advanced. Governments are also investing in buying materials that are essential in interactive learning, including flat panel displays, tablets, etc. The increasing popularity of e-learning is driving the adoption of display panels to deliver content interactively.
With the rise in the development of smart classrooms and the adoption of new technologies to enhance the learning experience, the education sector is focusing on adopting interactive methods in countries like China and India. For instance, in the Union Budget 2021-22, the Indian government established the National Digital Educational Architecture (NDEAR) to strengthen digital infrastructure and support activities related to education planning.
The new entrants in the display panel market are continually indulging in several collaborations and highly investing in research and development activities to provide more convenient solutions to industry verticals. Some of the major start-ups that are leading the development of the market are –
Shijiazhuang Dianguang Hi-tech Electronics Co., Ltd, STONE Technology co., ltd., Teronix India Private Limited, RandServ Systems Pvt Ltd., Royal Display India and Vision Display Pvt. Ltd.
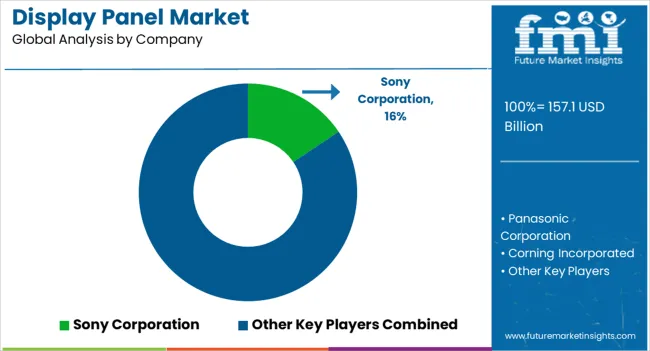
Some of the key participants present in the global display panel market include
Sony Corporation, Panasonic Corporation, Corning Incorporated, LG Electronics Inc., Asahi Glass, Nippon Electric Glass, Samsung Electronics Co. Ltd., Innolux Corporation, Sharp Corporation, and HannStar Display Corporation among others.
Attributed to the presence of such a high number of participants, the market is highly competitive. While global players such as Sony Corporation, Panasonic Corporation, Corning Incorporated, LG Electronics Inc., Asahi Glass, and Nippon Electric Glass account for considerable market size, several regional-level players are also operating across key growth regions, particularly in the Asia Pacific.
Report Attribute | Details |
---|---|
Growth Rate | CAGR of 4.3% from 2022 to 2032 |
Expected Market Value (2023) | US$ 148,053.0 million |
Anticipated Forecast Value (2033) | US$ 228451.9 million |
Base Year for Estimation | 2022 |
Historical Data | 2017 to 2022 |
Forecast Period | 2023 to 2033 |
Quantitative Units | Revenue in US$ million and CAGR from 2022 to 2032 |
Report Coverage | Revenue Forecast, Volume Forecast, Company Ranking, Competitive Landscape, Growth Factors, Trends and Pricing Analysis |
Segments Covered |
|
Regions Covered |
|
Key Countries Profiled |
|
Key Companies Profiled |
|
Customization | Available Upon Request |
1. Executive Summary 1.1. Global Market Outlook 1.2. Demand-side Trends 1.3. Supply-side Trends 1.4. Technology Roadmap Analysis 1.5. Analysis and Recommendations 2. Market Overview 2.1. Market Coverage / Taxonomy 2.2. Market Definition / Scope / Limitations 3. Market Background 3.1. Market Dynamics 3.1.1. Drivers 3.1.2. Restraints 3.1.3. Opportunity 3.1.4. Trends 3.2. Scenario Forecast 3.2.1. Demand in Optimistic Scenario 3.2.2. Demand in Likely Scenario 3.2.3. Demand in Conservative Scenario 3.3. Opportunity Map Analysis 3.4. Product Life Cycle Analysis 3.5. Supply Chain Analysis 3.5.1. Supply Side Participants and their Roles 3.5.1.1. Producers 3.5.1.2. Mid-Level Participants (Traders/ Agents/ Brokers) 3.5.1.3. Wholesalers and Distributors 3.5.2. Value Added and Value Created at Node in the Supply Chain 3.5.3. List of Raw Material Suppliers 3.5.4. List of Existing and Potential Buyer’s 3.6. Investment Feasibility Matrix 3.7. Value Chain Analysis 3.7.1. Profit Margin Analysis 3.7.2. Wholesalers and Distributors 3.7.3. Retailers 3.8. PESTLE and Porter’s Analysis 3.9. Regulatory Landscape 3.9.1. By Key Regions 3.9.2. By Key Countries 3.10. Regional Parent Market Outlook 3.11. Production and Consumption Statistics 3.12. Import and Export Statistics 4. Global Market Analysis 2018 to 2022 and Forecast, 2023 to 2033 4.1. Historical Market Size Value (US$ Million) & Volume (Units) Analysis, 2018 to 2022 4.2. Current and Future Market Size Value (US$ Million) & Volume (Units) Projections, 2023 to 2033 4.2.1. Y-o-Y Growth Trend Analysis 4.2.2. Absolute $ Opportunity Analysis 5. Global Market Analysis 2018 to 2022 and Forecast 2023 to 2033, By Application 5.1. Introduction / Key Findings 5.2. Historical Market Size Value (US$ Million) & Volume (Units) Analysis By Application, 2018 to 2022 5.3. Current and Future Market Size Value (US$ Million) & Volume (Units) Analysis and Forecast By Application, 2023 to 2033 5.3.1. Flat Panel Display 5.3.2. Car Navigation 5.3.3. Smartphones 5.3.4. Other Applications 5.4. Y-o-Y Growth Trend Analysis By Application, 2018 to 2022 5.5. Absolute $ Opportunity Analysis By Application, 2023 to 2033 6. Global Market Analysis 2018 to 2022 and Forecast 2023 to 2033, By Technology 6.1. Introduction / Key Findings 6.2. Historical Market Size Value (US$ Million) & Volume (Units) Analysis By Technology, 2018 to 2022 6.3. Current and Future Market Size Value (US$ Million) & Volume (Units) Analysis and Forecast By Technology, 2023 to 2033 6.3.1. LCD 6.3.2. LED 6.3.3. Other Display 6.4. Y-o-Y Growth Trend Analysis By Technology, 2018 to 2022 6.5. Absolute $ Opportunity Analysis By Technology, 2023 to 2033 7. Global Market Analysis 2018 to 2022 and Forecast 2023 to 2033, By Display Size 7.1. Introduction / Key Findings 7.2. Historical Market Size Value (US$ Million) & Volume (Units) Analysis By Display Size, 2018 to 2022 7.3. Current and Future Market Size Value (US$ Million) & Volume (Units) Analysis and Forecast By Display Size, 2023 to 2033 7.3.1. Small Screen Display 7.3.2. Medium Screen Display 7.3.3. Large Screen Display 7.4. Y-o-Y Growth Trend Analysis By Display Size, 2018 to 2022 7.5. Absolute $ Opportunity Analysis By Display Size, 2023 to 2033 8. Global Market Analysis 2018 to 2022 and Forecast 2023 to 2033, By Region 8.1. Introduction 8.2. Historical Market Size Value (US$ Million) & Volume (Units) Analysis By Region, 2018 to 2022 8.3. Current Market Size Value (US$ Million) & Volume (Units) Analysis and Forecast By Region, 2023 to 2033 8.3.1. North America 8.3.2. Latin America 8.3.3. Western Europe 8.3.4. Eastern Europe 8.3.5. South Asia and Pacific 8.3.6. East Asia 8.3.7. Middle East and Africa 8.4. Market Attractiveness Analysis By Region 9. North America Market Analysis 2018 to 2022 and Forecast 2023 to 2033, By Country 9.1. Historical Market Size Value (US$ Million) & Volume (Units) Trend Analysis By Market Taxonomy, 2018 to 2022 9.2. Market Size Value (US$ Million) & Volume (Units) Forecast By Market Taxonomy, 2023 to 2033 9.2.1. By Country 9.2.1.1. USA 9.2.1.2. Canada 9.2.2. By Application 9.2.3. By Technology 9.2.4. By Display Size 9.3. Market Attractiveness Analysis 9.3.1. By Country 9.3.2. By Application 9.3.3. By Technology 9.3.4. By Display Size 9.4. Key Takeaways 10. Latin America Market Analysis 2018 to 2022 and Forecast 2023 to 2033, By Country 10.1. Historical Market Size Value (US$ Million) & Volume (Units) Trend Analysis By Market Taxonomy, 2018 to 2022 10.2. Market Size Value (US$ Million) & Volume (Units) Forecast By Market Taxonomy, 2023 to 2033 10.2.1. By Country 10.2.1.1. Brazil 10.2.1.2. Mexico 10.2.1.3. Rest of Latin America 10.2.2. By Application 10.2.3. By Technology 10.2.4. By Display Size 10.3. Market Attractiveness Analysis 10.3.1. By Country 10.3.2. By Application 10.3.3. By Technology 10.3.4. By Display Size 10.4. Key Takeaways 11. Western Europe Market Analysis 2018 to 2022 and Forecast 2023 to 2033, By Country 11.1. Historical Market Size Value (US$ Million) & Volume (Units) Trend Analysis By Market Taxonomy, 2018 to 2022 11.2. Market Size Value (US$ Million) & Volume (Units) Forecast By Market Taxonomy, 2023 to 2033 11.2.1. By Country 11.2.1.1. Germany 11.2.1.2. UK 11.2.1.3. France 11.2.1.4. Spain 11.2.1.5. Italy 11.2.1.6. Rest of Western Europe 11.2.2. By Application 11.2.3. By Technology 11.2.4. By Display Size 11.3. Market Attractiveness Analysis 11.3.1. By Country 11.3.2. By Application 11.3.3. By Technology 11.3.4. By Display Size 11.4. Key Takeaways 12. Eastern Europe Market Analysis 2018 to 2022 and Forecast 2023 to 2033, By Country 12.1. Historical Market Size Value (US$ Million) & Volume (Units) Trend Analysis By Market Taxonomy, 2018 to 2022 12.2. Market Size Value (US$ Million) & Volume (Units) Forecast By Market Taxonomy, 2023 to 2033 12.2.1. By Country 12.2.1.1. Poland 12.2.1.2. Russia 12.2.1.3. Czech Republic 12.2.1.4. Romania 12.2.1.5. Rest of Eastern Europe 12.2.2. By Application 12.2.3. By Technology 12.2.4. By Display Size 12.3. Market Attractiveness Analysis 12.3.1. By Country 12.3.2. By Application 12.3.3. By Technology 12.3.4. By Display Size 12.4. Key Takeaways 13. South Asia and Pacific Market Analysis 2018 to 2022 and Forecast 2023 to 2033, By Country 13.1. Historical Market Size Value (US$ Million) & Volume (Units) Trend Analysis By Market Taxonomy, 2018 to 2022 13.2. Market Size Value (US$ Million) & Volume (Units) Forecast By Market Taxonomy, 2023 to 2033 13.2.1. By Country 13.2.1.1. India 13.2.1.2. Bangladesh 13.2.1.3. Australia 13.2.1.4. New Zealand 13.2.1.5. Rest of South Asia and Pacific 13.2.2. By Application 13.2.3. By Technology 13.2.4. By Display Size 13.3. Market Attractiveness Analysis 13.3.1. By Country 13.3.2. By Application 13.3.3. By Technology 13.3.4. By Display Size 13.4. Key Takeaways 14. East Asia Market Analysis 2018 to 2022 and Forecast 2023 to 2033, By Country 14.1. Historical Market Size Value (US$ Million) & Volume (Units) Trend Analysis By Market Taxonomy, 2018 to 2022 14.2. Market Size Value (US$ Million) & Volume (Units) Forecast By Market Taxonomy, 2023 to 2033 14.2.1. By Country 14.2.1.1. China 14.2.1.2. Japan 14.2.1.3. South Korea 14.2.2. By Application 14.2.3. By Technology 14.2.4. By Display Size 14.3. Market Attractiveness Analysis 14.3.1. By Country 14.3.2. By Application 14.3.3. By Technology 14.3.4. By Display Size 14.4. Key Takeaways 15. Middle East and Africa Market Analysis 2018 to 2022 and Forecast 2023 to 2033, By Country 15.1. Historical Market Size Value (US$ Million) & Volume (Units) Trend Analysis By Market Taxonomy, 2018 to 2022 15.2. Market Size Value (US$ Million) & Volume (Units) Forecast By Market Taxonomy, 2023 to 2033 15.2.1. By Country 15.2.1.1. GCC Countries 15.2.1.2. South Africa 15.2.1.3. Israel 15.2.1.4. Rest of MEA 15.2.2. By Application 15.2.3. By Technology 15.2.4. By Display Size 15.3. Market Attractiveness Analysis 15.3.1. By Country 15.3.2. By Application 15.3.3. By Technology 15.3.4. By Display Size 15.4. Key Takeaways 16. Key Countries Market Analysis 16.1. USA 16.1.1. Pricing Analysis 16.1.2. Market Share Analysis, 2022 16.1.2.1. By Application 16.1.2.2. By Technology 16.1.2.3. By Display Size 16.2. Canada 16.2.1. Pricing Analysis 16.2.2. Market Share Analysis, 2022 16.2.2.1. By Application 16.2.2.2. By Technology 16.2.2.3. By Display Size 16.3. Brazil 16.3.1. Pricing Analysis 16.3.2. Market Share Analysis, 2022 16.3.2.1. By Application 16.3.2.2. By Technology 16.3.2.3. By Display Size 16.4. Mexico 16.4.1. Pricing Analysis 16.4.2. Market Share Analysis, 2022 16.4.2.1. By Application 16.4.2.2. By Technology 16.4.2.3. By Display Size 16.5. Germany 16.5.1. Pricing Analysis 16.5.2. Market Share Analysis, 2022 16.5.2.1. By Application 16.5.2.2. By Technology 16.5.2.3. By Display Size 16.6. UK 16.6.1. Pricing Analysis 16.6.2. Market Share Analysis, 2022 16.6.2.1. By Application 16.6.2.2. By Technology 16.6.2.3. By Display Size 16.7. France 16.7.1. Pricing Analysis 16.7.2. Market Share Analysis, 2022 16.7.2.1. By Application 16.7.2.2. By Technology 16.7.2.3. By Display Size 16.8. Spain 16.8.1. Pricing Analysis 16.8.2. Market Share Analysis, 2022 16.8.2.1. By Application 16.8.2.2. By Technology 16.8.2.3. By Display Size 16.9. Italy 16.9.1. Pricing Analysis 16.9.2. Market Share Analysis, 2022 16.9.2.1. By Application 16.9.2.2. By Technology 16.9.2.3. By Display Size 16.10. Poland 16.10.1. Pricing Analysis 16.10.2. Market Share Analysis, 2022 16.10.2.1. By Application 16.10.2.2. By Technology 16.10.2.3. By Display Size 16.11. Russia 16.11.1. Pricing Analysis 16.11.2. Market Share Analysis, 2022 16.11.2.1. By Application 16.11.2.2. By Technology 16.11.2.3. By Display Size 16.12. Czech Republic 16.12.1. Pricing Analysis 16.12.2. Market Share Analysis, 2022 16.12.2.1. By Application 16.12.2.2. By Technology 16.12.2.3. By Display Size 16.13. Romania 16.13.1. Pricing Analysis 16.13.2. Market Share Analysis, 2022 16.13.2.1. By Application 16.13.2.2. By Technology 16.13.2.3. By Display Size 16.14. India 16.14.1. Pricing Analysis 16.14.2. Market Share Analysis, 2022 16.14.2.1. By Application 16.14.2.2. By Technology 16.14.2.3. By Display Size 16.15. Bangladesh 16.15.1. Pricing Analysis 16.15.2. Market Share Analysis, 2022 16.15.2.1. By Application 16.15.2.2. By Technology 16.15.2.3. By Display Size 16.16. Australia 16.16.1. Pricing Analysis 16.16.2. Market Share Analysis, 2022 16.16.2.1. By Application 16.16.2.2. By Technology 16.16.2.3. By Display Size 16.17. New Zealand 16.17.1. Pricing Analysis 16.17.2. Market Share Analysis, 2022 16.17.2.1. By Application 16.17.2.2. By Technology 16.17.2.3. By Display Size 16.18. China 16.18.1. Pricing Analysis 16.18.2. Market Share Analysis, 2022 16.18.2.1. By Application 16.18.2.2. By Technology 16.18.2.3. By Display Size 16.19. Japan 16.19.1. Pricing Analysis 16.19.2. Market Share Analysis, 2022 16.19.2.1. By Application 16.19.2.2. By Technology 16.19.2.3. By Display Size 16.20. South Korea 16.20.1. Pricing Analysis 16.20.2. Market Share Analysis, 2022 16.20.2.1. By Application 16.20.2.2. By Technology 16.20.2.3. By Display Size 16.21. GCC Countries 16.21.1. Pricing Analysis 16.21.2. Market Share Analysis, 2022 16.21.2.1. By Application 16.21.2.2. By Technology 16.21.2.3. By Display Size 16.22. South Africa 16.22.1. Pricing Analysis 16.22.2. Market Share Analysis, 2022 16.22.2.1. By Application 16.22.2.2. By Technology 16.22.2.3. By Display Size 16.23. Israel 16.23.1. Pricing Analysis 16.23.2. Market Share Analysis, 2022 16.23.2.1. By Application 16.23.2.2. By Technology 16.23.2.3. By Display Size 17. Market Structure Analysis 17.1. Competition Dashboard 17.2. Competition Benchmarking 17.3. Market Share Analysis of Top Players 17.3.1. By Regional 17.3.2. By Application 17.3.3. By Technology 17.3.4. By Display Size 18. Competition Analysis 18.1. Competition Deep Dive 18.1.1. Sony Corporation 18.1.1.1. Overview 18.1.1.2. Product Portfolio 18.1.1.3. Profitability by Market Segments 18.1.1.4. Sales Footprint 18.1.1.5. Strategy Overview 18.1.1.5.1. Marketing Strategy 18.1.1.5.2. Product Strategy 18.1.1.5.3. Channel Strategy 18.1.2. Panasonic Corporation 18.1.2.1. Overview 18.1.2.2. Product Portfolio 18.1.2.3. Profitability by Market Segments 18.1.2.4. Sales Footprint 18.1.2.5. Strategy Overview 18.1.2.5.1. Marketing Strategy 18.1.2.5.2. Product Strategy 18.1.2.5.3. Channel Strategy 18.1.3. Corning Incorporated 18.1.3.1. Overview 18.1.3.2. Product Portfolio 18.1.3.3. Profitability by Market Segments 18.1.3.4. Sales Footprint 18.1.3.5. Strategy Overview 18.1.3.5.1. Marketing Strategy 18.1.3.5.2. Product Strategy 18.1.3.5.3. Channel Strategy 18.1.4. LG Electronics Inc. 18.1.4.1. Overview 18.1.4.2. Product Portfolio 18.1.4.3. Profitability by Market Segments 18.1.4.4. Sales Footprint 18.1.4.5. Strategy Overview 18.1.4.5.1. Marketing Strategy 18.1.4.5.2. Product Strategy 18.1.4.5.3. Channel Strategy 18.1.5. Asahi Glass 18.1.5.1. Overview 18.1.5.2. Product Portfolio 18.1.5.3. Profitability by Market Segments 18.1.5.4. Sales Footprint 18.1.5.5. Strategy Overview 18.1.5.5.1. Marketing Strategy 18.1.5.5.2. Product Strategy 18.1.5.5.3. Channel Strategy 18.1.6. Nippon Electric Glass 18.1.6.1. Overview 18.1.6.2. Product Portfolio 18.1.6.3. Profitability by Market Segments 18.1.6.4. Sales Footprint 18.1.6.5. Strategy Overview 18.1.6.5.1. Marketing Strategy 18.1.6.5.2. Product Strategy 18.1.6.5.3. Channel Strategy 18.1.7. Samsung Electronics Co. Ltd. 18.1.7.1. Overview 18.1.7.2. Product Portfolio 18.1.7.3. Profitability by Market Segments 18.1.7.4. Sales Footprint 18.1.7.5. Strategy Overview 18.1.7.5.1. Marketing Strategy 18.1.7.5.2. Product Strategy 18.1.7.5.3. Channel Strategy 18.1.8. Innolux Corporation 18.1.8.1. Overview 18.1.8.2. Product Portfolio 18.1.8.3. Profitability by Market Segments 18.1.8.4. Sales Footprint 18.1.8.5. Strategy Overview 18.1.8.5.1. Marketing Strategy 18.1.8.5.2. Product Strategy 18.1.8.5.3. Channel Strategy 18.1.9. Sharp Corporation 18.1.9.1. Overview 18.1.9.2. Product Portfolio 18.1.9.3. Profitability by Market Segments 18.1.9.4. Sales Footprint 18.1.9.5. Strategy Overview 18.1.9.5.1. Marketing Strategy 18.1.9.5.2. Product Strategy 18.1.9.5.3. Channel Strategy 18.1.10. HannStar Display Corporation 18.1.10.1. Overview 18.1.10.2. Product Portfolio 18.1.10.3. Profitability by Market Segments 18.1.10.4. Sales Footprint 18.1.10.5. Strategy Overview 18.1.10.5.1. Marketing Strategy 18.1.10.5.2. Product Strategy 18.1.10.5.3. Channel Strategy 18.1.11. Toshiba Corporation 18.1.11.1. Overview 18.1.11.2. Product Portfolio 18.1.11.3. Profitability by Market Segments 18.1.11.4. Sales Footprint 18.1.11.5. Strategy Overview 18.1.11.5.1. Marketing Strategy 18.1.11.5.2. Product Strategy 18.1.11.5.3. Channel Strategy 18.1.12. Hisense 18.1.12.1. Overview 18.1.12.2. Product Portfolio 18.1.12.3. Profitability by Market Segments 18.1.12.4. Sales Footprint 18.1.12.5. Strategy Overview 18.1.12.5.1. Marketing Strategy 18.1.12.5.2. Product Strategy 18.1.12.5.3. Channel Strategy 18.1.13. AU Optronics Corporation 18.1.13.1. Overview 18.1.13.2. Product Portfolio 18.1.13.3. Profitability by Market Segments 18.1.13.4. Sales Footprint 18.1.13.5. Strategy Overview 18.1.13.5.1. Marketing Strategy 18.1.13.5.2. Product Strategy 18.1.13.5.3. Channel Strategy 19. Assumptions & Acronyms Used 20. Research Methodology
Don't pay for what you don't need
Customize your report by selecting specific countries or regions and save 30%!
Table 1: Global Market Value (US$ Million) Forecast by Region, 2018 to 2033 Table 2: Global Market Volume (Units) Forecast by Region, 2018 to 2033 Table 3: Global Market Value (US$ Million) Forecast by Application, 2018 to 2033 Table 4: Global Market Volume (Units) Forecast by Application, 2018 to 2033 Table 5: Global Market Value (US$ Million) Forecast by Technology, 2018 to 2033 Table 6: Global Market Volume (Units) Forecast by Technology, 2018 to 2033 Table 7: Global Market Value (US$ Million) Forecast by Display Size, 2018 to 2033 Table 8: Global Market Volume (Units) Forecast by Display Size, 2018 to 2033 Table 9: North America Market Value (US$ Million) Forecast by Country, 2018 to 2033 Table 10: North America Market Volume (Units) Forecast by Country, 2018 to 2033 Table 11: North America Market Value (US$ Million) Forecast by Application, 2018 to 2033 Table 12: North America Market Volume (Units) Forecast by Application, 2018 to 2033 Table 13: North America Market Value (US$ Million) Forecast by Technology, 2018 to 2033 Table 14: North America Market Volume (Units) Forecast by Technology, 2018 to 2033 Table 15: North America Market Value (US$ Million) Forecast by Display Size, 2018 to 2033 Table 16: North America Market Volume (Units) Forecast by Display Size, 2018 to 2033 Table 17: Latin America Market Value (US$ Million) Forecast by Country, 2018 to 2033 Table 18: Latin America Market Volume (Units) Forecast by Country, 2018 to 2033 Table 19: Latin America Market Value (US$ Million) Forecast by Application, 2018 to 2033 Table 20: Latin America Market Volume (Units) Forecast by Application, 2018 to 2033 Table 21: Latin America Market Value (US$ Million) Forecast by Technology, 2018 to 2033 Table 22: Latin America Market Volume (Units) Forecast by Technology, 2018 to 2033 Table 23: Latin America Market Value (US$ Million) Forecast by Display Size, 2018 to 2033 Table 24: Latin America Market Volume (Units) Forecast by Display Size, 2018 to 2033 Table 25: Western Europe Market Value (US$ Million) Forecast by Country, 2018 to 2033 Table 26: Western Europe Market Volume (Units) Forecast by Country, 2018 to 2033 Table 27: Western Europe Market Value (US$ Million) Forecast by Application, 2018 to 2033 Table 28: Western Europe Market Volume (Units) Forecast by Application, 2018 to 2033 Table 29: Western Europe Market Value (US$ Million) Forecast by Technology, 2018 to 2033 Table 30: Western Europe Market Volume (Units) Forecast by Technology, 2018 to 2033 Table 31: Western Europe Market Value (US$ Million) Forecast by Display Size, 2018 to 2033 Table 32: Western Europe Market Volume (Units) Forecast by Display Size, 2018 to 2033 Table 33: Eastern Europe Market Value (US$ Million) Forecast by Country, 2018 to 2033 Table 34: Eastern Europe Market Volume (Units) Forecast by Country, 2018 to 2033 Table 35: Eastern Europe Market Value (US$ Million) Forecast by Application, 2018 to 2033 Table 36: Eastern Europe Market Volume (Units) Forecast by Application, 2018 to 2033 Table 37: Eastern Europe Market Value (US$ Million) Forecast by Technology, 2018 to 2033 Table 38: Eastern Europe Market Volume (Units) Forecast by Technology, 2018 to 2033 Table 39: Eastern Europe Market Value (US$ Million) Forecast by Display Size, 2018 to 2033 Table 40: Eastern Europe Market Volume (Units) Forecast by Display Size, 2018 to 2033 Table 41: South Asia and Pacific Market Value (US$ Million) Forecast by Country, 2018 to 2033 Table 42: South Asia and Pacific Market Volume (Units) Forecast by Country, 2018 to 2033 Table 43: South Asia and Pacific Market Value (US$ Million) Forecast by Application, 2018 to 2033 Table 44: South Asia and Pacific Market Volume (Units) Forecast by Application, 2018 to 2033 Table 45: South Asia and Pacific Market Value (US$ Million) Forecast by Technology, 2018 to 2033 Table 46: South Asia and Pacific Market Volume (Units) Forecast by Technology, 2018 to 2033 Table 47: South Asia and Pacific Market Value (US$ Million) Forecast by Display Size, 2018 to 2033 Table 48: South Asia and Pacific Market Volume (Units) Forecast by Display Size, 2018 to 2033 Table 49: East Asia Market Value (US$ Million) Forecast by Country, 2018 to 2033 Table 50: East Asia Market Volume (Units) Forecast by Country, 2018 to 2033 Table 51: East Asia Market Value (US$ Million) Forecast by Application, 2018 to 2033 Table 52: East Asia Market Volume (Units) Forecast by Application, 2018 to 2033 Table 53: East Asia Market Value (US$ Million) Forecast by Technology, 2018 to 2033 Table 54: East Asia Market Volume (Units) Forecast by Technology, 2018 to 2033 Table 55: East Asia Market Value (US$ Million) Forecast by Display Size, 2018 to 2033 Table 56: East Asia Market Volume (Units) Forecast by Display Size, 2018 to 2033 Table 57: Middle East and Africa Market Value (US$ Million) Forecast by Country, 2018 to 2033 Table 58: Middle East and Africa Market Volume (Units) Forecast by Country, 2018 to 2033 Table 59: Middle East and Africa Market Value (US$ Million) Forecast by Application, 2018 to 2033 Table 60: Middle East and Africa Market Volume (Units) Forecast by Application, 2018 to 2033 Table 61: Middle East and Africa Market Value (US$ Million) Forecast by Technology, 2018 to 2033 Table 62: Middle East and Africa Market Volume (Units) Forecast by Technology, 2018 to 2033 Table 63: Middle East and Africa Market Value (US$ Million) Forecast by Display Size, 2018 to 2033 Table 64: Middle East and Africa Market Volume (Units) Forecast by Display Size, 2018 to 2033
Figure 1: Global Market Value (US$ Million) by Application, 2023 to 2033 Figure 2: Global Market Value (US$ Million) by Technology, 2023 to 2033 Figure 3: Global Market Value (US$ Million) by Display Size, 2023 to 2033 Figure 4: Global Market Value (US$ Million) by Region, 2023 to 2033 Figure 5: Global Market Value (US$ Million) Analysis by Region, 2018 to 2033 Figure 6: Global Market Volume (Units) Analysis by Region, 2018 to 2033 Figure 7: Global Market Value Share (%) and BPS Analysis by Region, 2023 to 2033 Figure 8: Global Market Y-o-Y Growth (%) Projections by Region, 2023 to 2033 Figure 9: Global Market Value (US$ Million) Analysis by Application, 2018 to 2033 Figure 10: Global Market Volume (Units) Analysis by Application, 2018 to 2033 Figure 11: Global Market Value Share (%) and BPS Analysis by Application, 2023 to 2033 Figure 12: Global Market Y-o-Y Growth (%) Projections by Application, 2023 to 2033 Figure 13: Global Market Value (US$ Million) Analysis by Technology, 2018 to 2033 Figure 14: Global Market Volume (Units) Analysis by Technology, 2018 to 2033 Figure 15: Global Market Value Share (%) and BPS Analysis by Technology, 2023 to 2033 Figure 16: Global Market Y-o-Y Growth (%) Projections by Technology, 2023 to 2033 Figure 17: Global Market Value (US$ Million) Analysis by Display Size, 2018 to 2033 Figure 18: Global Market Volume (Units) Analysis by Display Size, 2018 to 2033 Figure 19: Global Market Value Share (%) and BPS Analysis by Display Size, 2023 to 2033 Figure 20: Global Market Y-o-Y Growth (%) Projections by Display Size, 2023 to 2033 Figure 21: Global Market Attractiveness by Application, 2023 to 2033 Figure 22: Global Market Attractiveness by Technology, 2023 to 2033 Figure 23: Global Market Attractiveness by Display Size, 2023 to 2033 Figure 24: Global Market Attractiveness by Region, 2023 to 2033 Figure 25: North America Market Value (US$ Million) by Application, 2023 to 2033 Figure 26: North America Market Value (US$ Million) by Technology, 2023 to 2033 Figure 27: North America Market Value (US$ Million) by Display Size, 2023 to 2033 Figure 28: North America Market Value (US$ Million) by Country, 2023 to 2033 Figure 29: North America Market Value (US$ Million) Analysis by Country, 2018 to 2033 Figure 30: North America Market Volume (Units) Analysis by Country, 2018 to 2033 Figure 31: North America Market Value Share (%) and BPS Analysis by Country, 2023 to 2033 Figure 32: North America Market Y-o-Y Growth (%) Projections by Country, 2023 to 2033 Figure 33: North America Market Value (US$ Million) Analysis by Application, 2018 to 2033 Figure 34: North America Market Volume (Units) Analysis by Application, 2018 to 2033 Figure 35: North America Market Value Share (%) and BPS Analysis by Application, 2023 to 2033 Figure 36: North America Market Y-o-Y Growth (%) Projections by Application, 2023 to 2033 Figure 37: North America Market Value (US$ Million) Analysis by Technology, 2018 to 2033 Figure 38: North America Market Volume (Units) Analysis by Technology, 2018 to 2033 Figure 39: North America Market Value Share (%) and BPS Analysis by Technology, 2023 to 2033 Figure 40: North America Market Y-o-Y Growth (%) Projections by Technology, 2023 to 2033 Figure 41: North America Market Value (US$ Million) Analysis by Display Size, 2018 to 2033 Figure 42: North America Market Volume (Units) Analysis by Display Size, 2018 to 2033 Figure 43: North America Market Value Share (%) and BPS Analysis by Display Size, 2023 to 2033 Figure 44: North America Market Y-o-Y Growth (%) Projections by Display Size, 2023 to 2033 Figure 45: North America Market Attractiveness by Application, 2023 to 2033 Figure 46: North America Market Attractiveness by Technology, 2023 to 2033 Figure 47: North America Market Attractiveness by Display Size, 2023 to 2033 Figure 48: North America Market Attractiveness by Country, 2023 to 2033 Figure 49: Latin America Market Value (US$ Million) by Application, 2023 to 2033 Figure 50: Latin America Market Value (US$ Million) by Technology, 2023 to 2033 Figure 51: Latin America Market Value (US$ Million) by Display Size, 2023 to 2033 Figure 52: Latin America Market Value (US$ Million) by Country, 2023 to 2033 Figure 53: Latin America Market Value (US$ Million) Analysis by Country, 2018 to 2033 Figure 54: Latin America Market Volume (Units) Analysis by Country, 2018 to 2033 Figure 55: Latin America Market Value Share (%) and BPS Analysis by Country, 2023 to 2033 Figure 56: Latin America Market Y-o-Y Growth (%) Projections by Country, 2023 to 2033 Figure 57: Latin America Market Value (US$ Million) Analysis by Application, 2018 to 2033 Figure 58: Latin America Market Volume (Units) Analysis by Application, 2018 to 2033 Figure 59: Latin America Market Value Share (%) and BPS Analysis by Application, 2023 to 2033 Figure 60: Latin America Market Y-o-Y Growth (%) Projections by Application, 2023 to 2033 Figure 61: Latin America Market Value (US$ Million) Analysis by Technology, 2018 to 2033 Figure 62: Latin America Market Volume (Units) Analysis by Technology, 2018 to 2033 Figure 63: Latin America Market Value Share (%) and BPS Analysis by Technology, 2023 to 2033 Figure 64: Latin America Market Y-o-Y Growth (%) Projections by Technology, 2023 to 2033 Figure 65: Latin America Market Value (US$ Million) Analysis by Display Size, 2018 to 2033 Figure 66: Latin America Market Volume (Units) Analysis by Display Size, 2018 to 2033 Figure 67: Latin America Market Value Share (%) and BPS Analysis by Display Size, 2023 to 2033 Figure 68: Latin America Market Y-o-Y Growth (%) Projections by Display Size, 2023 to 2033 Figure 69: Latin America Market Attractiveness by Application, 2023 to 2033 Figure 70: Latin America Market Attractiveness by Technology, 2023 to 2033 Figure 71: Latin America Market Attractiveness by Display Size, 2023 to 2033 Figure 72: Latin America Market Attractiveness by Country, 2023 to 2033 Figure 73: Western Europe Market Value (US$ Million) by Application, 2023 to 2033 Figure 74: Western Europe Market Value (US$ Million) by Technology, 2023 to 2033 Figure 75: Western Europe Market Value (US$ Million) by Display Size, 2023 to 2033 Figure 76: Western Europe Market Value (US$ Million) by Country, 2023 to 2033 Figure 77: Western Europe Market Value (US$ Million) Analysis by Country, 2018 to 2033 Figure 78: Western Europe Market Volume (Units) Analysis by Country, 2018 to 2033 Figure 79: Western Europe Market Value Share (%) and BPS Analysis by Country, 2023 to 2033 Figure 80: Western Europe Market Y-o-Y Growth (%) Projections by Country, 2023 to 2033 Figure 81: Western Europe Market Value (US$ Million) Analysis by Application, 2018 to 2033 Figure 82: Western Europe Market Volume (Units) Analysis by Application, 2018 to 2033 Figure 83: Western Europe Market Value Share (%) and BPS Analysis by Application, 2023 to 2033 Figure 84: Western Europe Market Y-o-Y Growth (%) Projections by Application, 2023 to 2033 Figure 85: Western Europe Market Value (US$ Million) Analysis by Technology, 2018 to 2033 Figure 86: Western Europe Market Volume (Units) Analysis by Technology, 2018 to 2033 Figure 87: Western Europe Market Value Share (%) and BPS Analysis by Technology, 2023 to 2033 Figure 88: Western Europe Market Y-o-Y Growth (%) Projections by Technology, 2023 to 2033 Figure 89: Western Europe Market Value (US$ Million) Analysis by Display Size, 2018 to 2033 Figure 90: Western Europe Market Volume (Units) Analysis by Display Size, 2018 to 2033 Figure 91: Western Europe Market Value Share (%) and BPS Analysis by Display Size, 2023 to 2033 Figure 92: Western Europe Market Y-o-Y Growth (%) Projections by Display Size, 2023 to 2033 Figure 93: Western Europe Market Attractiveness by Application, 2023 to 2033 Figure 94: Western Europe Market Attractiveness by Technology, 2023 to 2033 Figure 95: Western Europe Market Attractiveness by Display Size, 2023 to 2033 Figure 96: Western Europe Market Attractiveness by Country, 2023 to 2033 Figure 97: Eastern Europe Market Value (US$ Million) by Application, 2023 to 2033 Figure 98: Eastern Europe Market Value (US$ Million) by Technology, 2023 to 2033 Figure 99: Eastern Europe Market Value (US$ Million) by Display Size, 2023 to 2033 Figure 100: Eastern Europe Market Value (US$ Million) by Country, 2023 to 2033 Figure 101: Eastern Europe Market Value (US$ Million) Analysis by Country, 2018 to 2033 Figure 102: Eastern Europe Market Volume (Units) Analysis by Country, 2018 to 2033 Figure 103: Eastern Europe Market Value Share (%) and BPS Analysis by Country, 2023 to 2033 Figure 104: Eastern Europe Market Y-o-Y Growth (%) Projections by Country, 2023 to 2033 Figure 105: Eastern Europe Market Value (US$ Million) Analysis by Application, 2018 to 2033 Figure 106: Eastern Europe Market Volume (Units) Analysis by Application, 2018 to 2033 Figure 107: Eastern Europe Market Value Share (%) and BPS Analysis by Application, 2023 to 2033 Figure 108: Eastern Europe Market Y-o-Y Growth (%) Projections by Application, 2023 to 2033 Figure 109: Eastern Europe Market Value (US$ Million) Analysis by Technology, 2018 to 2033 Figure 110: Eastern Europe Market Volume (Units) Analysis by Technology, 2018 to 2033 Figure 111: Eastern Europe Market Value Share (%) and BPS Analysis by Technology, 2023 to 2033 Figure 112: Eastern Europe Market Y-o-Y Growth (%) Projections by Technology, 2023 to 2033 Figure 113: Eastern Europe Market Value (US$ Million) Analysis by Display Size, 2018 to 2033 Figure 114: Eastern Europe Market Volume (Units) Analysis by Display Size, 2018 to 2033 Figure 115: Eastern Europe Market Value Share (%) and BPS Analysis by Display Size, 2023 to 2033 Figure 116: Eastern Europe Market Y-o-Y Growth (%) Projections by Display Size, 2023 to 2033 Figure 117: Eastern Europe Market Attractiveness by Application, 2023 to 2033 Figure 118: Eastern Europe Market Attractiveness by Technology, 2023 to 2033 Figure 119: Eastern Europe Market Attractiveness by Display Size, 2023 to 2033 Figure 120: Eastern Europe Market Attractiveness by Country, 2023 to 2033 Figure 121: South Asia and Pacific Market Value (US$ Million) by Application, 2023 to 2033 Figure 122: South Asia and Pacific Market Value (US$ Million) by Technology, 2023 to 2033 Figure 123: South Asia and Pacific Market Value (US$ Million) by Display Size, 2023 to 2033 Figure 124: South Asia and Pacific Market Value (US$ Million) by Country, 2023 to 2033 Figure 125: South Asia and Pacific Market Value (US$ Million) Analysis by Country, 2018 to 2033 Figure 126: South Asia and Pacific Market Volume (Units) Analysis by Country, 2018 to 2033 Figure 127: South Asia and Pacific Market Value Share (%) and BPS Analysis by Country, 2023 to 2033 Figure 128: South Asia and Pacific Market Y-o-Y Growth (%) Projections by Country, 2023 to 2033 Figure 129: South Asia and Pacific Market Value (US$ Million) Analysis by Application, 2018 to 2033 Figure 130: South Asia and Pacific Market Volume (Units) Analysis by Application, 2018 to 2033 Figure 131: South Asia and Pacific Market Value Share (%) and BPS Analysis by Application, 2023 to 2033 Figure 132: South Asia and Pacific Market Y-o-Y Growth (%) Projections by Application, 2023 to 2033 Figure 133: South Asia and Pacific Market Value (US$ Million) Analysis by Technology, 2018 to 2033 Figure 134: South Asia and Pacific Market Volume (Units) Analysis by Technology, 2018 to 2033 Figure 135: South Asia and Pacific Market Value Share (%) and BPS Analysis by Technology, 2023 to 2033 Figure 136: South Asia and Pacific Market Y-o-Y Growth (%) Projections by Technology, 2023 to 2033 Figure 137: South Asia and Pacific Market Value (US$ Million) Analysis by Display Size, 2018 to 2033 Figure 138: South Asia and Pacific Market Volume (Units) Analysis by Display Size, 2018 to 2033 Figure 139: South Asia and Pacific Market Value Share (%) and BPS Analysis by Display Size, 2023 to 2033 Figure 140: South Asia and Pacific Market Y-o-Y Growth (%) Projections by Display Size, 2023 to 2033 Figure 141: South Asia and Pacific Market Attractiveness by Application, 2023 to 2033 Figure 142: South Asia and Pacific Market Attractiveness by Technology, 2023 to 2033 Figure 143: South Asia and Pacific Market Attractiveness by Display Size, 2023 to 2033 Figure 144: South Asia and Pacific Market Attractiveness by Country, 2023 to 2033 Figure 145: East Asia Market Value (US$ Million) by Application, 2023 to 2033 Figure 146: East Asia Market Value (US$ Million) by Technology, 2023 to 2033 Figure 147: East Asia Market Value (US$ Million) by Display Size, 2023 to 2033 Figure 148: East Asia Market Value (US$ Million) by Country, 2023 to 2033 Figure 149: East Asia Market Value (US$ Million) Analysis by Country, 2018 to 2033 Figure 150: East Asia Market Volume (Units) Analysis by Country, 2018 to 2033 Figure 151: East Asia Market Value Share (%) and BPS Analysis by Country, 2023 to 2033 Figure 152: East Asia Market Y-o-Y Growth (%) Projections by Country, 2023 to 2033 Figure 153: East Asia Market Value (US$ Million) Analysis by Application, 2018 to 2033 Figure 154: East Asia Market Volume (Units) Analysis by Application, 2018 to 2033 Figure 155: East Asia Market Value Share (%) and BPS Analysis by Application, 2023 to 2033 Figure 156: East Asia Market Y-o-Y Growth (%) Projections by Application, 2023 to 2033 Figure 157: East Asia Market Value (US$ Million) Analysis by Technology, 2018 to 2033 Figure 158: East Asia Market Volume (Units) Analysis by Technology, 2018 to 2033 Figure 159: East Asia Market Value Share (%) and BPS Analysis by Technology, 2023 to 2033 Figure 160: East Asia Market Y-o-Y Growth (%) Projections by Technology, 2023 to 2033 Figure 161: East Asia Market Value (US$ Million) Analysis by Display Size, 2018 to 2033 Figure 162: East Asia Market Volume (Units) Analysis by Display Size, 2018 to 2033 Figure 163: East Asia Market Value Share (%) and BPS Analysis by Display Size, 2023 to 2033 Figure 164: East Asia Market Y-o-Y Growth (%) Projections by Display Size, 2023 to 2033 Figure 165: East Asia Market Attractiveness by Application, 2023 to 2033 Figure 166: East Asia Market Attractiveness by Technology, 2023 to 2033 Figure 167: East Asia Market Attractiveness by Display Size, 2023 to 2033 Figure 168: East Asia Market Attractiveness by Country, 2023 to 2033 Figure 169: Middle East and Africa Market Value (US$ Million) by Application, 2023 to 2033 Figure 170: Middle East and Africa Market Value (US$ Million) by Technology, 2023 to 2033 Figure 171: Middle East and Africa Market Value (US$ Million) by Display Size, 2023 to 2033 Figure 172: Middle East and Africa Market Value (US$ Million) by Country, 2023 to 2033 Figure 173: Middle East and Africa Market Value (US$ Million) Analysis by Country, 2018 to 2033 Figure 174: Middle East and Africa Market Volume (Units) Analysis by Country, 2018 to 2033 Figure 175: Middle East and Africa Market Value Share (%) and BPS Analysis by Country, 2023 to 2033 Figure 176: Middle East and Africa Market Y-o-Y Growth (%) Projections by Country, 2023 to 2033 Figure 177: Middle East and Africa Market Value (US$ Million) Analysis by Application, 2018 to 2033 Figure 178: Middle East and Africa Market Volume (Units) Analysis by Application, 2018 to 2033 Figure 179: Middle East and Africa Market Value Share (%) and BPS Analysis by Application, 2023 to 2033 Figure 180: Middle East and Africa Market Y-o-Y Growth (%) Projections by Application, 2023 to 2033 Figure 181: Middle East and Africa Market Value (US$ Million) Analysis by Technology, 2018 to 2033 Figure 182: Middle East and Africa Market Volume (Units) Analysis by Technology, 2018 to 2033 Figure 183: Middle East and Africa Market Value Share (%) and BPS Analysis by Technology, 2023 to 2033 Figure 184: Middle East and Africa Market Y-o-Y Growth (%) Projections by Technology, 2023 to 2033 Figure 185: Middle East and Africa Market Value (US$ Million) Analysis by Display Size, 2018 to 2033 Figure 186: Middle East and Africa Market Volume (Units) Analysis by Display Size, 2018 to 2033 Figure 187: Middle East and Africa Market Value Share (%) and BPS Analysis by Display Size, 2023 to 2033 Figure 188: Middle East and Africa Market Y-o-Y Growth (%) Projections by Display Size, 2023 to 2033 Figure 189: Middle East and Africa Market Attractiveness by Application, 2023 to 2033 Figure 190: Middle East and Africa Market Attractiveness by Technology, 2023 to 2033 Figure 191: Middle East and Africa Market Attractiveness by Display Size, 2023 to 2033 Figure 192: Middle East and Africa Market Attractiveness by Country, 2023 to 2033
Recommendations
Explore Technology Insights
View Reports