4K VR Displays Market Size and Share Forecast Outlook 2025 to 2035

The 4K VR Displays Market is estimated to be valued at USD 1.6 billion in 2025 and is projected to reach USD 28.3 billion by 2035, registering a compound annual growth rate (CAGR) of 33.1% over the forecast period.
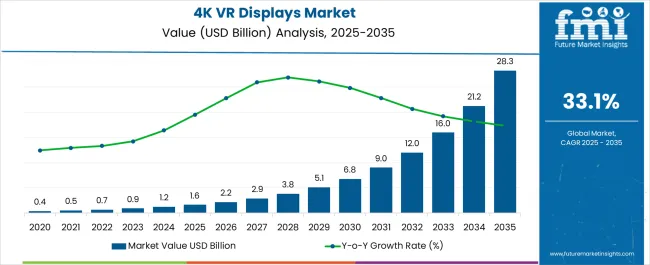
Quick Stats for 4K VR Displays Market

  • 4K VR Displays Market Industry Value (2025): USD 1.6 billion
  • 4K VR Displays Market Forecast Value (2035): USD 28.3 billion
  • 4K VR Displays Market Forecast CAGR: 33.1%
  • Leading Segment in 4K VR Displays Market in 2025: Single Display Resolution (57.3%)
  • Key Growth Region in 4K VR Displays Market: North America, Asia-Pacific, Europe
  • Top Key Players in 4K VR Displays Market: Samsung Electronics Co., Ltd., Synaptics Incorporated, Himax Technologies, Inc., Raydium Semiconductor Corporation, New Vision Display, Inc., Varjo, Sony, DPVR

4k Vr Displays Market Market Value Analysis

Metric Value
4K VR Displays Market Estimated Value in (2025 E) USD 1.6 billion
4K VR Displays Market Forecast Value in (2035 F) USD 28.3 billion
Forecast CAGR (2025 to 2035) 33.1%

Rationale for Segmental Growth in the 4K VR Displays Market

The 4K VR displays market is gaining momentum due to rapid advancements in immersive technologies, increasing consumer adoption of high resolution content, and expanding applications across entertainment, healthcare, and education. Demand is being driven by the growing preference for lifelike visual experiences and reduced motion sickness in virtual environments.

Continuous innovation in display panels, miniaturization of components, and integration of OLED and micro LED technologies are enhancing performance standards. Additionally, the proliferation of 5G connectivity and cloud based content delivery is supporting seamless VR experiences, further driving adoption.

Regulatory focus on reducing latency and improving eye safety standards is also influencing market developments. The overall outlook remains promising as manufacturers prioritize high pixel density, low power consumption, and cost effective mass production to meet rising global demand for next generation VR solutions.

Segmental Analysis

The market is segmented by Display Resolution and Application and region. By Display Resolution, the market is divided into Single Display Resolution, Dual Display Resolution, and Triple Display Resolution. In terms of Application, the market is classified into Smart phone, Smart watch, Smart TV, and Others. Regionally, the market is classified into North America, Latin America, Western Europe, Eastern Europe, Balkan & Baltic Countries, Russia & Belarus, Central Asia, East Asia, South Asia & Pacific, and the Middle East & Africa.
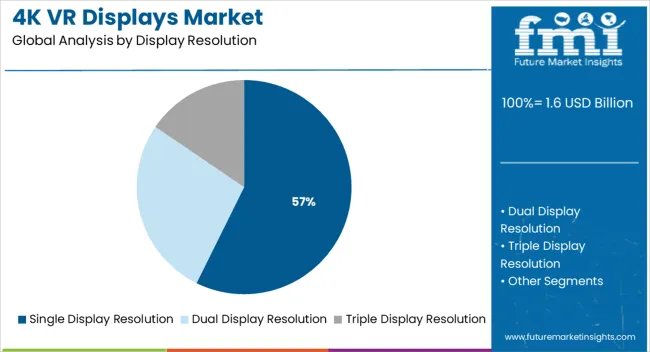
Insights into the Single Display Resolution Segment

4k Vr Displays Market Analysis By Display Resolution

The single display resolution segment is projected to hold 57.30% of total revenue by 2025 within the display resolution category, making it the leading segment. Its growth is supported by widespread use in consumer VR devices that demand a balance between affordability, compact design, and immersive clarity.

Single display setups are favored for delivering consistent frame rates and manageable power requirements, making them accessible to a larger consumer base. Manufacturers have been investing in higher pixel density and improved refresh rates to optimize visual performance without significantly increasing costs.

The ability to integrate seamlessly into lightweight and portable VR headsets has further strengthened the dominance of single display resolution in the market.
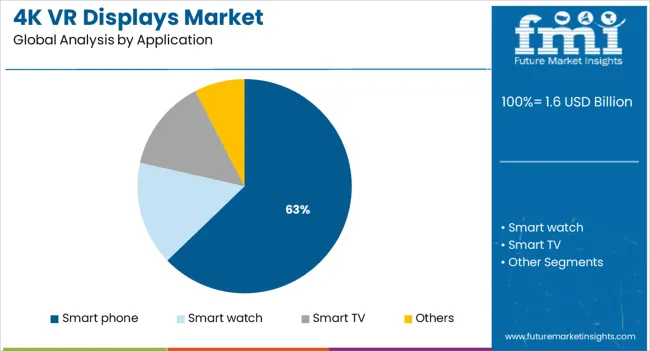
Insights into the Smart Phone Application Segment

4k Vr Displays Market Analysis By Application

The smart phone application segment is expected to contribute 62.80% of total market revenue by 2025 within the application category, positioning it as the leading area of adoption. Growth is being fueled by increasing availability of VR compatible smartphones, widespread internet penetration, and consumer demand for on the go immersive experiences.

Smartphones offer a cost effective entry point into VR, making the technology more accessible to mass markets. The rapid evolution of mobile processors, high refresh rate displays, and stronger graphics capabilities have significantly enhanced VR performance on handheld devices.

As 5G deployment expands and mobile ecosystems mature, smartphones are expected to remain the largest driver of VR adoption, consolidating their share as the leading application in the 4K VR displays market.

2020 to 2025 4K VR Displays Market Demand Outlook Compared to 2025 to 2035 forecast

The market for 4K VR displays is currently a niche market and is expected to grow in the future as technology advances and the demand for higher resolution VR experiences increases.

The growth of 4K VR displays market is attributed to factors such as the increasing adoption of VR technology in various industries, the growing popularity of gaming and video content, and the availability of more affordable VR hardware.

Additionally, the increasing demand for high-quality VR experiences in industries such as healthcare, education, and real estate is also expected to drive the market for 4K VR displays.

The high cost of 4K VR displays can make them prohibitively expensive for many consumers that may impede the growth of this market.

Additionally, the limited availability of 4K VR content may also hinder market growth. Other constraints include the need for high-performance computing hardware to support 4K VR displays, as well as the lack of standardization in the VR industry.

Regional Analysis

North America had the largest market share for 4K VR displays solutions market for the year 2025, with a market share of 28.2%. While South Asia and Pacific is expected to be the fastest growing region with a CAGR of 29.1%

The gaming and entertainment industry in North America is well-developed, and the region has a strong presence of tech giants such as Facebook, Google and Microsoft, which are actively promoting the development and use of VR technology.
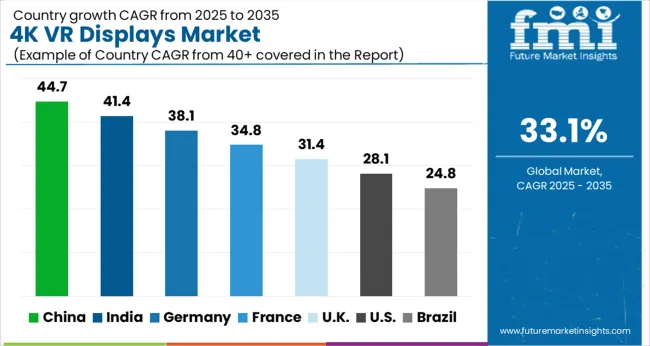
Country wise insights

4k Vr Displays Market Cagr Analysis By Country

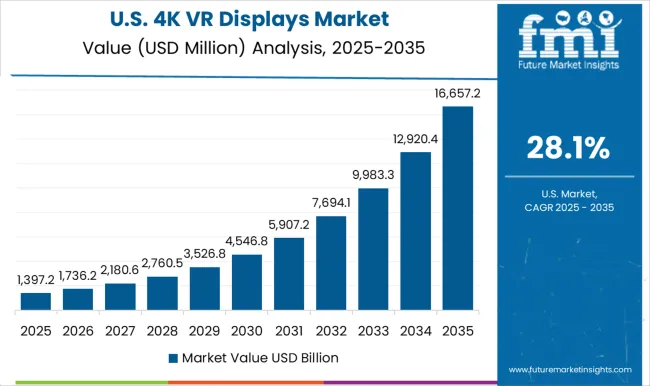
There Were a Large Number of Active Users of Virtual Reality (VR) Technology in USA Which Allows It to Be the Largest Market for 4K VR Displays Market

4k Vr Displays Market Country Value Analysis

There is huge number of virtual reality technology users present in the United States and number is also increasing day by day. People in USA has a high purchasing power and a large number of tech-savvy consumers, which increases the demand for high-end VR displays such as 4K VR displays.

The 4K VR displays market in the United States is expected to grow significantly in the coming years, owing to advancements in VR technology, increased use of VR in various industries, and rising demand for immersive gaming and entertainment experiences, all of which will drive the market in the coming years. The USA has highest market of 20.1% 4K VR displays market

China is Spending a Lot On VR and Display Technology for Enhancement of Technology Which Makes It Global Leader for 4K VR Displays

China is a significant player in the technology sector, China is home to a number of businesses engaged in the creation and development of virtual reality technology, including 4K VR displays.

The Chinese government has also made investments in the VR market in an effort to dominate the market of 4K VR Display worldwide. The Chinese market is a large and rapidly growing market for VR technology. China represents a significant opportunity for manufacturers and developers of VR technology.

However, the VR market in China is also highly competitive, with many domestic companies vying for market share. China Holds Highest CAGR of 28.1% in 4K VR displays market.

Escalating Digitization in India is facilitating the growth of 4K VR displays market.

The Indian market for 4K VR displays is relatively small, but it is expected to grow in the coming years. The increasing popularity of virtual reality and the advancements in technology are driving the demand for high-resolution VR displays.

Additionally, the Indian government's push for digitalization and the growing gaming industry are also expected to drive the growth of the 4K VR displays market in India.

Category wise Insights

Why Does The 4K VR Display Is Fastest Growing Application, For 4K VR Display Market?

There are several reasons why the smart TV application is growing in the 4K VR display market. One reason is that 4K resolution provides a clearer and more detailed picture, which enhances the overall viewing experience.

Additionally, the use of VR technology in smart TVs allows for a more immersive viewing experience, as it simulates a more realistic environment. As a result, more and more consumers are opting for smart TVs with 4K VR displays. Furthermore, the increase in streaming services and the availability of 4K content is also driving the growth of this market.

Triple Display Resolution Has Largest Market in The 4K VR Display Industry

The 4K VR (virtual reality) display market has a high market share for triple display resolution because it offers a more immersive and realistic experience for users. The high resolution allows for more detailed and lifelike images and the virtual reality aspect allows for a greater sense of presence and immersion in the content.

Additionally, advancements in technology have made 4K VR displays more affordable and accessible, contributing to their growing popularity and market share.
Competitive Landscape

4k Vr Displays Market Analysis By Company

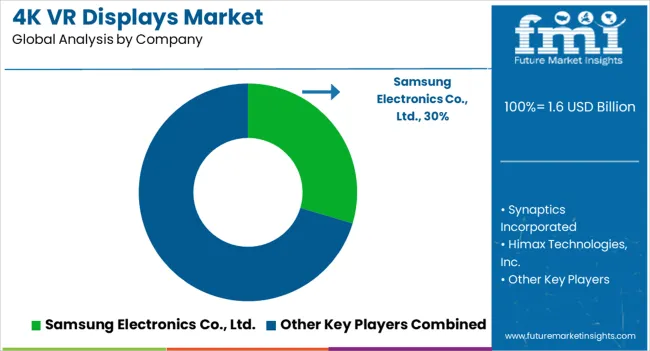
The 4K VR display market is extremely competitive, with several major players. These market leaders are widening their customer base to include customers from other countries. Major players are focusing mainly on the new product development and designing in the new triple display and 4D display to provide top-notch viewing experience to users.

  • In August 2024, Varjo, a pioneer in commercial-grade VR/XR hardware and software, revealed the closing of a $54 million series fundraising round. With the help of a group of investors, Varjo will be able to expand its business and provide cutting-edge technology to clients that need it to change the way they conduct business.
  • In January 2025, Synaptics announced that its design is behind the Lenovo Think Book Wireless Dock, the world's first truly wireless dock, enabling seamless wireless display connectivity.

Scope of report

Attribute Details
Market value in 2025 USD 1.6 billion
Market CAGR 2025 to 2035 14.9%
Share of top 5 players Around 35%
Forecast Period 2025 to 2035
Historical Data Available for 2020 to 2025
Market Analysis USD Billion for Value
Key Regions Covered North America; Latin America; Europe; South Asia & Pacific; East Asia and the Middle East & Africa
Key Countries Covered USA, Canada, Germany, UK, France, Italy, Spain, Russia, China, Japan, South Korea, India, Australia & New Zealand, GCC Countries, Turkey and South Africa
Key Segments Covered Display Resolution, Application, Region
Key Companies Profiled Samsung Electronics Co., Ltd.; Synaptics Incorporated; Himax Technologies, Inc.; Raydium Semiconductor Corporation; New Vision Display, Inc.; Varjo; Sony; DPVR
Report Coverage Market Forecast, Company Share Analysis, Competition Intelligence, DROT Analysis, Market Dynamics and Challenges, and Strategic Growth Initiatives
Customization & Pricing Available upon Request

4K VR displays by Category

By Display Resolution:

  • Single Display Resolution
  • Dual Display Resolution
  • Triple Display Resolution

By Application:

  • Smart phone
  • Smart watch
  • Smart TV
  • Others

By Region:

  • North America
  • Europe
  • Latin America
  • Asia Pacific
  • Middle East and Africa

Table of Content

  1. Executive Summary
    • Global Market Outlook
    • Demand-side Trends
    • Supply-side Trends
    • Technology Roadmap Analysis
    • Analysis and Recommendations
  2. Market Overview
    • Market Coverage / Taxonomy
    • Market Definition / Scope / Limitations
  3. Market Background
    • Market Dynamics
      • Drivers
      • Restraints
      • Opportunity
      • Trends
    • Scenario Forecast
      • Demand in Optimistic Scenario
      • Demand in Likely Scenario
      • Demand in Conservative Scenario
    • Opportunity Map Analysis
    • Product Life Cycle Analysis
    • Supply Chain Analysis
    • Investment Feasibility Matrix
    • Value Chain Analysis
    • PESTLE and Porter’s Analysis
    • Regulatory Landscape
    • Regional Parent Market Outlook
    • Production and Consumption Statistics
    • Import and Export Statistics
  4. Global Market Analysis 2020 to 2024 and Forecast, 2025 to 2035
    • Historical Market Size Value (USD Million) Analysis, 2020 to 2024
    • Current and Future Market Size Value (USD Million) Projections, 2025 to 2035
      • Y-o-Y Growth Trend Analysis
      • Absolute $ Opportunity Analysis
  5. Global Market Pricing Analysis 2020 to 2024 and Forecast 2025 to 2035
  6. Global Market Analysis 2020 to 2024 and Forecast 2025 to 2035, By Display Resolution
    • Introduction / Key Findings
    • Historical Market Size Value (USD Million) Analysis By Display Resolution , 2020 to 2024
    • Current and Future Market Size Value (USD Million) Analysis and Forecast By Display Resolution , 2025 to 2035
      • Single Display Resolution
      • Dual Display Resolution
      • Triple Display Resolution
    • Y-o-Y Growth Trend Analysis By Display Resolution , 2020 to 2024
    • Absolute $ Opportunity Analysis By Display Resolution , 2025 to 2035
  7. Global Market Analysis 2020 to 2024 and Forecast 2025 to 2035, By Application
    • Introduction / Key Findings
    • Historical Market Size Value (USD Million) Analysis By Application, 2020 to 2024
    • Current and Future Market Size Value (USD Million) Analysis and Forecast By Application, 2025 to 2035
      • Smart phone
      • Smart watch
      • Smart TV
      • Others
    • Y-o-Y Growth Trend Analysis By Application, 2020 to 2024
    • Absolute $ Opportunity Analysis By Application, 2025 to 2035
  8. Global Market Analysis 2020 to 2024 and Forecast 2025 to 2035, By Region
    • Introduction
    • Historical Market Size Value (USD Million) Analysis By Region, 2020 to 2024
    • Current Market Size Value (USD Million) Analysis and Forecast By Region, 2025 to 2035
      • North America
      • Latin America
      • Western Europe
      • Eastern Europe
      • East Asia
      • South Asia and Pacific
      • Middle East & Africa
    • Market Attractiveness Analysis By Region
  9. North America Market Analysis 2020 to 2024 and Forecast 2025 to 2035, By Country
    • Historical Market Size Value (USD Million) Trend Analysis By Market Taxonomy, 2020 to 2024
    • Market Size Value (USD Million) Forecast By Market Taxonomy, 2025 to 2035
      • By Country
        • USA
        • Canada
        • Mexico
      • By Display Resolution
      • By Application
    • Market Attractiveness Analysis
      • By Country
      • By Display Resolution
      • By Application
    • Key Takeaways
  10. Latin America Market Analysis 2020 to 2024 and Forecast 2025 to 2035, By Country
    • Historical Market Size Value (USD Million) Trend Analysis By Market Taxonomy, 2020 to 2024
    • Market Size Value (USD Million) Forecast By Market Taxonomy, 2025 to 2035
      • By Country
        • Brazil
        • Chile
        • Rest of Latin America
      • By Display Resolution
      • By Application
    • Market Attractiveness Analysis
      • By Country
      • By Display Resolution
      • By Application
    • Key Takeaways
  11. Western Europe Market Analysis 2020 to 2024 and Forecast 2025 to 2035, By Country
    • Historical Market Size Value (USD Million) Trend Analysis By Market Taxonomy, 2020 to 2024
    • Market Size Value (USD Million) Forecast By Market Taxonomy, 2025 to 2035
      • By Country
        • Germany
        • UK
        • Italy
        • Spain
        • France
        • Nordic
        • BENELUX
        • Rest of Western Europe
      • By Display Resolution
      • By Application
    • Market Attractiveness Analysis
      • By Country
      • By Display Resolution
      • By Application
    • Key Takeaways
  12. Eastern Europe Market Analysis 2020 to 2024 and Forecast 2025 to 2035, By Country
    • Historical Market Size Value (USD Million) Trend Analysis By Market Taxonomy, 2020 to 2024
    • Market Size Value (USD Million) Forecast By Market Taxonomy, 2025 to 2035
      • By Country
        • Russia
        • Poland
        • Hungary
        • Balkan & Baltic
        • Rest of Eastern Europe
      • By Display Resolution
      • By Application
    • Market Attractiveness Analysis
      • By Country
      • By Display Resolution
      • By Application
    • Key Takeaways
  13. East Asia Market Analysis 2020 to 2024 and Forecast 2025 to 2035, By Country
    • Historical Market Size Value (USD Million) Trend Analysis By Market Taxonomy, 2020 to 2024
    • Market Size Value (USD Million) Forecast By Market Taxonomy, 2025 to 2035
      • By Country
        • China
        • Japan
        • South Korea
      • By Display Resolution
      • By Application
    • Market Attractiveness Analysis
      • By Country
      • By Display Resolution
      • By Application
    • Key Takeaways
  14. South Asia and Pacific Market Analysis 2020 to 2024 and Forecast 2025 to 2035, By Country
    • Historical Market Size Value (USD Million) Trend Analysis By Market Taxonomy, 2020 to 2024
    • Market Size Value (USD Million) Forecast By Market Taxonomy, 2025 to 2035
      • By Country
        • India
        • ASEAN
        • Australia & New Zealand
        • Rest of South Asia and Pacific
      • By Display Resolution
      • By Application
    • Market Attractiveness Analysis
      • By Country
      • By Display Resolution
      • By Application
    • Key Takeaways
  15. Middle East & Africa Market Analysis 2020 to 2024 and Forecast 2025 to 2035, By Country
    • Historical Market Size Value (USD Million) Trend Analysis By Market Taxonomy, 2020 to 2024
    • Market Size Value (USD Million) Forecast By Market Taxonomy, 2025 to 2035
      • By Country
        • Kingdom of Saudi Arabia
        • Other GCC Countries
        • Turkiye
        • South Africa
        • Other African Union
        • Rest of Middle East & Africa
      • By Display Resolution
      • By Application
    • Market Attractiveness Analysis
      • By Country
      • By Display Resolution
      • By Application
    • Key Takeaways
  16. Key Countries Market Analysis
    • USA
      • Pricing Analysis
      • Market Share Analysis, 2024
        • By Display Resolution
        • By Application
    • Canada
      • Pricing Analysis
      • Market Share Analysis, 2024
        • By Display Resolution
        • By Application
    • Mexico
      • Pricing Analysis
      • Market Share Analysis, 2024
        • By Display Resolution
        • By Application
    • Brazil
      • Pricing Analysis
      • Market Share Analysis, 2024
        • By Display Resolution
        • By Application
    • Chile
      • Pricing Analysis
      • Market Share Analysis, 2024
        • By Display Resolution
        • By Application
    • Germany
      • Pricing Analysis
      • Market Share Analysis, 2024
        • By Display Resolution
        • By Application
    • UK
      • Pricing Analysis
      • Market Share Analysis, 2024
        • By Display Resolution
        • By Application
    • Italy
      • Pricing Analysis
      • Market Share Analysis, 2024
        • By Display Resolution
        • By Application
    • Spain
      • Pricing Analysis
      • Market Share Analysis, 2024
        • By Display Resolution
        • By Application
    • France
      • Pricing Analysis
      • Market Share Analysis, 2024
        • By Display Resolution
        • By Application
    • India
      • Pricing Analysis
      • Market Share Analysis, 2024
        • By Display Resolution
        • By Application
    • ASEAN
      • Pricing Analysis
      • Market Share Analysis, 2024
        • By Display Resolution
        • By Application
    • Australia & New Zealand
      • Pricing Analysis
      • Market Share Analysis, 2024
        • By Display Resolution
        • By Application
    • China
      • Pricing Analysis
      • Market Share Analysis, 2024
        • By Display Resolution
        • By Application
    • Japan
      • Pricing Analysis
      • Market Share Analysis, 2024
        • By Display Resolution
        • By Application
    • South Korea
      • Pricing Analysis
      • Market Share Analysis, 2024
        • By Display Resolution
        • By Application
    • Russia
      • Pricing Analysis
      • Market Share Analysis, 2024
        • By Display Resolution
        • By Application
    • Poland
      • Pricing Analysis
      • Market Share Analysis, 2024
        • By Display Resolution
        • By Application
    • Hungary
      • Pricing Analysis
      • Market Share Analysis, 2024
        • By Display Resolution
        • By Application
    • Kingdom of Saudi Arabia
      • Pricing Analysis
      • Market Share Analysis, 2024
        • By Display Resolution
        • By Application
    • Turkiye
      • Pricing Analysis
      • Market Share Analysis, 2024
        • By Display Resolution
        • By Application
    • South Africa
      • Pricing Analysis
      • Market Share Analysis, 2024
        • By Display Resolution
        • By Application
  17. Market Structure Analysis
    • Competition Dashboard
    • Competition Benchmarking
    • Market Share Analysis of Top Players
      • By Regional
      • By Display Resolution
      • By Application
  18. Competition Analysis
    • Competition Deep Dive
      • Samsung Electronics Co., Ltd.
        • Overview
        • Product Portfolio
        • Profitability by Market Segments (Product/Age /Sales Channel/Region)
        • Sales Footprint
        • Strategy Overview
          • Marketing Strategy
          • Product Strategy
          • Channel Strategy
      • Synaptics Incorporated
      • Himax Technologies, Inc.
      • Raydium Semiconductor Corporation
      • New Vision Display, Inc.
      • Varjo
      • Sony
      • DPVR
  19. Assumptions & Acronyms Used
  20. Research Methodology

List of Tables

  • Table 1: Global Market Value (USD Million) Forecast by Region, 2020-2035
  • Table 2: Global Market Value (USD Million) Forecast by Display Resolution , 2020-2035
  • Table 3: Global Market Value (USD Million) Forecast by Application, 2020-2035
  • Table 4: North America Market Value (USD Million) Forecast by Country, 2020-2035
  • Table 5: North America Market Value (USD Million) Forecast by Display Resolution , 2020-2035
  • Table 6: North America Market Value (USD Million) Forecast by Application, 2020-2035
  • Table 7: Latin America Market Value (USD Million) Forecast by Country, 2020-2035
  • Table 8: Latin America Market Value (USD Million) Forecast by Display Resolution , 2020-2035
  • Table 9: Latin America Market Value (USD Million) Forecast by Application, 2020-2035
  • Table 10: Western Europe Market Value (USD Million) Forecast by Country, 2020-2035
  • Table 11: Western Europe Market Value (USD Million) Forecast by Display Resolution , 2020-2035
  • Table 12: Western Europe Market Value (USD Million) Forecast by Application, 2020-2035
  • Table 13: Eastern Europe Market Value (USD Million) Forecast by Country, 2020-2035
  • Table 14: Eastern Europe Market Value (USD Million) Forecast by Display Resolution , 2020-2035
  • Table 15: Eastern Europe Market Value (USD Million) Forecast by Application, 2020-2035
  • Table 16: East Asia Market Value (USD Million) Forecast by Country, 2020-2035
  • Table 17: East Asia Market Value (USD Million) Forecast by Display Resolution , 2020-2035
  • Table 18: East Asia Market Value (USD Million) Forecast by Application, 2020-2035
  • Table 19: South Asia and Pacific Market Value (USD Million) Forecast by Country, 2020-2035
  • Table 20: South Asia and Pacific Market Value (USD Million) Forecast by Display Resolution , 2020-2035
  • Table 21: South Asia and Pacific Market Value (USD Million) Forecast by Application, 2020-2035
  • Table 22: Middle East & Africa Market Value (USD Million) Forecast by Country, 2020-2035
  • Table 23: Middle East & Africa Market Value (USD Million) Forecast by Display Resolution , 2020-2035
  • Table 24: Middle East & Africa Market Value (USD Million) Forecast by Application, 2020-2035

List of Figures

  • Figure 1: Global Market Pricing Analysis
  • Figure 2: Global Market Value (USD Million) Forecast 2020-2035
  • Figure 3: Global Market Value (USD Million) Share and BPS Analysis by Region, 2025 and 2035
  • Figure 4: Global Market Y-o-Y Growth Comparison by Region, 2025-2035
  • Figure 5: Global Market Attractiveness Analysis by Region
  • Figure 6: North America Market Incremental Dollar Opportunity, 2025-2035
  • Figure 7: Latin America Market Incremental Dollar Opportunity, 2025-2035
  • Figure 8: Western Europe Market Incremental Dollar Opportunity, 2025-2035
  • Figure 9: Eastern Europe Market Incremental Dollar Opportunity, 2025-2035
  • Figure 10: East Asia Market Incremental Dollar Opportunity, 2025-2035
  • Figure 11: South Asia and Pacific Market Incremental Dollar Opportunity, 2025-2035
  • Figure 12: Middle East & Africa Market Incremental Dollar Opportunity, 2025-2035
  • Figure 13: North America Market Value Share and BPS Analysis by Country, 2025 and 2035
  • Figure 14: Latin America Market Value Share and BPS Analysis by Country, 2025 and 2035
  • Figure 15: Western Europe Market Value Share and BPS Analysis by Country, 2025 and 2035
  • Figure 16: Eastern Europe Market Value Share and BPS Analysis by Country, 2025 and 2035
  • Figure 17: East Asia Market Value Share and BPS Analysis by Country, 2025 and 2035
  • Figure 18: South Asia and Pacific Market Value Share and BPS Analysis by Country, 2025 and 2035
  • Figure 19: Middle East & Africa Market Value Share and BPS Analysis by Country, 2025 and 2035
  • Figure 20: Global Market - Tier Structure Analysis
  • Figure 21: Global Market - Company Share Analysis

Frequently Asked Questions

How big is the 4k vr displays market in 2025?

The global 4k vr displays market is estimated to be valued at USD 1.6 billion in 2025.

What will be the size of 4k vr displays market in 2035?

The market size for the 4k vr displays market is projected to reach USD 28.3 billion by 2035.

How much will be the 4k vr displays market growth between 2025 and 2035?

The 4k vr displays market is expected to grow at a 33.1% CAGR between 2025 and 2035.

What are the key product types in the 4k vr displays market?

The key product types in 4k vr displays market are single display resolution, dual display resolution and triple display resolution.

Which application segment to contribute significant share in the 4k vr displays market in 2025?

In terms of application, smart phone segment to command 62.8% share in the 4k vr displays market in 2025.

Explore Similar Insights

Future Market Insights

4K VR Displays Market

Chat With

MaRIA

Hi There, I am MaRIA, Your Market Research Intelligence Assistant. How may I help you?