Custom Display Packaging Market Size, Share & Forecast Outlook 2025 to 2035

The global custom display packaging market is poised for consistent growth, with its value expected to increase from USD 24.7 billion in 2025 to USD 39.7 billion by 2035. This growth trajectory reflects a CAGR of 5.6% over the forecast period.
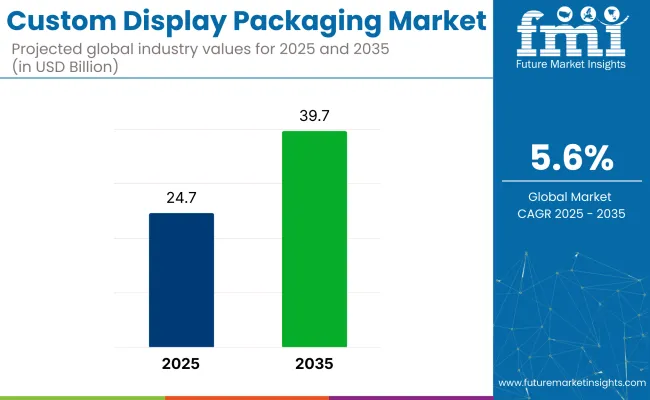
Quick Stats for the Custom Display Packaging Market

  • Market Value (2025): USD 24.7 billion
  • Forecast Value (2035): USD 39.7 billion
  • Forecast CAGR: 5.6%
  • Leading Segment in 2025: Paper and paperboard(62.5% share)
  • Key Growth Region: Asia Pacific (China 6.2% CAGR)
  • Top Key Players: AlphaGlobal Packaging, Amcor plc, CustomBoxline, DS Smith, Graphic Packaging International, LLC.

Custom Display Packaging Market

The market, valued at USD 23.4 billion in 2024, continues to gain momentum as businesses seek more visually appealing and functional packaging to differentiate their products and improve consumer engagement, particularly in retail and e-commerce environments.

As of 2025, the custom display packaging market occupies a niche yet valuable share across its broader parent markets. Within the global packaging market, it accounts for approximately 1-2%, as it focuses primarily on promotional and retail-facing formats. In the global retail packaging market, its share is higher at around 5-7%, driven by demand for in-store branding and shelf impact.

Within the point-of-sale (POS) display market, custom display packaging holds a significant 25-30%, as it plays a central role in visual merchandising and impulse purchases. In the corrugated and paperboard packaging segment, it contributes about 3-5%, due to widespread use in folding cartons and counter displays. In the consumer goods packaging market, its share is estimated at 4-6%, particularly for FMCG and promotional campaigns.

"We see this in the rate of adoption of some of the sustainable packaging solutions we have developed, where our customers and ultimately the end consumer have been reluctant to make the change due to cost considerations,"Mondi CEO Andrew King.This sustainability trend is not only a compliance necessity but also a competitive advantage, as brands that demonstrate environmental responsibility are more likely to earn customer trust and loyalty.

Custom Display Packaging Market Analyzed by Top Investment Segments

Floor stand displays lead the custom display packaging market due to their effectiveness in high-traffic retail areas and versatility across product categories. Paper and paperboard dominate as preferred materials, driven by sustainability and cost-efficiency. The food and beverage sector remains the largest end-user, relying heavily on visually appealing packaging to boost product visibility and consumer engagement.

By Packaging Type, Floor Stand Displays Segment Accounts for Over 33.8% Market Share

Floor stand displays are projected to hold the largest share of the custom display packaging market, accounting for 33.8% of the total market value in 2025. This dominance is primarily driven by their strategic placement in high-footfall retail areas, where they serve both as a promotional tool and a functional product holder.

  • Retailers continue to favor floor stand displays for their flexibility in showcasing a wide variety of products, from food and beverages to electronics and cosmetics.
  • The increasing focus on in-store marketing and product differentiation, combined with their cost-effective design and ease of assembly, further boosts demand.

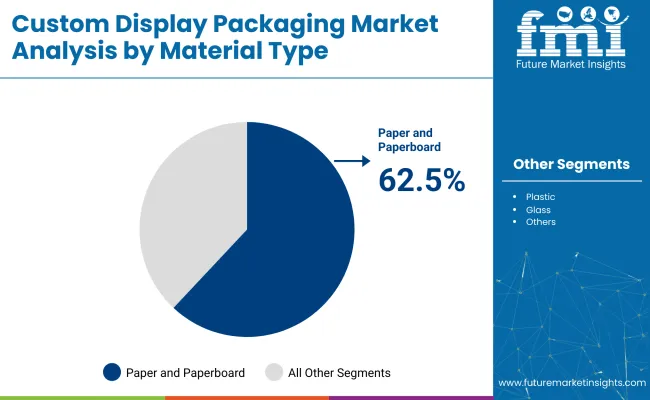
Paper and Paper board Leads Material Type Segment with 62.5% Share

Paper and paperboard are expected to dominate the custom display packaging market, accounting for approximately 62.5% market share in 2025. This material type leads due to its eco-friendly nature, cost-effectiveness, and versatility in printing and structural design.
  • Paper and paperboard are not only biodegradable and recyclable but also provide excellent surfaces for high-quality graphics, making them ideal for retail displays that aim to attract customer attention.
  • The growing pressure from regulatory bodies to reduce plastic use and the increasing adoption of circular economy principles are further accelerating the demand for paper and paperboard packaging in both developed and emerging markets.

Custom Display Packaging Market Analysis By Material Type

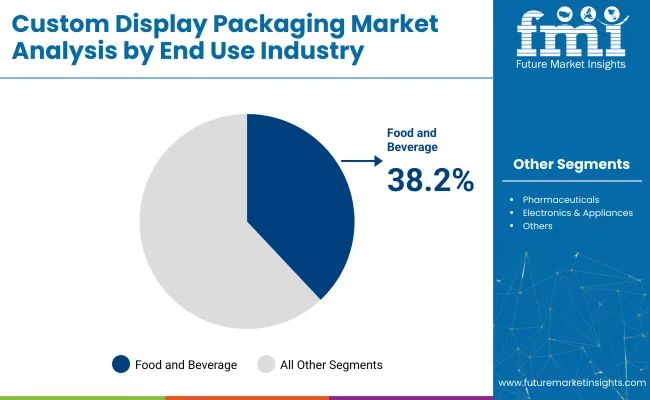
Food and Beverage to be the major End User with 38.2% Share

The food and beverage industry is projected to be the dominant end-use segment in the custom display packaging market, holding a market share of 38.2% in 2025. This strong position is driven by the sector's high demand for visually appealing and functional packaging solutions that enhance product visibility in retail environments.
  • As competition among brands intensifies and point-of-sale marketing becomes increasingly important, food and beverage companies are turning to custom display packaging to attract consumer attention and encourage impulse purchases.
  • The rise of packaged and convenience foods, along with the expansion of supermarkets and hypermarkets in emerging markets, is contributing to the sustained demand for innovative display packaging in this segment.

Custom Display Packaging Market Analysis By End Use Industry

Top Custom Display Packaging Market Dynamics

The rapid growth of e-commerce and organized retail is driving demand for eye-catching custom display packaging that enhances product visibility and the unboxing experience. Simultaneously, increasing consumer preference and regulatory pressure for sustainable, eco-friendly materials are pushing manufacturers to adopt greener packaging solutions.

Growing Influence of E-commerce and Retail Branding

The rapid expansion of e-commerce and organized retail is one of the most significant drivers shaping the custom display packaging market. As consumer shopping behavior shifts toward online platforms and large retail chains, brands are investing heavily in distinctive and attractive packaging that enhances product visibility both on physical shelves and digital listings.

Custom display packaging, especially that designed with vivid graphics and interactive elements, plays a crucial role in attracting attention, boosting product recognition, and encouraging impulse purchases. In addition, the unboxing experience has become an extension of brand identity in the e-commerce space, prompting companies to innovate in packaging design to create memorable customer experiences.

Shift Toward Sustainable and Eco-friendly Packaging Solutions

Environmental concerns and regulatory pressures are driving a notable shift toward sustainable packaging materials, making sustainability a central dynamic in the custom display packaging market. Consumers are increasingly favoring brands that use recyclable, biodegradable, or reusable packaging solutions, pushing manufacturers to transition away from plastics and toward eco-friendly options like paperboard and recycled cardboard.

Additionally, governments across the globe are enforcing stricter regulations on packaging waste and carbon emissions, prompting companies to adopt greener practices in their supply chains.
Analyzing Top Countries Manufacturing, Distributing, and Supplying Custom Display Packaging Solutions

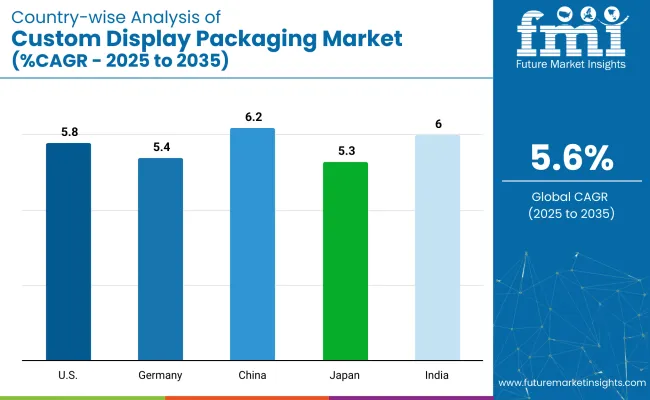
Country Wise Analysis Of Custom Display Packaging Market Cagr 2025 To 2035

Countries CAGR (%)
USA 5.8%
Germany 5.4%
China 6.2%
Japan 5.3%
India 6.0%

The custom display packaging market is expected to be driven by the rapid expansion of e-commerce and growing consumer demand for sustainable packaging solutions. Rapid growth in China and India is anticipated due to increasing retail modernization and rising disposable incomes, while the USA and Germany focus on technological innovations and eco-friendly materials to enhance brand differentiation and meet regulatory standards.

Growth Analysis of Custom Display Packaging Market in the USA

The USA custom display packaging market is estimated to grow at a CAGR of 5.8% during the study period from 2025 to 2035.

  • Growth in the USA is largely driven by the robust expansion of e-commerce and organized retail sectors, which demand innovative and visually appealing packaging to stand out in a competitive marketplace. Additionally, strong consumer preference for sustainable packaging solutions is prompting brands to adopt eco-friendly materials and designs.
  • The rise in health-conscious and premium product segments also fuels demand for high-quality custom displays that enhance brand differentiation and shopper engagement.

Demand Forecast for Custom Display Packaging Market in China

The China custom display packaging market is expected to grow at a CAGR of 6.2% between 2025 and 2035.

  • Rapid urbanization, increasing disposable incomes, and the expansion of modern retail formats such as supermarkets and specialty stores contribute to this growth. China’s booming e-commerce sector, coupled with heightened consumer awareness of brand aesthetics and sustainability, has increased demand for custom display packaging.
  • Local manufacturers are investing in advanced printing and packaging technologies, enabling more innovative and environmentally friendly solutions to meet evolving market needs.

Analysis of Sales of Custom Display Packaging Systems in Germany

The German custom display packaging market is projected to expand at a CAGR of 5.4% during the forecast period.

  • The country’s strong industrial base and focus on sustainability drive the demand for recyclable and biodegradable packaging materials. German consumers tend to favor premium and eco-conscious brands, influencing manufacturers to enhance packaging aesthetics and environmental performance.
  • Germany’s well-established retail infrastructure supports the deployment of custom displays that improve product visibility and shopper experience in hypermarkets and specialty stores.

Growth Analysis and Forecast for Japan Custom Display Packaging Market

The Japan custom display packaging market is estimated to grow at a CAGR of 5.3% from 2025 to 2035.

  • Japan’s growth is propelled by the increasing demand for personalized and aesthetically appealing packaging to cater to its sophisticated consumer base. The country’s emphasis on technological innovation facilitates the development of advanced packaging solutions that enhance product protection and visual appeal.
  • Japan’s stringent environmental regulations encourage the adoption of sustainable materials, reinforcing market growth in custom display packaging.

Demand Forecast Analysis for Custom Display Packaging Market in India

The India custom display packaging market is expected to grow at a CAGR of 6.0% over the forecast period.

  • India’s rapid economic growth, expanding middle class, and rising internet penetration are key growth drivers. The proliferation of organized retail and e-commerce platforms boosts the demand for attractive, durable packaging that improves brand recall and consumer engagement.
  • Increasing awareness of sustainability and government initiatives promoting eco-friendly packaging are encouraging manufacturers to innovate and adopt greener packaging solutions.

Leading Suppliers in the Custom Display Packaging Market

Key players like AlphaGlobal Packaging and Amcor plc dominate the custom display packaging market due to their innovative and sustainable packaging solutions. AlphaGlobal Packaging specializes in eco-friendly designs that enhance brand visibility, while Amcor plc leverages advanced printing technologies to create visually striking displays.

Other significant players, including DS Smith, International Paper, and Smurfit Kappa, focus on providing versatile and cost-effective packaging options for diverse industries. Emerging companies like PakFactory and Ibex Packaging target niche markets with customized, high-quality display solutions, catering to specific brand and consumer requirements.

Recent Custom Display Packaging Industry News

  • In October 2024, DS Smith was acquired by International Paper for USD 7.2 billion. This acquisition expands International Paper’s footprint in Europe and strengthens its portfolio in lightweight, fiber-based, and display packaging solution.

Research Coverage and Scope Summary

Report Attributes Details
Current Total Market Size (2025) USD 24.7 billion
Projected Market Size (2035) USD 39.7 billion
CAGR (2025 to 2035) 5.6%
Base Year for Estimation 2024
Historical Period 2020 to 2024
Projections Period 2025 to 2035
Quantitative Units USD billion for value and volume in tons
Packaging Type Analyzed (Segment 1) Counter & Pop-Up Display Boxes, Floor Stand Displays, Pallet Displays, Endcap Displays, And Transparent Packaging
Material Type Covered (Segment 2) Plastic, Paper & Paperboard, Glass, Metal, And Others.
End Use Industry Covered (Segment 3) Food & Beverage, Cosmetics & Personal Care, Pharmaceuticals, Electronics & Appliances, And Others.
Regions Covered North America, Western Europe, East Asia, South Asia
Countries Covered United States; Canada; United Kingdom; Germany; France; Italy; Spain; Netherlands; China; Japan; South Korea; India; Pakistan; Bangladesh
Key Players Influencing the Market AlphaGlobal Packaging, Amcor plc, CustomBoxline, DS Smith, Graphic Packaging International, LLC, Ibex Packaging, International Paper, Mondi Group, Orora Visual, Packaging Corporation of America, PakFactory, Rengo Co., Salazar Packaging, Smurfit Kappa, Stora Enso, and WestRock Company.
Additional Attributes Dollar sales, market share, growth rates, key segments, top materials, competitive landscape, regional demand, consumer trends, sustainability impact, pricing strategies, and emerging opportunities to optimize production and marketing strategies.

Leading Players in the Custom Display Packaging Industry

  • AlphaGlobal Packaging
  • Amcor plc
  • CustomBoxline
  • DS Smith
  • Graphic Packaging International, LLC,
  • Ibex Packaging
  • International Paper
  • Mondi Group
  • Orora Visual
  • Packaging Corporation of America
  • PakFactory
  • Rengo Co.
  • Salazar Packaging
  • Smurfit Kappa
  • Stora Enso
  • WestRock Company

Custom Display Packaging Market Analyzed by Key Investment Segments

By Packaging Type:

The market is segmented into counter & pop-up display boxes, floor stand displays, pallet displays, endcap displays, and transparent packaging.

By Material Type:

The market covers plastic, paper & paperboard, glass, metal, flexible, and others.

By End Use Industry:

The market is categorized into food & beverage, cosmetics & personal care, pharmaceuticals, electronics & appliances, and others.

By Region:

The market spans North America, Western Europe, East Asia, and South Asia.

Table of Content

  1. Executive Summary
    • Global Market Outlook
    • Demand-side Trends
    • Supply-side Trends
    • Technology Roadmap Analysis
    • Analysis and Recommendations
  2. Market Overview
    • Market Coverage / Taxonomy
    • Market Definition / Scope / Limitations
  3. Market Background
    • Market Dynamics
      • Drivers
      • Restraints
      • Opportunity
      • Trends
    • Scenario Forecast
      • Demand in Optimistic Scenario
      • Demand in Likely Scenario
      • Demand in Conservative Scenario
    • Opportunity Map Analysis
    • Product Life Cycle Analysis
    • Supply Chain Analysis
      • Supply Side Participants and their Roles
        • Producers
        • Mid-Level Participants (Traders/ Agents/ Brokers)
        • Wholesalers and Distributors
      • Value Added and Value Created at Node in the Supply Chain
      • List of Raw Material Suppliers
      • List of Existing and Potential Buyer’s
    • Investment Feasibility Matrix
    • Value Chain Analysis
      • Profit Margin Analysis
      • Wholesalers and Distributors
      • Retailers
    • PESTLE and Porter’s Analysis
    • Regulatory Landscape
      • By Key Regions
      • By Key Countries
    • Regional Parent Market Outlook
    • Production and Consumption Statistics
    • Import and Export Statistics
  4. Global Market Analysis 2020 to 2024 and Forecast, 2025 to 2035
    • Historical Market Size Value (USD Billion) & Volume (tons) Analysis, 2020 to 2024
    • Current and Future Market Size Value (USD Billion) & Volume (tons) Projections, 2025 to 2035
      • Y-o-Y Growth Trend Analysis
      • Absolute $ Opportunity Analysis
  5. Global Market Pricing Analysis 2020 to 2024 and Forecast 2025 to 2035
  6. Global Market Analysis 2020 to 2024 and Forecast 2025 to 2035, By Packaging Type
    • Introduction / Key Findings
    • Historical Market Size Value (USD Billion) & Volume (tons) Analysis By Packaging Type, 2020 to 2024
    • Current and Future Market Size Value (USD Billion) & Volume (tons) Analysis and Forecast By Packaging Type, 2025 to 2035
      • Counter & pop-up display boxes
      • Floor stand displays
      • Pallet displays
      • Endcap displays
      • Transparent packaging
    • Y-o-Y Growth Trend Analysis By Packaging Type, 2020 to 2024
    • Absolute $ Opportunity Analysis By Packaging Type, 2025 to 2035
  7. Global Market Analysis 2020 to 2024 and Forecast 2025 to 2035, By Material Type
    • Introduction / Key Findings
    • Historical Market Size Value (USD Billion) & Volume (tons) Analysis By Material Type, 2020 to 2024
    • Current and Future Market Size Value (USD Billion) & Volume (tons) Analysis and Forecast By Material Type, 2025 to 2035
      • Plastic
      • Paper & paperboard
      • Glass
      • Metal
      • Flexible
      • Others
    • Y-o-Y Growth Trend Analysis By Material Type, 2020 to 2024
    • Absolute $ Opportunity Analysis By Material Type, 2025 to 2035
  8. Global Market Analysis 2020 to 2024 and Forecast 2025 to 2035, By End Use Industry
    • Introduction / Key Findings
    • Historical Market Size Value (USD Billion) & Volume (tons) Analysis By End Use Industry, 2020 to 2024
    • Current and Future Market Size Value (USD Billion) & Volume (tons) Analysis and Forecast By End Use Industry, 2025 to 2035
      • Food & beverage
      • Cosmetics & personal care
      • Pharmaceuticals
      • Electronics & appliances
      • Others
    • Y-o-Y Growth Trend Analysis By End Use Industry, 2020 to 2024
    • Absolute $ Opportunity Analysis By End Use Industry, 2025 to 2035
  9. Global Market Analysis 2020 to 2024 and Forecast 2025 to 2035, By Region
    • Introduction
    • Historical Market Size Value (USD Billion) & Volume (tons) Analysis By Region, 2020 to 2024
    • Current Market Size Value (USD Billion) & Volume (tons) Analysis and Forecast By Region, 2025 to 2035
      • North America
      • Latin America
      • Western Europe
      • Eastern Europe
      • East Asia
      • South Asia & Pacific
      • Middle East and Africa
    • Market Attractiveness Analysis By Region
  10. North America Market Analysis 2020 to 2024 and Forecast 2025 to 2035, By Country
    • Historical Market Size Value (USD Billion) & Volume (tons) Trend Analysis By Market Taxonomy, 2020 to 2024
    • Market Size Value (USD Billion) & Volume (tons) Forecast By Market Taxonomy, 2025 to 2035
      • By Country
        • USA
        • Canada
        • Mexico
      • By Packaging Type
      • By Material Type
      • By End Use Industry
    • Market Attractiveness Analysis
      • By Country
      • By Packaging Type
      • By Material Type
      • By End Use Industry
    • Key Takeaways
  11. Latin America Market Analysis 2020 to 2024 and Forecast 2025 to 2035, By Country
    • Historical Market Size Value (USD Billion) & Volume (tons) Trend Analysis By Market Taxonomy, 2020 to 2024
    • Market Size Value (USD Billion) & Volume (tons) Forecast By Market Taxonomy, 2025 to 2035
      • By Country
        • Brazil
        • Argentina
        • Rest of LATAM
      • By Packaging Type
      • By Material Type
      • By End Use Industry
    • Market Attractiveness Analysis
      • By Country
      • By Packaging Type
      • By Material Type
      • By End Use Industry
    • Key Takeaways
  12. Western Europe Market Analysis 2020 to 2024 and Forecast 2025 to 2035, By Country
    • Historical Market Size Value (USD Billion) & Volume (tons) Trend Analysis By Market Taxonomy, 2020 to 2024
    • Market Size Value (USD Billion) & Volume (tons) Forecast By Market Taxonomy, 2025 to 2035
      • By Country
        • Germany
        • Italy
        • France
        • UK
        • Spain
        • BENELUX
        • Nordic
        • Rest of W.Europe
      • By Packaging Type
      • By Material Type
      • By End Use Industry
    • Market Attractiveness Analysis
      • By Country
      • By Packaging Type
      • By Material Type
      • By End Use Industry
    • Key Takeaways
  13. Eastern Europe Market Analysis 2020 to 2024 and Forecast 2025 to 2035, By Country
    • Historical Market Size Value (USD Billion) & Volume (tons) Trend Analysis By Market Taxonomy, 2020 to 2024
    • Market Size Value (USD Billion) & Volume (tons) Forecast By Market Taxonomy, 2025 to 2035
      • By Country
        • Russia
        • Hungary
        • Poland
        • Balkan & Baltics
        • Rest of E. Europe
      • By Packaging Type
      • By Material Type
      • By End Use Industry
    • Market Attractiveness Analysis
      • By Country
      • By Packaging Type
      • By Material Type
      • By End Use Industry
    • Key Takeaways
  14. East Asia Market Analysis 2020 to 2024 and Forecast 2025 to 2035, By Country
    • Historical Market Size Value (USD Billion) & Volume (tons) Trend Analysis By Market Taxonomy, 2020 to 2024
    • Market Size Value (USD Billion) & Volume (tons) Forecast By Market Taxonomy, 2025 to 2035
      • By Country
        • China
        • Japan
        • South Korea
      • By Packaging Type
      • By Material Type
      • By End Use Industry
    • Market Attractiveness Analysis
      • By Country
      • By Packaging Type
      • By Material Type
      • By End Use Industry
    • Key Takeaways
  15. South Asia & Pacific Market Analysis 2020 to 2024 and Forecast 2025 to 2035, By Country
    • Historical Market Size Value (USD Billion) & Volume (tons) Trend Analysis By Market Taxonomy, 2020 to 2024
    • Market Size Value (USD Billion) & Volume (tons) Forecast By Market Taxonomy, 2025 to 2035
      • By Country
        • India
        • Australia & New Zealand
        • ASEAN
        • Rest of SAP
      • By Packaging Type
      • By Material Type
      • By End Use Industry
    • Market Attractiveness Analysis
      • By Country
      • By Packaging Type
      • By Material Type
      • By End Use Industry
    • Key Takeaways
  16. Middle East and Africa Market Analysis 2020 to 2024 and Forecast 2025 to 2035, By Country
    • Historical Market Size Value (USD Billion) & Volume (tons) Trend Analysis By Market Taxonomy, 2020 to 2024
    • Market Size Value (USD Billion) & Volume (tons) Forecast By Market Taxonomy, 2025 to 2035
      • By Country
        • GCC Countries
        • Northern Africa
        • South Africa
        • Turkiye
        • Rest of MEA
      • By Packaging Type
      • By Material Type
      • By End Use Industry
    • Market Attractiveness Analysis
      • By Country
      • By Packaging Type
      • By Material Type
      • By End Use Industry
    • Key Takeaways
  17. Key Countries Market Analysis
    • USA
      • Pricing Analysis
      • Market Share Analysis, 2024
        • By Packaging Type
        • By Material Type
        • By End Use Industry
    • Canada
      • Pricing Analysis
      • Market Share Analysis, 2024
        • By Packaging Type
        • By Material Type
        • By End Use Industry
    • Brazil
      • Pricing Analysis
      • Market Share Analysis, 2024
        • By Packaging Type
        • By Material Type
        • By End Use Industry
    • Mexico
      • Pricing Analysis
      • Market Share Analysis, 2024
        • By Packaging Type
        • By Material Type
        • By End Use Industry
    • Argentina
      • Pricing Analysis
      • Market Share Analysis, 2024
        • By Packaging Type
        • By Material Type
        • By End Use Industry
  18. Market Structure Analysis
    • Competition Dashboard
    • Competition Benchmarking
    • Market Share Analysis of Top Players
      • By Regional
      • By Packaging Type
      • By Material Type
      • By End Use Industry
  19. Competition Analysis
    • Competition Deep Dive
      • alphaglobalpackaging
        • Overview
        • Product Portfolio
        • Profitability by Market Segments (Product/Age /Sales Channel/Region)
        • Sales Footprint
        • Strategy Overview
          • Marketing Strategy
          • Product Strategy
          • Channel Strategy
      • Amcor plc
        • Overview
        • Product Portfolio
        • Profitability by Market Segments (Product/Age /Sales Channel/Region)
        • Sales Footprint
        • Strategy Overview
          • Marketing Strategy
          • Product Strategy
          • Channel Strategy
      • CustomBoxline
        • Overview
        • Product Portfolio
        • Profitability by Market Segments (Product/Age /Sales Channel/Region)
        • Sales Footprint
        • Strategy Overview
          • Marketing Strategy
          • Product Strategy
          • Channel Strategy
      • DS Smith
        • Overview
        • Product Portfolio
        • Profitability by Market Segments (Product/Age /Sales Channel/Region)
        • Sales Footprint
        • Strategy Overview
          • Marketing Strategy
          • Product Strategy
          • Channel Strategy
      • Graphic Packaging International, LLC
        • Overview
        • Product Portfolio
        • Profitability by Market Segments (Product/Age /Sales Channel/Region)
        • Sales Footprint
        • Strategy Overview
          • Marketing Strategy
          • Product Strategy
          • Channel Strategy
      • Ibex Packaging
        • Overview
        • Product Portfolio
        • Profitability by Market Segments (Product/Age /Sales Channel/Region)
        • Sales Footprint
        • Strategy Overview
          • Marketing Strategy
          • Product Strategy
          • Channel Strategy
      • International Paper
        • Overview
        • Product Portfolio
        • Profitability by Market Segments (Product/Age /Sales Channel/Region)
        • Sales Footprint
        • Strategy Overview
          • Marketing Strategy
          • Product Strategy
          • Channel Strategy
      • Mondi Group
        • Overview
        • Product Portfolio
        • Profitability by Market Segments (Product/Age /Sales Channel/Region)
        • Sales Footprint
        • Strategy Overview
          • Marketing Strategy
          • Product Strategy
          • Channel Strategy
      • Orora Visual
        • Overview
        • Product Portfolio
        • Profitability by Market Segments (Product/Age /Sales Channel/Region)
        • Sales Footprint
        • Strategy Overview
          • Marketing Strategy
          • Product Strategy
          • Channel Strategy
      • Packaging Corporation of America
        • Overview
        • Product Portfolio
        • Profitability by Market Segments (Product/Age /Sales Channel/Region)
        • Sales Footprint
        • Strategy Overview
          • Marketing Strategy
          • Product Strategy
          • Channel Strategy
      • PakFactory
        • Overview
        • Product Portfolio
        • Profitability by Market Segments (Product/Age /Sales Channel/Region)
        • Sales Footprint
        • Strategy Overview
          • Marketing Strategy
          • Product Strategy
          • Channel Strategy
      • Rengo Co.
        • Overview
        • Product Portfolio
        • Profitability by Market Segments (Product/Age /Sales Channel/Region)
        • Sales Footprint
        • Strategy Overview
          • Marketing Strategy
          • Product Strategy
          • Channel Strategy
      • Salazar Packaging
        • Overview
        • Product Portfolio
        • Profitability by Market Segments (Product/Age /Sales Channel/Region)
        • Sales Footprint
        • Strategy Overview
          • Marketing Strategy
          • Product Strategy
          • Channel Strategy
      • Smurfit Kappa
        • Overview
        • Product Portfolio
        • Profitability by Market Segments (Product/Age /Sales Channel/Region)
        • Sales Footprint
        • Strategy Overview
          • Marketing Strategy
          • Product Strategy
          • Channel Strategy
      • Stora Enso
        • Overview
        • Product Portfolio
        • Profitability by Market Segments (Product/Age /Sales Channel/Region)
        • Sales Footprint
        • Strategy Overview
          • Marketing Strategy
          • Product Strategy
          • Channel Strategy
      • WestRock Company
        • Overview
        • Product Portfolio
        • Profitability by Market Segments (Product/Age /Sales Channel/Region)
        • Sales Footprint
        • Strategy Overview
          • Marketing Strategy
          • Product Strategy
          • Channel Strategy
  20. Assumptions & Acronyms Used
  21. Research Methodology

List of Tables

  • Table 1: Global Market Value (USD Billion) Forecast by Region, 2020 to 2035
  • Table 2: Global Market Volume (tons) Forecast by Region, 2020 to 2035
  • Table 3: Global Market Value (USD Billion) Forecast by Packaging Type, 2020 to 2035
  • Table 4: Global Market Volume (tons) Forecast by Packaging Type, 2020 to 2035
  • Table 5: Global Market Value (USD Billion) Forecast by Material Type, 2020 to 2035
  • Table 6: Global Market Volume (tons) Forecast by Material Type, 2020 to 2035
  • Table 7: Global Market Value (USD Billion) Forecast by End Use Industry, 2020 to 2035
  • Table 8: Global Market Volume (tons) Forecast by End Use Industry, 2020 to 2035
  • Table 9: North America Market Value (USD Billion) Forecast by Country, 2020 to 2035
  • Table 10: North America Market Volume (tons) Forecast by Country, 2020 to 2035
  • Table 11: North America Market Value (USD Billion) Forecast by Packaging Type, 2020 to 2035
  • Table 12: North America Market Volume (tons) Forecast by Packaging Type, 2020 to 2035
  • Table 13: North America Market Value (USD Billion) Forecast by Material Type, 2020 to 2035
  • Table 14: North America Market Volume (tons) Forecast by Material Type, 2020 to 2035
  • Table 15: North America Market Value (USD Billion) Forecast by End Use Industry, 2020 to 2035
  • Table 16: North America Market Volume (tons) Forecast by End Use Industry, 2020 to 2035
  • Table 17: Latin America Market Value (USD Billion) Forecast by Country, 2020 to 2035
  • Table 18: Latin America Market Volume (tons) Forecast by Country, 2020 to 2035
  • Table 19: Latin America Market Value (USD Billion) Forecast by Packaging Type, 2020 to 2035
  • Table 20: Latin America Market Volume (tons) Forecast by Packaging Type, 2020 to 2035
  • Table 21: Latin America Market Value (USD Billion) Forecast by Material Type, 2020 to 2035
  • Table 22: Latin America Market Volume (tons) Forecast by Material Type, 2020 to 2035
  • Table 23: Latin America Market Value (USD Billion) Forecast by End Use Industry, 2020 to 2035
  • Table 24: Latin America Market Volume (tons) Forecast by End Use Industry, 2020 to 2035
  • Table 25: Western Europe Market Value (USD Billion) Forecast by Country, 2020 to 2035
  • Table 26: Western Europe Market Volume (tons) Forecast by Country, 2020 to 2035
  • Table 27: Western Europe Market Value (USD Billion) Forecast by Packaging Type, 2020 to 2035
  • Table 28: Western Europe Market Volume (tons) Forecast by Packaging Type, 2020 to 2035
  • Table 29: Western Europe Market Value (USD Billion) Forecast by Material Type, 2020 to 2035
  • Table 30: Western Europe Market Volume (tons) Forecast by Material Type, 2020 to 2035
  • Table 31: Western Europe Market Value (USD Billion) Forecast by End Use Industry, 2020 to 2035
  • Table 32: Western Europe Market Volume (tons) Forecast by End Use Industry, 2020 to 2035
  • Table 33: Eastern Europe Market Value (USD Billion) Forecast by Country, 2020 to 2035
  • Table 34: Eastern Europe Market Volume (tons) Forecast by Country, 2020 to 2035
  • Table 35: Eastern Europe Market Value (USD Billion) Forecast by Packaging Type, 2020 to 2035
  • Table 36: Eastern Europe Market Volume (tons) Forecast by Packaging Type, 2020 to 2035
  • Table 37: Eastern Europe Market Value (USD Billion) Forecast by Material Type, 2020 to 2035
  • Table 38: Eastern Europe Market Volume (tons) Forecast by Material Type, 2020 to 2035
  • Table 39: Eastern Europe Market Value (USD Billion) Forecast by End Use Industry, 2020 to 2035
  • Table 40: Eastern Europe Market Volume (tons) Forecast by End Use Industry, 2020 to 2035
  • Table 41: East Asia Market Value (USD Billion) Forecast by Country, 2020 to 2035
  • Table 42: East Asia Market Volume (tons) Forecast by Country, 2020 to 2035
  • Table 43: East Asia Market Value (USD Billion) Forecast by Packaging Type, 2020 to 2035
  • Table 44: East Asia Market Volume (tons) Forecast by Packaging Type, 2020 to 2035
  • Table 45: East Asia Market Value (USD Billion) Forecast by Material Type, 2020 to 2035
  • Table 46: East Asia Market Volume (tons) Forecast by Material Type, 2020 to 2035
  • Table 47: East Asia Market Value (USD Billion) Forecast by End Use Industry, 2020 to 2035
  • Table 48: East Asia Market Volume (tons) Forecast by End Use Industry, 2020 to 2035
  • Table 49: South Asia & Pacific Market Value (USD Billion) Forecast by Country, 2020 to 2035
  • Table 50: South Asia & Pacific Market Volume (tons) Forecast by Country, 2020 to 2035
  • Table 51: South Asia & Pacific Market Value (USD Billion) Forecast by Packaging Type, 2020 to 2035
  • Table 52: South Asia & Pacific Market Volume (tons) Forecast by Packaging Type, 2020 to 2035
  • Table 53: South Asia & Pacific Market Value (USD Billion) Forecast by Material Type, 2020 to 2035
  • Table 54: South Asia & Pacific Market Volume (tons) Forecast by Material Type, 2020 to 2035
  • Table 55: South Asia & Pacific Market Value (USD Billion) Forecast by End Use Industry, 2020 to 2035
  • Table 56: South Asia & Pacific Market Volume (tons) Forecast by End Use Industry, 2020 to 2035
  • Table 57: Middle East and Africa Market Value (USD Billion) Forecast by Country, 2020 to 2035
  • Table 58: Middle East and Africa Market Volume (tons) Forecast by Country, 2020 to 2035
  • Table 59: Middle East and Africa Market Value (USD Billion) Forecast by Packaging Type, 2020 to 2035
  • Table 60: Middle East and Africa Market Volume (tons) Forecast by Packaging Type, 2020 to 2035
  • Table 61: Middle East and Africa Market Value (USD Billion) Forecast by Material Type, 2020 to 2035
  • Table 62: Middle East and Africa Market Volume (tons) Forecast by Material Type, 2020 to 2035
  • Table 63: Middle East and Africa Market Value (USD Billion) Forecast by End Use Industry, 2020 to 2035
  • Table 64: Middle East and Africa Market Volume (tons) Forecast by End Use Industry, 2020 to 2035

List of Figures

  • Figure 1: Global Market Volume (tons) Forecast 2020 to 2035
  • Figure 2: Global Market Pricing Analysis
  • Figure 3: Global Market Value (USD Billion) Forecast 2020 to 2035
  • Figure 4: Global Market Value Share and BPS Analysis by Packaging Type, 2025 and 2035
  • Figure 5: Global Market Y-o-Y Growth Comparison by Packaging Type, 2025 to 2035
  • Figure 6: Global Market Attractiveness Analysis by Packaging Type
  • Figure 7: Global Market Value Share and BPS Analysis by Material Type, 2025 and 2035
  • Figure 8: Global Market Y-o-Y Growth Comparison by Material Type, 2025 to 2035
  • Figure 9: Global Market Attractiveness Analysis by Material Type
  • Figure 10: Global Market Value Share and BPS Analysis by End Use Industry, 2025 and 2035
  • Figure 11: Global Market Y-o-Y Growth Comparison by End Use Industry, 2025 to 2035
  • Figure 12: Global Market Attractiveness Analysis by End Use Industry
  • Figure 13: Global Market Value (USD Billion) Share and BPS Analysis by Region, 2025 and 2035
  • Figure 14: Global Market Y-o-Y Growth Comparison by Region, 2025 to 2035
  • Figure 15: Global Market Attractiveness Analysis by Region
  • Figure 16: North America Market Incremental $ Opportunity, 2025 to 2035
  • Figure 17: Latin America Market Incremental $ Opportunity, 2025 to 2035
  • Figure 18: Western Europe Market Incremental $ Opportunity, 2025 to 2035
  • Figure 19: Eastern Europe Market Incremental $ Opportunity, 2025 to 2035
  • Figure 20: East Asia Market Incremental $ Opportunity, 2025 to 2035
  • Figure 21: South Asia & Pacific Market Incremental $ Opportunity, 2025 to 2035
  • Figure 22: Middle East and Africa Market Incremental $ Opportunity, 2025 to 2035
  • Figure 23: North America Market Value Share and BPS Analysis by Country, 2025 and 2035
  • Figure 24: North America Market Value Share and BPS Analysis by Packaging Type, 2025 and 2035
  • Figure 25: North America Market Y-o-Y Growth Comparison by Packaging Type, 2025 to 2035
  • Figure 26: North America Market Attractiveness Analysis by Packaging Type
  • Figure 27: North America Market Value Share and BPS Analysis by Material Type, 2025 and 2035
  • Figure 28: North America Market Y-o-Y Growth Comparison by Material Type, 2025 to 2035
  • Figure 29: North America Market Attractiveness Analysis by Material Type
  • Figure 30: North America Market Value Share and BPS Analysis by End Use Industry, 2025 and 2035
  • Figure 31: North America Market Y-o-Y Growth Comparison by End Use Industry, 2025 to 2035
  • Figure 32: North America Market Attractiveness Analysis by End Use Industry
  • Figure 33: Latin America Market Value Share and BPS Analysis by Country, 2025 and 2035
  • Figure 34: Latin America Market Value Share and BPS Analysis by Packaging Type, 2025 and 2035
  • Figure 35: Latin America Market Y-o-Y Growth Comparison by Packaging Type, 2025 to 2035
  • Figure 36: Latin America Market Attractiveness Analysis by Packaging Type
  • Figure 37: Latin America Market Value Share and BPS Analysis by Material Type, 2025 and 2035
  • Figure 38: Latin America Market Y-o-Y Growth Comparison by Material Type, 2025 to 2035
  • Figure 39: Latin America Market Attractiveness Analysis by Material Type
  • Figure 40: Latin America Market Value Share and BPS Analysis by End Use Industry, 2025 and 2035
  • Figure 41: Latin America Market Y-o-Y Growth Comparison by End Use Industry, 2025 to 2035
  • Figure 42: Latin America Market Attractiveness Analysis by End Use Industry
  • Figure 43: Western Europe Market Value Share and BPS Analysis by Country, 2025 and 2035
  • Figure 44: Western Europe Market Value Share and BPS Analysis by Packaging Type, 2025 and 2035
  • Figure 45: Western Europe Market Y-o-Y Growth Comparison by Packaging Type, 2025 to 2035
  • Figure 46: Western Europe Market Attractiveness Analysis by Packaging Type
  • Figure 47: Western Europe Market Value Share and BPS Analysis by Material Type, 2025 and 2035
  • Figure 48: Western Europe Market Y-o-Y Growth Comparison by Material Type, 2025 to 2035
  • Figure 49: Western Europe Market Attractiveness Analysis by Material Type
  • Figure 50: Western Europe Market Value Share and BPS Analysis by End Use Industry, 2025 and 2035
  • Figure 51: Western Europe Market Y-o-Y Growth Comparison by End Use Industry, 2025 to 2035
  • Figure 52: Western Europe Market Attractiveness Analysis by End Use Industry
  • Figure 53: Eastern Europe Market Value Share and BPS Analysis by Country, 2025 and 2035
  • Figure 54: Eastern Europe Market Value Share and BPS Analysis by Packaging Type, 2025 and 2035
  • Figure 55: Eastern Europe Market Y-o-Y Growth Comparison by Packaging Type, 2025 to 2035
  • Figure 56: Eastern Europe Market Attractiveness Analysis by Packaging Type
  • Figure 57: Eastern Europe Market Value Share and BPS Analysis by Material Type, 2025 and 2035
  • Figure 58: Eastern Europe Market Y-o-Y Growth Comparison by Material Type, 2025 to 2035
  • Figure 59: Eastern Europe Market Attractiveness Analysis by Material Type
  • Figure 60: Eastern Europe Market Value Share and BPS Analysis by End Use Industry, 2025 and 2035
  • Figure 61: Eastern Europe Market Y-o-Y Growth Comparison by End Use Industry, 2025 to 2035
  • Figure 62: Eastern Europe Market Attractiveness Analysis by End Use Industry
  • Figure 63: East Asia Market Value Share and BPS Analysis by Country, 2025 and 2035
  • Figure 64: East Asia Market Value Share and BPS Analysis by Packaging Type, 2025 and 2035
  • Figure 65: East Asia Market Y-o-Y Growth Comparison by Packaging Type, 2025 to 2035
  • Figure 66: East Asia Market Attractiveness Analysis by Packaging Type
  • Figure 67: East Asia Market Value Share and BPS Analysis by Material Type, 2025 and 2035
  • Figure 68: East Asia Market Y-o-Y Growth Comparison by Material Type, 2025 to 2035
  • Figure 69: East Asia Market Attractiveness Analysis by Material Type
  • Figure 70: East Asia Market Value Share and BPS Analysis by End Use Industry, 2025 and 2035
  • Figure 71: East Asia Market Y-o-Y Growth Comparison by End Use Industry, 2025 to 2035
  • Figure 72: East Asia Market Attractiveness Analysis by End Use Industry
  • Figure 73: South Asia & Pacific Market Value Share and BPS Analysis by Country, 2025 and 2035
  • Figure 74: South Asia & Pacific Market Value Share and BPS Analysis by Packaging Type, 2025 and 2035
  • Figure 75: South Asia & Pacific Market Y-o-Y Growth Comparison by Packaging Type, 2025 to 2035
  • Figure 76: South Asia & Pacific Market Attractiveness Analysis by Packaging Type
  • Figure 77: South Asia & Pacific Market Value Share and BPS Analysis by Material Type, 2025 and 2035
  • Figure 78: South Asia & Pacific Market Y-o-Y Growth Comparison by Material Type, 2025 to 2035
  • Figure 79: South Asia & Pacific Market Attractiveness Analysis by Material Type
  • Figure 80: South Asia & Pacific Market Value Share and BPS Analysis by End Use Industry, 2025 and 2035
  • Figure 81: South Asia & Pacific Market Y-o-Y Growth Comparison by End Use Industry, 2025 to 2035
  • Figure 82: South Asia & Pacific Market Attractiveness Analysis by End Use Industry
  • Figure 83: Middle East and Africa Market Value Share and BPS Analysis by Country, 2025 and 2035
  • Figure 84: Middle East and Africa Market Value Share and BPS Analysis by Packaging Type, 2025 and 2035
  • Figure 85: Middle East and Africa Market Y-o-Y Growth Comparison by Packaging Type, 2025 to 2035
  • Figure 86: Middle East and Africa Market Attractiveness Analysis by Packaging Type
  • Figure 87: Middle East and Africa Market Value Share and BPS Analysis by Material Type, 2025 and 2035
  • Figure 88: Middle East and Africa Market Y-o-Y Growth Comparison by Material Type, 2025 to 2035
  • Figure 89: Middle East and Africa Market Attractiveness Analysis by Material Type
  • Figure 90: Middle East and Africa Market Value Share and BPS Analysis by End Use Industry, 2025 and 2035
  • Figure 91: Middle East and Africa Market Y-o-Y Growth Comparison by End Use Industry, 2025 to 2035
  • Figure 92: Middle East and Africa Market Attractiveness Analysis by End Use Industry
  • Figure 93: Global Market - Tier Structure Analysis
  • Figure 94: Global Market - Company Share Analysis

Frequently Asked Questions

What is the projected size of the custom display packaging market by 2035?

The market is expected to reach USD 39.7 billion by 2035.

What is the estimated market size of the custom display packaging market in 2025?

The market size is projected to be USD 24.7 billion in 2025.

What is the CAGR of the custom display packaging market from 2025 to 2035?

The market is expected to grow at a CAGR of 5.6% from 2025 to 2035.

Which country is the fastest growing in the custom display packaging market?

China is expected to be the fastest growing with a CAGR of 6.2%.

Which segment leads the custom display packaging market for material type?

Paper and paperboard, accounting for over 62.5% of the market in 2025.

Explore Similar Insights

Future Market Insights

Custom Display Packaging Market