Custom Binders Market Size and Share Forecast Outlook 2025 to 2035

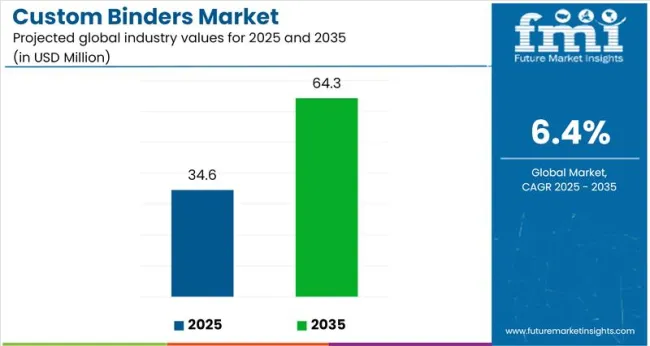
The global custom binders market is projected to grow from USD 34.6 million in 2025 to USD 64.3 million by 2035, expanding at a CAGR of 6.4%. Custom binders form a niche within the broader office supplies market, which was worth USD 121.2 million in 2025. As a result, custom binders account for a 28.5% share of the total office supply spending globally.
Quick Stats - Custom Binders Market

  • Value of Market (2025): USD 34.6 Million
  • Projected Value of Market (2035): USD 64.3 Million
  • Forecast CAGR (2025 to 2035): 6.4%
  • Largest Segment by Product Type: Hardcover Binders - 49%
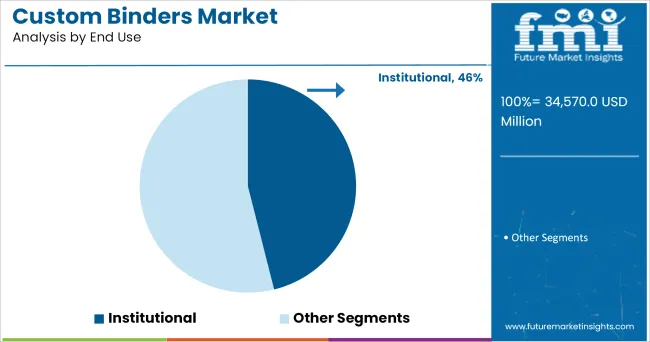
  • Largest Segment by End Use: Institutional - 46%
  • Most Lucrative Market: United States - 5.3% CAGR
  • Paper & Paperboard Dominance: 54% market share by material
  • Top Player Share: Norwood Systems - 30%

Custom Binders Market

Metric Value
Market Size 2025 USD 34.6 Million
Market Size 2035 USD 64.3 Million
CAGR 2025 to 2035 6.4%

Despite office digitalization, institutional and corporate branding needs continue to fuel demand for physical presentation materials, including binders. Customization for legal, educational, and corporate documentation has supported steady growth in paper-based accessories, particularly in North America and Western Europe. Use cases in client presentations, compliance submissions, and training documentation reinforce binders’ functional relevance.

However, cost-conscious buyers and rising material costs have constrained premium adoption in some regions. Vinyl and synthetic input prices have increased, while competition from digital archiving tools has limited penetration in tech-forward economies. EU environmental directives have also added compliance pressure on plastic-heavy formats, causing procurement delays or reformulation.

Material innovation and on-demand manufacturing have unlocked new revenue pockets, especially for short-run and highly customized binder orders. Paperboard-based alternatives have gained traction amid tightening single-use plastic norms, boosting their share to 54%. Players offering flexible customization at low minimum order quantities (MOQs) are best placed to scale through 2035.

Analyzing Custom Binder Market by Top Investment Segments

Global custom binder market has been segmented by Material Type (Paper & Paperboard, Plastic); by Product Type (Hardcover Binders, Decorative Binders, Softcover Binders, Punchless Binders, Ring Binders); and by End Use (Institutional, Commercial, Household); with regional coverage spanning North America, Latin America, Western Europe, Eastern Europe, East Asia, South Asia & Pacific, Middle East & Africa.
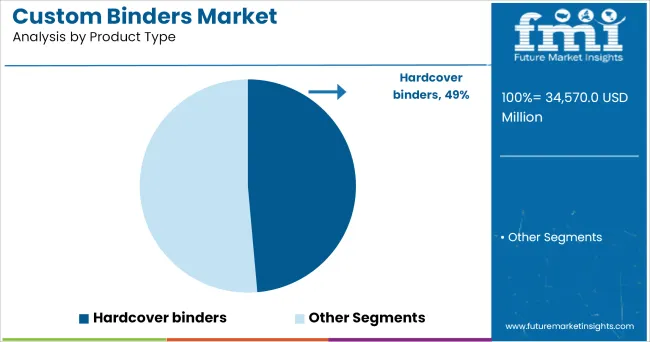
By Product Type, Hardcover Binders Account for 49% Share

Custom Binders Market Analysis By Product Type

Preferred in legal, academic, and enterprise documentation, hardcover formats are favored for their structured form and longer shelf life. However, their higher cost base and heavier weight have posed a barrier in cost-sensitive and remote geographies.

Manufacturing automation, especially in casing-in and spine reinforcement processes, has helped reduce per-unit cost by 12-15% since 2020, enabling better margins.
  • Bulk purchasing from education boards and courts
  • Declining cost per unit from semi-automatic lines
  • Low threat from digital-only formats in compliance-heavy sectors

By End Use, the Institutional segment accounts for 46% of the global market in 2025

Custom Binders Market Analysis By End Use

Growth is underpinned by consistent procurement from government agencies, public education boards, and healthcare systems, all of which require standardized formats for recordkeeping, compliance, and formal communication. Orders are typically structured into long-term contracts or annual tenders, with repeat volumes minimizing per-unit negotiation.

While commercial and household use of binders is growing-particularly via online retail-these segments face greater pricing volatility and demand fragmentation. Institutional buyers, by contrast, prioritize consistency and physical durability, making them less reactive to price hikes or digital substitutes.
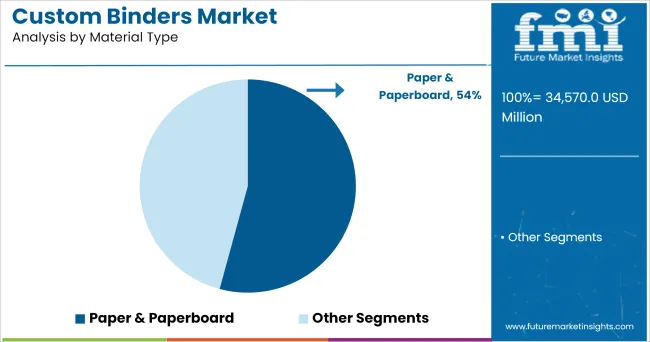
By Material Type, Paper & Paperboard dominates with a 54% share in 2025

Custom Binders Market Analysis By Material Type

The shift is strongly influenced by regulatory interventions, especially in Europe and the USA, where plastic-based office supplies face procurement restrictions under green purchasing mandates. Paperboard formats have benefitted from recyclability advantages and their ease of branding through digital or offset printing.

Unlike plastic, which may require specialized coating or lamination, paperboard offers a ready surface for low-cost customization-particularly attractive to schools, government offices, and NGOs. This cost-performance balance is expected to make Paper & Paperboard the default substrate in institutional and mid-volume commercial orders.
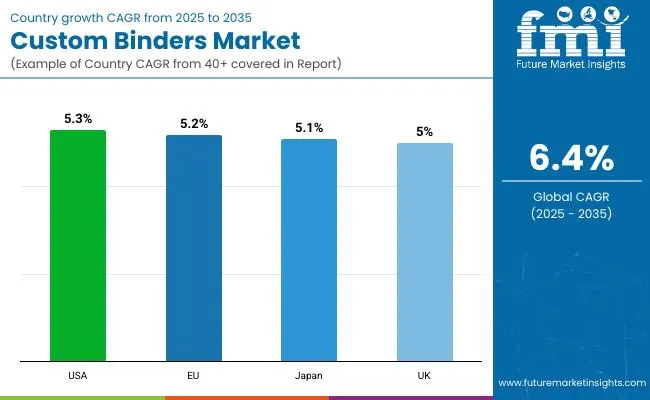
Custom Binders Market Analysis by Country

Custom Binders Market Country Growth Cagr From 2025 2035

Demand for custom binders across mature economies is expected to follow a stable, upward trajectory through 2035, with institutional and regulatory momentum playing a central role. In the United States, procurement patterns are shaped by continued reliance on physical documentation in public education and legal systems, alongside small-batch customization trends in enterprise settings. Across the European Union, demand is reinforced by compliance-driven use in government and education, where single-use plastic bans are also tilting preference toward paperboard formats.

Japan’s market remains structured around meticulous documentation standards in corporates and municipal bodies, while the United Kingdom shows growing adoption among SMEs, supported by domestic print-on-demand services and a recovering retail stationery segment. Across all four, digital shift pressures exist, but consistent demand from public institutions ensures physical formats retain a durable niche.

United States Custom Binders Market Analysis

The USA custom binders market continues to demonstrate consistent growth, primarily anchored in the education, legal, and public administration sectors. School districts, municipal authorities, and healthcare institutions generate repeat demand through annual procurement cycles, reinforcing physical binder usage despite ongoing digitization. Private sector uptake is led by mid-sized enterprises, where customized binders are still used for training materials, onboarding kits, and client-facing documentation.

E-commerce has enabled cost-effective personalization, with a growing number of domestic converters offering print-on-demand services for small batch runs. Moreover, local sourcing preferences and compliance with state-level public procurement standards have insulated the market from global supply chain volatility, supporting volume stability even during periods of economic adjustment.

European Union Custom Binders Sales Forecast

Demand across the EU-27 remains shaped by regulatory compliance, public-sector procurement policies, and environmental mandates. Government institutions, universities, and NGOs continue to rely on physical binders for document organization and public records. A key growth lever has been the phase-out of non-recyclable plastic materials under circular economy policies, redirecting procurement toward paperboard and bio-based alternatives.

Countries like Germany, France, and the Netherlands have shown steady institutional consumption, while Eastern European states are catching up through infrastructure modernization programs. Vendors with EU Ecolabel certification or national green procurement compliance have secured multi-year supply contracts, particularly for ring binders and hardcover formats. Although hybrid work policies have softened demand from office-based sectors, public frameworks continue to sustain baseline volume growth.

Japan Customer Binders Industry Analysis

Japan’s market is distinguished by a cultural and institutional preference for physical document archiving, which has ensured the continued relevance of custom binders in corporate and public workflows. Government departments, banks, and real estate firms maintain strict filing protocols, where binders serve as a core part of structured paper management. Schools and private academies also contribute to volume through curriculum packaging and administrative usage.

The domestic industry is characterized by high-quality, precision-oriented production, with an emphasis on compact form factors and durable finishes. Decorative and limited-edition binders have emerged as a niche in the consumer and gifting segments, particularly for students and hobbyists. While digitization efforts exist, they are selectively implemented, leaving substantial room for physical documentation tools over the forecast period.

United Kingdom Custom Binders Growth Outlook

The UK binder market reflects a hybrid model, balancing institutional continuity with evolving small-business needs. Government-funded schools, NHS trusts, and local councils continue to rely on structured binder systems for audits, training, and reporting, generating predictable annual demand. SMEs have embraced branding-led customization, using binders in proposal decks, internal training, and marketing deliverables. Since Brexit, domestic producers have benefited from reduced EU competition, leading to a modest reshoring of demand.

Print-on-demand services have expanded into regional hubs, catering to fast-turnaround needs. However, inflation-linked cost pressures and an ongoing digital transition in corporate offices present mild headwinds. Despite this, the embedded use of binders in education and professional services ensures a resilient baseline of usage across both public and private sectors.
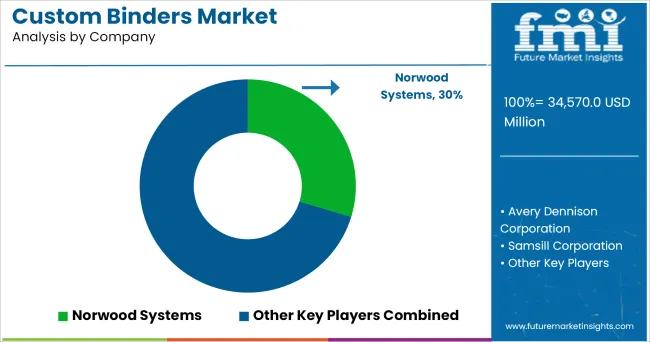
Custom Binders Market Analysis by Key Players

Custom Binders Market Analysis By Company

The players in the custom binders market are focusing on differentiated design capabilities, sustainable material sourcing, and short-run digital customization to retain institutional and commercial clients. Leading companies like Norwood Systems and Avery Dennison are investing in automation for large-volume procurement contracts, especially in education and government segments. High-capacity manufacturing and regulatory compliance have helped them secure multi-year supply agreements with public institutions across North America and Europe.

Tier-2 manufacturers such as Samsill Corporation and niche regional firms are targeting mid-market clients and SMEs by offering flexible minimum order quantities (MOQs), variable binder styles, and on-demand printing. These players operate leaner production models and frequently integrate with e-commerce platforms to capture direct-to-consumer and small business sales. Customization, speed, and pricing remain their core value propositions.

Startups and local converters have entered the space through Etsy-like channels and localized Shopify storefronts, offering highly personalized, aesthetic-driven binders for retail and household use. While their scale is limited, these players are reshaping the decorative and gifting segment, pushing legacy players to adapt SKU strategies.

By 2035, the winners will likely be those combining compliance-ready formats with modular customization-able to scale institutional volumes while addressing aesthetic and niche-use personalization. Late movers reliant on standard mass production will face margin compression and shrinking public contracts.

Reports Scope

Attribute Details
Market Size (2025) USD 34.6 million
Market Size (2035) USD 64.3 million
CAGR (2025 to 2035) 6.4%
Base Year 2024
Historical Period 2020 to 2024
Forecast Period 2025 to 2035
Unit USD Million
Segments Covered By Product Type, Material Type, End Use
Product Types Hardcover Binders, Decorative Binders, Softcover Binders, Punchless Binders, Ring Binders
Material Types Paper & Paperboard, Plastic
End Use Institutional, Commercial, Household
Key Regions North America, Latin America, Western Europe, Eastern Europe, East Asia, South Asia & Pacific, Middle East & Africa
Key Countries Covered United States, United Kingdom, Germany, France, Japan and 40+ countries
Key Companies Norwood Systems, Avery Dennison Corporation, Samsill Corporation, Other Market Participants

Custom Binders Market Segmentation

By Material Type:

  • Paper & Paperboard
  • Plastic

By Product Type:

  • Hardcover binders
  • Decorative binders
  • Softcover binders
  • Punchless binders
  • Ring binders

By End Use:

  • Institutional
  • Commercial
  • Household

By Region:

  • North America
  • Latin America
  • Western Europe
  • Eastern Europe
  • East Asia
  • South Asia Pacific
  • Middle East and Africa

Table of Content

  1. Executive Summary
    • Global Market Outlook
    • Demand-side Trends
    • Supply-side Trends
    • Technology Roadmap Analysis
    • Analysis and Recommendations
  2. Market Overview
    • Market Coverage / Taxonomy
    • Market Definition / Scope / Limitations
  3. Market Background
    • Market Dynamics
      • Drivers
      • Restraints
      • Opportunity
      • Trends
    • Scenario Forecast
      • Demand in Optimistic Scenario
      • Demand in Likely Scenario
      • Demand in Conservative Scenario
    • Opportunity Map Analysis
    • Product Life Cycle Analysis
    • Supply Chain Analysis
      • Supply Side Participants and their Roles
        • Producers
        • Mid-Level Participants (Traders/ Agents/ Brokers)
        • Wholesalers and Distributors
      • Value Added and Value Created at Node in the Supply Chain
      • List of Raw Material Suppliers
      • List of Existing and Potential Buyer’s
    • Investment Feasibility Matrix
    • Value Chain Analysis
      • Profit Margin Analysis
      • Wholesalers and Distributors
      • Retailers
    • PESTLE and Porter’s Analysis
    • Regulatory Landscape
      • By Key Regions
      • By Key Countries
    • Regional Parent Market Outlook
    • Production and Consumption Statistics
    • Import and Export Statistics
  4. Global Market Analysis 2020 to 2024 and Forecast, 2025 to 2035
    • Historical Market Size Value (USD Billion) & Volume (Units) Analysis, 2020 to 2024
    • Current and Future Market Size Value (USD Billion) & Volume (Units) Projections, 2025 to 2035
      • Y-o-Y Growth Trend Analysis
      • Absolute $ Opportunity Analysis
  5. Global Market Pricing Analysis 2020 to 2024 and Forecast 2025 to 2035
  6. Global Market Analysis 2020 to 2024 and Forecast 2025 to 2035, By Material Type
    • Introduction / Key Findings
    • Historical Market Size Value (USD Billion) & Volume (Units) Analysis By Material Type, 2020 to 2024
    • Current and Future Market Size Value (USD Billion) & Volume (Units) Analysis and Forecast By Material Type, 2025 to 2035
      • Paper & Paperboard
      • Plastic
    • Y-o-Y Growth Trend Analysis By Material Type, 2020 to 2024
    • Absolute $ Opportunity Analysis By Material Type, 2025 to 2035
  7. Global Market Analysis 2020 to 2024 and Forecast 2025 to 2035, By Product Type
    • Introduction / Key Findings
    • Historical Market Size Value (USD Billion) & Volume (Units) Analysis By Product Type, 2020 to 2024
    • Current and Future Market Size Value (USD Billion) & Volume (Units) Analysis and Forecast By Product Type, 2025 to 2035
      • Hardcover binders
      • Decorative binders
      • Softcover binders
      • Punchless binders
      • Ring binders
    • Y-o-Y Growth Trend Analysis By Product Type, 2020 to 2024
    • Absolute $ Opportunity Analysis By Product Type, 2025 to 2035
  8. Global Market Analysis 2020 to 2024 and Forecast 2025 to 2035, By End Use
    • Introduction / Key Findings
    • Historical Market Size Value (USD Billion) & Volume (Units) Analysis By End Use, 2020 to 2024
    • Current and Future Market Size Value (USD Billion) & Volume (Units) Analysis and Forecast By End Use, 2025 to 2035
      • Institutional
      • Commercial
      • Household
    • Y-o-Y Growth Trend Analysis By End Use, 2020 to 2024
    • Absolute $ Opportunity Analysis By End Use, 2025 to 2035
  9. Global Market Analysis 2020 to 2024 and Forecast 2025 to 2035, By Region
    • Introduction
    • Historical Market Size Value (USD Billion) & Volume (Units) Analysis By Region, 2020 to 2024
    • Current Market Size Value (USD Billion) & Volume (Units) Analysis and Forecast By Region, 2025 to 2035
      • North America
      • Latin America
      • Western Europe
      • Eastern Europe
      • East Asia
      • South Asia & Pacific
      • Middle East and Africa
    • Market Attractiveness Analysis By Region
  10. North America Market Analysis 2020 to 2024 and Forecast 2025 to 2035, By Country
    • Historical Market Size Value (USD Billion) & Volume (Units) Trend Analysis By Market Taxonomy, 2020 to 2024
    • Market Size Value (USD Billion) & Volume (Units) Forecast By Market Taxonomy, 2025 to 2035
      • By Country
        • USA
        • Canada
        • Mexico
      • By Material Type
      • By Product Type
      • By End Use
    • Market Attractiveness Analysis
      • By Country
      • By Material Type
      • By Product Type
      • By End Use
    • Key Takeaways
  11. Latin America Market Analysis 2020 to 2024 and Forecast 2025 to 2035, By Country
    • Historical Market Size Value (USD Billion) & Volume (Units) Trend Analysis By Market Taxonomy, 2020 to 2024
    • Market Size Value (USD Billion) & Volume (Units) Forecast By Market Taxonomy, 2025 to 2035
      • By Country
        • Brazil
        • Argentina
        • Rest of LATAM
      • By Material Type
      • By Product Type
      • By End Use
    • Market Attractiveness Analysis
      • By Country
      • By Material Type
      • By Product Type
      • By End Use
    • Key Takeaways
  12. Western Europe Market Analysis 2020 to 2024 and Forecast 2025 to 2035, By Country
    • Historical Market Size Value (USD Billion) & Volume (Units) Trend Analysis By Market Taxonomy, 2020 to 2024
    • Market Size Value (USD Billion) & Volume (Units) Forecast By Market Taxonomy, 2025 to 2035
      • By Country
        • Germany
        • Italy
        • France
        • UK
        • Spain
        • BENELUX
        • Nordic
        • Rest of W.Europe
      • By Material Type
      • By Product Type
      • By End Use
    • Market Attractiveness Analysis
      • By Country
      • By Material Type
      • By Product Type
      • By End Use
    • Key Takeaways
  13. Eastern Europe Market Analysis 2020 to 2024 and Forecast 2025 to 2035, By Country
    • Historical Market Size Value (USD Billion) & Volume (Units) Trend Analysis By Market Taxonomy, 2020 to 2024
    • Market Size Value (USD Billion) & Volume (Units) Forecast By Market Taxonomy, 2025 to 2035
      • By Country
        • Russia
        • Hungary
        • Poland
        • Balkan & Baltics
        • Rest of E. Europe
      • By Material Type
      • By Product Type
      • By End Use
    • Market Attractiveness Analysis
      • By Country
      • By Material Type
      • By Product Type
      • By End Use
    • Key Takeaways
  14. East Asia Market Analysis 2020 to 2024 and Forecast 2025 to 2035, By Country
    • Historical Market Size Value (USD Billion) & Volume (Units) Trend Analysis By Market Taxonomy, 2020 to 2024
    • Market Size Value (USD Billion) & Volume (Units) Forecast By Market Taxonomy, 2025 to 2035
      • By Country
        • China
        • Japan
        • South Korea
      • By Material Type
      • By Product Type
      • By End Use
    • Market Attractiveness Analysis
      • By Country
      • By Material Type
      • By Product Type
      • By End Use
    • Key Takeaways
  15. South Asia & Pacific Market Analysis 2020 to 2024 and Forecast 2025 to 2035, By Country
    • Historical Market Size Value (USD Billion) & Volume (Units) Trend Analysis By Market Taxonomy, 2020 to 2024
    • Market Size Value (USD Billion) & Volume (Units) Forecast By Market Taxonomy, 2025 to 2035
      • By Country
        • India
        • Australia & New Zealand
        • ASEAN
        • Rest of SAP
      • By Material Type
      • By Product Type
      • By End Use
    • Market Attractiveness Analysis
      • By Country
      • By Material Type
      • By Product Type
      • By End Use
    • Key Takeaways
  16. Middle East and Africa Market Analysis 2020 to 2024 and Forecast 2025 to 2035, By Country
    • Historical Market Size Value (USD Billion) & Volume (Units) Trend Analysis By Market Taxonomy, 2020 to 2024
    • Market Size Value (USD Billion) & Volume (Units) Forecast By Market Taxonomy, 2025 to 2035
      • By Country
        • GCC Countries
        • Northern Africa
        • South Africa
        • Turkiye
        • Rest of MEA
      • By Material Type
      • By Product Type
      • By End Use
    • Market Attractiveness Analysis
      • By Country
      • By Material Type
      • By Product Type
      • By End Use
    • Key Takeaways
  17. Key Countries Market Analysis
    • USA
      • Pricing Analysis
      • Market Share Analysis, 2024
        • By Material Type
        • By Product Type
        • By End Use
    • Canada
      • Pricing Analysis
      • Market Share Analysis, 2024
        • By Material Type
        • By Product Type
        • By End Use
    • Brazil
      • Pricing Analysis
      • Market Share Analysis, 2024
        • By Material Type
        • By Product Type
        • By End Use
    • Mexico
      • Pricing Analysis
      • Market Share Analysis, 2024
        • By Material Type
        • By Product Type
        • By End Use
    • Argentina
      • Pricing Analysis
      • Market Share Analysis, 2024
        • By Material Type
        • By Product Type
        • By End Use
  18. Market Structure Analysis
    • Competition Dashboard
    • Competition Benchmarking
    • Market Share Analysis of Top Players
      • By Regional
      • By Material Type
      • By Product Type
      • By End Use
  19. Competition Analysis
    • Competition Deep Dive
      • Creative Packaging Inc.
        • Overview
        • Product Portfolio
        • Profitability by Market Segments (Product/Age /Sales Channel/Region)
        • Sales Footprint
        • Strategy Overview
          • Marketing Strategy
          • Product Strategy
          • Channel Strategy
      • Heinn Chapman Corp
        • Overview
        • Product Portfolio
        • Profitability by Market Segments (Product/Age /Sales Channel/Region)
        • Sales Footprint
        • Strategy Overview
          • Marketing Strategy
          • Product Strategy
          • Channel Strategy
      • The Dimensional Group
        • Overview
        • Product Portfolio
        • Profitability by Market Segments (Product/Age /Sales Channel/Region)
        • Sales Footprint
        • Strategy Overview
          • Marketing Strategy
          • Product Strategy
          • Channel Strategy
      • Command Plastic Corp
        • Overview
        • Product Portfolio
        • Profitability by Market Segments (Product/Age /Sales Channel/Region)
        • Sales Footprint
        • Strategy Overview
          • Marketing Strategy
          • Product Strategy
          • Channel Strategy
      • Norwood Systems
        • Overview
        • Product Portfolio
        • Profitability by Market Segments (Product/Age /Sales Channel/Region)
        • Sales Footprint
        • Strategy Overview
          • Marketing Strategy
          • Product Strategy
          • Channel Strategy
      • Avery Dennison Corporation
        • Overview
        • Product Portfolio
        • Profitability by Market Segments (Product/Age /Sales Channel/Region)
        • Sales Footprint
        • Strategy Overview
          • Marketing Strategy
          • Product Strategy
          • Channel Strategy
      • Samsill Corporation
        • Overview
        • Product Portfolio
        • Profitability by Market Segments (Product/Age /Sales Channel/Region)
        • Sales Footprint
        • Strategy Overview
          • Marketing Strategy
          • Product Strategy
          • Channel Strategy
      • Wilson Jones (ACCO Brands)
        • Overview
        • Product Portfolio
        • Profitability by Market Segments (Product/Age /Sales Channel/Region)
        • Sales Footprint
        • Strategy Overview
          • Marketing Strategy
          • Product Strategy
          • Channel Strategy
      • Case-It Inc.
        • Overview
        • Product Portfolio
        • Profitability by Market Segments (Product/Age /Sales Channel/Region)
        • Sales Footprint
        • Strategy Overview
          • Marketing Strategy
          • Product Strategy
          • Channel Strategy
      • Bindertek
        • Overview
        • Product Portfolio
        • Profitability by Market Segments (Product/Age /Sales Channel/Region)
        • Sales Footprint
        • Strategy Overview
          • Marketing Strategy
          • Product Strategy
          • Channel Strategy
  20. Assumptions & Acronyms Used
  21. Research Methodology

List of Tables

  • Table 1: Global Market Value (USD Billion) Forecast by Region, 2020 to 2035
  • Table 2: Global Market Volume (Units) Forecast by Region, 2020 to 2035
  • Table 3: Global Market Value (USD Billion) Forecast by Material Type, 2020 to 2035
  • Table 4: Global Market Volume (Units) Forecast by Material Type, 2020 to 2035
  • Table 5: Global Market Value (USD Billion) Forecast by Product Type, 2020 to 2035
  • Table 6: Global Market Volume (Units) Forecast by Product Type, 2020 to 2035
  • Table 7: Global Market Value (USD Billion) Forecast by End Use, 2020 to 2035
  • Table 8: Global Market Volume (Units) Forecast by End Use, 2020 to 2035
  • Table 9: North America Market Value (USD Billion) Forecast by Country, 2020 to 2035
  • Table 10: North America Market Volume (Units) Forecast by Country, 2020 to 2035
  • Table 11: North America Market Value (USD Billion) Forecast by Material Type, 2020 to 2035
  • Table 12: North America Market Volume (Units) Forecast by Material Type, 2020 to 2035
  • Table 13: North America Market Value (USD Billion) Forecast by Product Type, 2020 to 2035
  • Table 14: North America Market Volume (Units) Forecast by Product Type, 2020 to 2035
  • Table 15: North America Market Value (USD Billion) Forecast by End Use, 2020 to 2035
  • Table 16: North America Market Volume (Units) Forecast by End Use, 2020 to 2035
  • Table 17: Latin America Market Value (USD Billion) Forecast by Country, 2020 to 2035
  • Table 18: Latin America Market Volume (Units) Forecast by Country, 2020 to 2035
  • Table 19: Latin America Market Value (USD Billion) Forecast by Material Type, 2020 to 2035
  • Table 20: Latin America Market Volume (Units) Forecast by Material Type, 2020 to 2035
  • Table 21: Latin America Market Value (USD Billion) Forecast by Product Type, 2020 to 2035
  • Table 22: Latin America Market Volume (Units) Forecast by Product Type, 2020 to 2035
  • Table 23: Latin America Market Value (USD Billion) Forecast by End Use, 2020 to 2035
  • Table 24: Latin America Market Volume (Units) Forecast by End Use, 2020 to 2035
  • Table 25: Western Europe Market Value (USD Billion) Forecast by Country, 2020 to 2035
  • Table 26: Western Europe Market Volume (Units) Forecast by Country, 2020 to 2035
  • Table 27: Western Europe Market Value (USD Billion) Forecast by Material Type, 2020 to 2035
  • Table 28: Western Europe Market Volume (Units) Forecast by Material Type, 2020 to 2035
  • Table 29: Western Europe Market Value (USD Billion) Forecast by Product Type, 2020 to 2035
  • Table 30: Western Europe Market Volume (Units) Forecast by Product Type, 2020 to 2035
  • Table 31: Western Europe Market Value (USD Billion) Forecast by End Use, 2020 to 2035
  • Table 32: Western Europe Market Volume (Units) Forecast by End Use, 2020 to 2035
  • Table 33: Eastern Europe Market Value (USD Billion) Forecast by Country, 2020 to 2035
  • Table 34: Eastern Europe Market Volume (Units) Forecast by Country, 2020 to 2035
  • Table 35: Eastern Europe Market Value (USD Billion) Forecast by Material Type, 2020 to 2035
  • Table 36: Eastern Europe Market Volume (Units) Forecast by Material Type, 2020 to 2035
  • Table 37: Eastern Europe Market Value (USD Billion) Forecast by Product Type, 2020 to 2035
  • Table 38: Eastern Europe Market Volume (Units) Forecast by Product Type, 2020 to 2035
  • Table 39: Eastern Europe Market Value (USD Billion) Forecast by End Use, 2020 to 2035
  • Table 40: Eastern Europe Market Volume (Units) Forecast by End Use, 2020 to 2035
  • Table 41: East Asia Market Value (USD Billion) Forecast by Country, 2020 to 2035
  • Table 42: East Asia Market Volume (Units) Forecast by Country, 2020 to 2035
  • Table 43: East Asia Market Value (USD Billion) Forecast by Material Type, 2020 to 2035
  • Table 44: East Asia Market Volume (Units) Forecast by Material Type, 2020 to 2035
  • Table 45: East Asia Market Value (USD Billion) Forecast by Product Type, 2020 to 2035
  • Table 46: East Asia Market Volume (Units) Forecast by Product Type, 2020 to 2035
  • Table 47: East Asia Market Value (USD Billion) Forecast by End Use, 2020 to 2035
  • Table 48: East Asia Market Volume (Units) Forecast by End Use, 2020 to 2035
  • Table 49: South Asia & Pacific Market Value (USD Billion) Forecast by Country, 2020 to 2035
  • Table 50: South Asia & Pacific Market Volume (Units) Forecast by Country, 2020 to 2035
  • Table 51: South Asia & Pacific Market Value (USD Billion) Forecast by Material Type, 2020 to 2035
  • Table 52: South Asia & Pacific Market Volume (Units) Forecast by Material Type, 2020 to 2035
  • Table 53: South Asia & Pacific Market Value (USD Billion) Forecast by Product Type, 2020 to 2035
  • Table 54: South Asia & Pacific Market Volume (Units) Forecast by Product Type, 2020 to 2035
  • Table 55: South Asia & Pacific Market Value (USD Billion) Forecast by End Use, 2020 to 2035
  • Table 56: South Asia & Pacific Market Volume (Units) Forecast by End Use, 2020 to 2035
  • Table 57: Middle East and Africa Market Value (USD Billion) Forecast by Country, 2020 to 2035
  • Table 58: Middle East and Africa Market Volume (Units) Forecast by Country, 2020 to 2035
  • Table 59: Middle East and Africa Market Value (USD Billion) Forecast by Material Type, 2020 to 2035
  • Table 60: Middle East and Africa Market Volume (Units) Forecast by Material Type, 2020 to 2035
  • Table 61: Middle East and Africa Market Value (USD Billion) Forecast by Product Type, 2020 to 2035
  • Table 62: Middle East and Africa Market Volume (Units) Forecast by Product Type, 2020 to 2035
  • Table 63: Middle East and Africa Market Value (USD Billion) Forecast by End Use, 2020 to 2035
  • Table 64: Middle East and Africa Market Volume (Units) Forecast by End Use, 2020 to 2035

List of Figures

  • Figure 1: Global Market Volume (Units) Forecast 2020 to 2035
  • Figure 2: Global Market Pricing Analysis
  • Figure 3: Global Market Value (USD Billion) Forecast 2020 to 2035
  • Figure 4: Global Market Value Share and BPS Analysis by Material Type, 2025 and 2035
  • Figure 5: Global Market Y-o-Y Growth Comparison by Material Type, 2025 to 2035
  • Figure 6: Global Market Attractiveness Analysis by Material Type
  • Figure 7: Global Market Value Share and BPS Analysis by Product Type, 2025 and 2035
  • Figure 8: Global Market Y-o-Y Growth Comparison by Product Type, 2025 to 2035
  • Figure 9: Global Market Attractiveness Analysis by Product Type
  • Figure 10: Global Market Value Share and BPS Analysis by End Use, 2025 and 2035
  • Figure 11: Global Market Y-o-Y Growth Comparison by End Use, 2025 to 2035
  • Figure 12: Global Market Attractiveness Analysis by End Use
  • Figure 13: Global Market Value (USD Billion) Share and BPS Analysis by Region, 2025 and 2035
  • Figure 14: Global Market Y-o-Y Growth Comparison by Region, 2025 to 2035
  • Figure 15: Global Market Attractiveness Analysis by Region
  • Figure 16: North America Market Incremental $ Opportunity, 2025 to 2035
  • Figure 17: Latin America Market Incremental $ Opportunity, 2025 to 2035
  • Figure 18: Western Europe Market Incremental $ Opportunity, 2025 to 2035
  • Figure 19: Eastern Europe Market Incremental $ Opportunity, 2025 to 2035
  • Figure 20: East Asia Market Incremental $ Opportunity, 2025 to 2035
  • Figure 21: South Asia & Pacific Market Incremental $ Opportunity, 2025 to 2035
  • Figure 22: Middle East and Africa Market Incremental $ Opportunity, 2025 to 2035
  • Figure 23: North America Market Value Share and BPS Analysis by Country, 2025 and 2035
  • Figure 24: North America Market Value Share and BPS Analysis by Material Type, 2025 and 2035
  • Figure 25: North America Market Y-o-Y Growth Comparison by Material Type, 2025 to 2035
  • Figure 26: North America Market Attractiveness Analysis by Material Type
  • Figure 27: North America Market Value Share and BPS Analysis by Product Type, 2025 and 2035
  • Figure 28: North America Market Y-o-Y Growth Comparison by Product Type, 2025 to 2035
  • Figure 29: North America Market Attractiveness Analysis by Product Type
  • Figure 30: North America Market Value Share and BPS Analysis by End Use, 2025 and 2035
  • Figure 31: North America Market Y-o-Y Growth Comparison by End Use, 2025 to 2035
  • Figure 32: North America Market Attractiveness Analysis by End Use
  • Figure 33: Latin America Market Value Share and BPS Analysis by Country, 2025 and 2035
  • Figure 34: Latin America Market Value Share and BPS Analysis by Material Type, 2025 and 2035
  • Figure 35: Latin America Market Y-o-Y Growth Comparison by Material Type, 2025 to 2035
  • Figure 36: Latin America Market Attractiveness Analysis by Material Type
  • Figure 37: Latin America Market Value Share and BPS Analysis by Product Type, 2025 and 2035
  • Figure 38: Latin America Market Y-o-Y Growth Comparison by Product Type, 2025 to 2035
  • Figure 39: Latin America Market Attractiveness Analysis by Product Type
  • Figure 40: Latin America Market Value Share and BPS Analysis by End Use, 2025 and 2035
  • Figure 41: Latin America Market Y-o-Y Growth Comparison by End Use, 2025 to 2035
  • Figure 42: Latin America Market Attractiveness Analysis by End Use
  • Figure 43: Western Europe Market Value Share and BPS Analysis by Country, 2025 and 2035
  • Figure 44: Western Europe Market Value Share and BPS Analysis by Material Type, 2025 and 2035
  • Figure 45: Western Europe Market Y-o-Y Growth Comparison by Material Type, 2025 to 2035
  • Figure 46: Western Europe Market Attractiveness Analysis by Material Type
  • Figure 47: Western Europe Market Value Share and BPS Analysis by Product Type, 2025 and 2035
  • Figure 48: Western Europe Market Y-o-Y Growth Comparison by Product Type, 2025 to 2035
  • Figure 49: Western Europe Market Attractiveness Analysis by Product Type
  • Figure 50: Western Europe Market Value Share and BPS Analysis by End Use, 2025 and 2035
  • Figure 51: Western Europe Market Y-o-Y Growth Comparison by End Use, 2025 to 2035
  • Figure 52: Western Europe Market Attractiveness Analysis by End Use
  • Figure 53: Eastern Europe Market Value Share and BPS Analysis by Country, 2025 and 2035
  • Figure 54: Eastern Europe Market Value Share and BPS Analysis by Material Type, 2025 and 2035
  • Figure 55: Eastern Europe Market Y-o-Y Growth Comparison by Material Type, 2025 to 2035
  • Figure 56: Eastern Europe Market Attractiveness Analysis by Material Type
  • Figure 57: Eastern Europe Market Value Share and BPS Analysis by Product Type, 2025 and 2035
  • Figure 58: Eastern Europe Market Y-o-Y Growth Comparison by Product Type, 2025 to 2035
  • Figure 59: Eastern Europe Market Attractiveness Analysis by Product Type
  • Figure 60: Eastern Europe Market Value Share and BPS Analysis by End Use, 2025 and 2035
  • Figure 61: Eastern Europe Market Y-o-Y Growth Comparison by End Use, 2025 to 2035
  • Figure 62: Eastern Europe Market Attractiveness Analysis by End Use
  • Figure 63: East Asia Market Value Share and BPS Analysis by Country, 2025 and 2035
  • Figure 64: East Asia Market Value Share and BPS Analysis by Material Type, 2025 and 2035
  • Figure 65: East Asia Market Y-o-Y Growth Comparison by Material Type, 2025 to 2035
  • Figure 66: East Asia Market Attractiveness Analysis by Material Type
  • Figure 67: East Asia Market Value Share and BPS Analysis by Product Type, 2025 and 2035
  • Figure 68: East Asia Market Y-o-Y Growth Comparison by Product Type, 2025 to 2035
  • Figure 69: East Asia Market Attractiveness Analysis by Product Type
  • Figure 70: East Asia Market Value Share and BPS Analysis by End Use, 2025 and 2035
  • Figure 71: East Asia Market Y-o-Y Growth Comparison by End Use, 2025 to 2035
  • Figure 72: East Asia Market Attractiveness Analysis by End Use
  • Figure 73: South Asia & Pacific Market Value Share and BPS Analysis by Country, 2025 and 2035
  • Figure 74: South Asia & Pacific Market Value Share and BPS Analysis by Material Type, 2025 and 2035
  • Figure 75: South Asia & Pacific Market Y-o-Y Growth Comparison by Material Type, 2025 to 2035
  • Figure 76: South Asia & Pacific Market Attractiveness Analysis by Material Type
  • Figure 77: South Asia & Pacific Market Value Share and BPS Analysis by Product Type, 2025 and 2035
  • Figure 78: South Asia & Pacific Market Y-o-Y Growth Comparison by Product Type, 2025 to 2035
  • Figure 79: South Asia & Pacific Market Attractiveness Analysis by Product Type
  • Figure 80: South Asia & Pacific Market Value Share and BPS Analysis by End Use, 2025 and 2035
  • Figure 81: South Asia & Pacific Market Y-o-Y Growth Comparison by End Use, 2025 to 2035
  • Figure 82: South Asia & Pacific Market Attractiveness Analysis by End Use
  • Figure 83: Middle East and Africa Market Value Share and BPS Analysis by Country, 2025 and 2035
  • Figure 84: Middle East and Africa Market Value Share and BPS Analysis by Material Type, 2025 and 2035
  • Figure 85: Middle East and Africa Market Y-o-Y Growth Comparison by Material Type, 2025 to 2035
  • Figure 86: Middle East and Africa Market Attractiveness Analysis by Material Type
  • Figure 87: Middle East and Africa Market Value Share and BPS Analysis by Product Type, 2025 and 2035
  • Figure 88: Middle East and Africa Market Y-o-Y Growth Comparison by Product Type, 2025 to 2035
  • Figure 89: Middle East and Africa Market Attractiveness Analysis by Product Type
  • Figure 90: Middle East and Africa Market Value Share and BPS Analysis by End Use, 2025 and 2035
  • Figure 91: Middle East and Africa Market Y-o-Y Growth Comparison by End Use, 2025 to 2035
  • Figure 92: Middle East and Africa Market Attractiveness Analysis by End Use
  • Figure 93: Global Market - Tier Structure Analysis
  • Figure 94: Global Market - Company Share Analysis

Frequently Asked Questions

What is the market size of the custom binders market in 2025?

The global custom binders market is estimated to be valued at USD 34.6 million in 2025.

What is the expected CAGR for the custom binders market from 2025 to 2035?

The market is projected to grow at a CAGR of 6.4% during the forecast period.

Which product type holds the largest share in 2025?

Hardcover binders dominate with a 49% share in 2025 due to institutional preference.

Who are the leading players in the market?

Norwood Systems leads, followed by Avery Dennison Corporation, Samsill Corporation, and other regional players.

Which material type is most preferred in 2025?

Paper & Paperboard holds the largest material share at 54%, supported by regulatory trends favoring recyclability.

Explore Similar Insights

Future Market Insights

Custom Binders Market