Reports

- Global Locations -

Headquarters

Future Market Insights, Inc.

Christiana Corporate, 200
Continental Drive, Suite 401,
Newark, Delaware - 19713,
United States

T: +1-845-579-5705

Americas

Future Market Insights, Inc.

616 Corporate Way, Suite 2-9018,
Valley Cottage, NY 10989, United States

T: +1-347-918-3531

MEA

Future Market Insights

1602-6 Jumeirah Bay X2 Tower, Plot No: JLT-PH2-X2A,
Jumeirah Lakes Towers, Dubai,
United Arab Emirates

Europe

Future Market Insights

3rd Floor, 207 Regent Street,
W1B 3HH London
United Kingdom

T: + 44 (0) 20 8123 9659
D: +44 (0) 20 3287 4268

Asia Pacific

Future Market Insights

IndiaLand Global Tech Park, Unit UG-1, Behind Grand HighStreet, Phase 1, Hinjawadi, MH, Pune – 411057, India

Customer Communications Management Market Outlook (2023 to 2033)

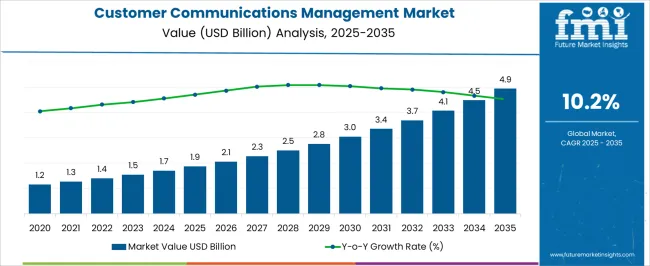
The customer communications management market size is projected to record a CAGR of 10.2% during the forecast period. The customer communications management market is projected to be valued at US$ 1,542.7 million in 2023 and is anticipated to reach US$ 4,086.9 million by 2033.

Customer communications management (CCM) enables businesses to communicate with customers effectively across various channels, including:

  • Web pages
  • Printed materials
  • Text messaging
  • Email

CCM software is getting upgraded due to Artificial Intelligence (AI) and Advanced Natural Language Processing (NLP). The customer communication management software market is anticipated to grow as a multi-channel market. Customer experience management becomes advanced and the usage of mobility and analytics for customer communication management increases.

Attribute Details
Customer Communications Management Market CAGR (2023 to 2033) 10.2%
Customer Communications Management Industry CAGR (2018 to 2022) 8.1%
Customer Communications Management Industry Value (2022) US$ 1,420.5 million
Customer Communications Management Market Value (2023) US$ 1,542.7 million
Customer Communications Management Industry Value (2033) US$ 4,086.9 million

Don't pay for what you don't need

Customize your report by selecting specific countries or regions and save 30%!

What are the Key Dynamics Governing the Growth of the Customer Communications Management Market?

The increasing demand for customer communication management systems is one of the primary factors driving the customer communication management market. To maintain a strong customer connection, businesses must give necessary documentation and promotional offers to customers regularly. As a result, the sales of customer communication management systems are anticipated to grow significantly during the forecast period.

The global demand for customer communication management systems is predicted to grow as customers in this technology-driven world want to communicate with businesses via their preferred channels, such as:

  • Voice
  • Email
  • Online
  • Mobile
  • SMS
  • Social media

Companies are encouraging client interactions across these many channels to stay competitive, which is further boosting the sales of customer communication management systems.

The demand for customer communication management systems is constantly growing, allowing software applications to be deployed without the hassle and expense of managing and obtaining the underlying software and hardware layers.

SMEs are emphasizing improved client interactions to add value to their goods, which, in turn, is propelling the sales of customer communication management systems.

The demand for customer communication management systems is projected to rise as it utilizes cloud-based environments to serve both large and small businesses. As a result, businesses are expected to migrate to a cloud environment to increase communication system flexibility. This is a key factor propelling the sales of customer communication management systems and the overall customer communication management market.

The demand for a customer communication management system offering a seamless CX may get hampered by the fact that these many channels remain in silos, preventing an organization from providing an Omni channel experience to customers.

Customers can choose between several channels without having to worry about losing knowledge or having to repeat what they already know. Over the course of the forecast period, several organizations migrating to Omni channels are expected to be multifold. As a result, the sales of customer communication management system is projected to rise throughout the forecast period.

Customer Communications Management Market Outlook for 2023 to 2033 in Comparison to Growth Exhibited in 2018 to 2022

From 2018 to 2022, the market expanded at a CAGR of 8.1%. In 2018, the market reached US$ 1,038.3 million, and in 2022, the market witnessed a revenue generation of US$ 1,420.5 million.

The demand for customer communication management systems is growing significantly. It is due to almost all financial institutions and other sectors have invested in customer communications management (CCM) systems in the last ten years to better manage their client contacts.

Organizations are finding it challenging to manage many digital clients and create a real multi-channel customer journey with old CCM platforms as new communication channels emerge. This factor is projected to affect the sales of customer communication management systems during the forecast period.

Organizations require a CCM capability that can do more than just get work done fast. It must be able to adapt, scale, and evolve quickly to meet the demands of the digital customer.

The demand for customer communication management systems spiked as organizations want communications that are consistent across numerous channels from a single source, as well as content that adjusts to the context of the customer.

In the estimated period, the market is predicted to register CAGR of 10.2%. In 2023, the market gained revenue of US$ 1,542.7 million and by 2033, the market is forecasted to attain US$ 4,086.9 million.

Sudip Saha
Sudip Saha

Principal Consultant

Talk to Analyst

Find your sweet spots for generating winning opportunities in this market.

Comparative View of the Adjacent Customer Communications Management Market

Customer Communications Management Market:

Attributes Customer Communications Management Market
CAGR (2023 to 2033) 10.2%
Market Value (2033) US$ 4,086.9 million
Growth Factor Increasing use of CCM solutions and services in various verticals.
Opportunity To add value to their goods, SMEs are emphasizing improved client interactions.
Key Trends Companies are encouraging client interactions across numerous platforms to stay competitive.

Customer Experience Management Market:

Attributes Customer Experience Management Market
CAGR (2023 to 2033) 14.8%
Market Value (2033) US$ 39,182.5 million
Growth Factor Virtual assistant integration to boost the market growth.
Opportunity Key players in the market are developing virtual assistants for their applications.
Key Trends Growing demand is also fueled by increasing agility and consistency across all consumer communications to discover and respond to market opportunities.

CRM Application Software Market:

Attributes CRM Application Software Market
CAGR (2023 to 2033) 14%
Market Value (2033) US$ 248.59 billion
Growth Factor Due to shifting economic challenges and a constantly evolving global business environment.
Opportunity Enterprises are putting a strong focus on customer engagement.
Key Trends Increased utilization of technologies like social media and mobility for customer relationship management.

Customer communication management system market growth is driven by the increasing adoption of artificial intelligence and augmented reality across industries.

Artificial Intelligence (AI) and Augmented Reality (AR) are being significantly used across industries such as retail, IT & telecom, and BFSI, among others, to improve the consumer experience. AI and machine learning integration across consumer experience solutions aid in the prediction of future customer behavior.

Predictive analytics and AI-enabled technologies make it easy to extract useful information from customer data. As a result, businesses concentrate on using sophisticated technology to improve the consumer experience. Additionally, to improve customer experience, businesses use advanced AI applications such as facial recognition, biometric measures, chatbots, and digital assistants.

Facebook Messenger Bots, for example, employ AI and machine learning to assist buyers in finding what they are looking for through easy chat. This factor contributes to the increased sales of customer communication management systems as well as the growth of customer communication management system market share.

The introduction of augmented reality in retail is likely to aid in the enhancement of the shopping experience. IKEA, for example, has incorporated augmented reality to display furniture in real-time, assisting shoppers in making purchasing decisions and lowering return rates. According to a survey, 55 percent of customers have AI-enabled interactions such as virtual assistants, bots, and other technologies.

What is the Segmentation Outlook for the Customer Communications Management Market?

The BFSI sector accounted for the majority of the customer communication management market share in 2022. The BFSI segment is anticipated to dominate the customer communication management market during the forecast period. This is mostly due to the need to capitalize on market opportunities across many geographies.

Outsourcing service benefits the BFSI sector since it lowers operational costs and improves customer service, allowing enterprises in this area to focus on their primary business.

Which Deployment Mode is likely to Lead the Customer Communications Management Market?

Segment On-premise
Market Share (2022) 63.2%

In 2022, the on-premise deployment segment held a significant share of the customer communication management market. This segment expanded at a CAGR of 9.2%. The value share accumulated by the segment was 63.2% in 2022.

On-premises deployment is frequently utilized in industries such as banking, finance, and insurance, as well as government and defense, to secure

  • Sensitive data
  • Financial Records
  • Accounting data
  • Money transactions

The typical method of deploying CCM solutions across businesses is on-premise deployment. This deployment mode is opted for by enterprises whose user credentials are critical for business operations. This is because it gives them much control over their IT systems.

The cloud deployment segment is predicted to increase at an exponential rate during the forecast period due to the increasing acceptance of cloud-based solutions.

Get the data you need at a Fraction of the cost

Personalize your report by choosing insights you need
and save 40%!

What is the Regional Analysis for the Customer Communications Management Market?

Regions/ Countries Value Share (2022)
North America 26.5%
Europe 23.4%
The United States 18.2%
Germany 7.3%
Japan 5.1%
Australia 2.4%

North America is likely to hold a significant share of the global customer communication management market with a CAGR of 9.8%. It is due to different prominent businesses in the industry like Open Text Corporation, Adobe, and others in the region.

The customer communication management market opportunity is growing due to the increased usage of technologies like social media and mobility for customer relationship management in these countries.

Countries CAGR (2023 to 2033)
China 9.8%
India 11.2%
The United Kingdom 9.1%

Customer communication management projects are becoming increasingly popular in Asia Pacific countries. China, Japan, India, and the rest of Asia Pacific are the sub-segments of the CCM market in Asia Pacific. These countries are key contributors to the region's customer communication management market expansion.

Organizations have increased their offers in the customer communication management market as internet penetration and per-user online consumption have increased. To compete in the market and seize additional chances, SMEs in the region have boosted their investment in new technologies. These technologies include AI, machine learning, and data analytics. For these companies, implementing CCM solutions has become feasible.

Organizations in the region's industrialized economies, such as Japan, Australia, New Zealand, and Singapore, have embraced cloud computing on a big scale. As cloud technology is employed as a data store for subsequent analysis, the customer communication management market is likely to increase as a result of its growing popularity.
How is the Competition in the Customer Communications Management Market?

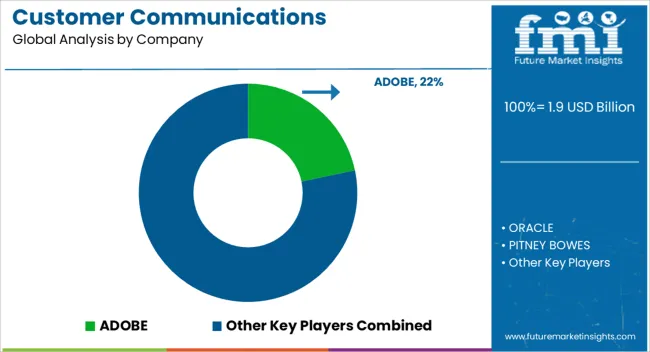
Key players in the customer communication management market are concentrating their efforts on growing their consumer base in new countries. To improve their market share and profitability, these companies are relying on strategic collaborative initiatives.

Recent Developments in the Customer Communications Management Market:

  • Doxim released an omnichannel customer communication solution in the United Kingdom in June 2021 to assist its clients in excelling at omnichannel communications and maximizing the enterprise value of all customer interactions.
  • In December 2020, Newgen Software Technologies Limited launched OmniOMS 9.0, which is an enhanced version of the CCM system. The system consists of thick client enhancements, import/export templates, chart feature enhancements, business rule enhancements, and web design enhancements.
  • Oracle Corporation launched the latest cloud-based customer experience management solutions for the communication industry in November 2020. This customer experience solution gives communications service providers data so they may better understand their customers and offer personalized products, services, and care.
  • OVHCloud and Capgemini came into an international alliance partnership agreement in 2021, to cater to the requirements of private and public organizations.
  • Capgemini offered its Digital Cloud Platform in December 2020 for AWS and SAP solutions. This is being done to simplify and decrease costs for users implementing SAP, thus empowering them to focus on their primary business.
  • In October 2020, Adobe introduced Advertising Cloud DSP outfitted with new features. The previously available Campaigns Beta views have now become the default mode of Campaigns views for simplified workflows, fast insights, and customized views. Other changes have also been made.
  • Oracle officially revealed the launch of Oracle Dedicated Region Cloud@Customer in July 2020. The solution emerged in response to strong customer demand. It is an entirely managed cloud area that delivers Oracle’s 2nd Gen cloud services to customer data centers.
  • Oracle Documaker 12.6.4 was unveiled by Oracle in June 2020.

Key Players Operating in the Market

  • Adobe
  • Oracle
  • Pitney Bowes India Private Limited
  • Capgemini
  • Newgen Software Technologies Limited

Key Segments in the Market

By Component:

  • Solutions
  • Services

By Deployment Mode:

  • On-premises
  • Cloud

By Organization Size:

  • Large Enterprises
  • SMEs

By Verticals:

  • IT and Telecom
  • Retail and eCommerce
  • BFSI
  • Healthcare
  • Travel and Hospitality
  • Government
  • Utilities
  • Other

By Region:

  • North America
  • Europe
  • Asia Pacific
  • The Middle East and Africa
  • Latin America

Frequently Asked Questions

What is the growth rate from 2023 to 2033?

The market will expand at a 10.2% CAGR from 2023 to 2033.

What is the 2023 market value?

The market in 2023 totals US$ 1,542.7 million.

What was the market share of the on premise deployment segment in 2022?

The segment held a market share of 63.2% in 2022.

What is the market value for 2033?

By 2033, the market will reach US$ 4,086.9 million.

Who are some key manufacturers?

Adobe, Oracle, and Capgemini are some key players.

Table of Content

1. Executive Summary

    1.1. Global Market Outlook

    1.2. Demand-side Trends

    1.3. Supply-side Trends

    1.4. Technology Roadmap Analysis

    1.5. Analysis and Recommendations

2. Market Overview

    2.1. Market Coverage / Taxonomy

    2.2. Market Definition / Scope / Limitations

3. Market Background

    3.1. Market Dynamics

        3.1.1. Drivers

        3.1.2. Restraints

        3.1.3. Opportunity

        3.1.4. Trends

    3.2. Scenario Forecast

        3.2.1. Demand in Optimistic Scenario

        3.2.2. Demand in Likely Scenario

        3.2.3. Demand in Conservative Scenario

    3.3. Opportunity Map Analysis

    3.4. Investment Feasibility Matrix

    3.5. PESTLE and Porter’s Analysis

    3.6. Regulatory Landscape

        3.6.1. By Key Regions

        3.6.2. By Key Countries

    3.7. Regional Parent Market Outlook

4. Global Market Analysis 2018 to 2022 and Forecast, 2023 to 2033

    4.1. Historical Market Size Value (US$ Million) Analysis, 2018 to 2022

    4.2. Current and Future Market Size Value (US$ Million) Projections, 2023 to 2033

        4.2.1. Y-o-Y Growth Trend Analysis

        4.2.2. Absolute $ Opportunity Analysis

5. Global Market Analysis 2018 to 2022 and Forecast 2023 to 2033, By Component

    5.1. Introduction / Key Findings

    5.2. Historical Market Size Value (US$ Million) Analysis By Component, 2018 to 2022

    5.3. Current and Future Market Size Value (US$ Million) Analysis and Forecast By Component, 2023 to 2033

        5.3.1. Solutions

        5.3.2. Services

    5.4. Y-o-Y Growth Trend Analysis By Component, 2018 to 2022

    5.5. Absolute $ Opportunity Analysis By Component, 2023 to 2033

6. Global Market Analysis 2018 to 2022 and Forecast 2023 to 2033, By Deployment Mode

    6.1. Introduction / Key Findings

    6.2. Historical Market Size Value (US$ Million) Analysis By Deployment Mode, 2018 to 2022

    6.3. Current and Future Market Size Value (US$ Million) Analysis and Forecast By Deployment Mode, 2023 to 2033

        6.3.1. On-premises

        6.3.2. Cloud

    6.4. Y-o-Y Growth Trend Analysis By Deployment Mode, 2018 to 2022

    6.5. Absolute $ Opportunity Analysis By Deployment Mode, 2023 to 2033

7. Global Market Analysis 2018 to 2022 and Forecast 2023 to 2033, By Organization Size

    7.1. Introduction / Key Findings

    7.2. Historical Market Size Value (US$ Million) Analysis By Organization Size, 2018 to 2022

    7.3. Current and Future Market Size Value (US$ Million) Analysis and Forecast By Organization Size, 2023 to 2033

        7.3.1. Large Enterprises

        7.3.2. SMEs

    7.4. Y-o-Y Growth Trend Analysis By Organization Size, 2018 to 2022

    7.5. Absolute $ Opportunity Analysis By Organization Size, 2023 to 2033

8. Global Market Analysis 2018 to 2022 and Forecast 2023 to 2033, By Verticals

    8.1. Introduction / Key Findings

    8.2. Historical Market Size Value (US$ Million) Analysis By Verticals, 2018 to 2022

    8.3. Current and Future Market Size Value (US$ Million) Analysis and Forecast By Verticals, 2023 to 2033

        8.3.1. IT and Telecom

        8.3.2. Retail and eCommerce

        8.3.3. BFSI

        8.3.4. Healthcare

        8.3.5. Travel and Hospitality

        8.3.6. Government

        8.3.7. Utilities

        8.3.8. Others

    8.4. Y-o-Y Growth Trend Analysis By Verticals, 2018 to 2022

    8.5. Absolute $ Opportunity Analysis By Verticals, 2023 to 2033

9. Global Market Analysis 2018 to 2022 and Forecast 2023 to 2033, By Region

    9.1. Introduction

    9.2. Historical Market Size Value (US$ Million) Analysis By Region, 2018 to 2022

    9.3. Current Market Size Value (US$ Million) Analysis and Forecast By Region, 2023 to 2033

        9.3.1. North America

        9.3.2. Latin America

        9.3.3. Europe

        9.3.4. South Asia

        9.3.5. East Asia

        9.3.6. Oceania

        9.3.7. MEA

    9.4. Market Attractiveness Analysis By Region

10. North America Market Analysis 2018 to 2022 and Forecast 2023 to 2033, By Country

    10.1. Historical Market Size Value (US$ Million) Trend Analysis By Market Taxonomy, 2018 to 2022

    10.2. Market Size Value (US$ Million) Forecast By Market Taxonomy, 2023 to 2033

        10.2.1. By Country

            10.2.1.1. The USA

            10.2.1.2. Canada

        10.2.2. By Component

        10.2.3. By Deployment Mode

        10.2.4. By Organization Size

        10.2.5. By Verticals

    10.3. Market Attractiveness Analysis

        10.3.1. By Country

        10.3.2. By Component

        10.3.3. By Deployment Mode

        10.3.4. By Organization Size

        10.3.5. By Verticals

    10.4. Key Takeaways

11. Latin America Market Analysis 2018 to 2022 and Forecast 2023 to 2033, By Country

    11.1. Historical Market Size Value (US$ Million) Trend Analysis By Market Taxonomy, 2018 to 2022

    11.2. Market Size Value (US$ Million) Forecast By Market Taxonomy, 2023 to 2033

        11.2.1. By Country

            11.2.1.1. Brazil

            11.2.1.2. Mexico

            11.2.1.3. Rest of Latin America

        11.2.2. By Component

        11.2.3. By Deployment Mode

        11.2.4. By Organization Size

        11.2.5. By Verticals

    11.3. Market Attractiveness Analysis

        11.3.1. By Country

        11.3.2. By Component

        11.3.3. By Deployment Mode

        11.3.4. By Organization Size

        11.3.5. By Verticals

    11.4. Key Takeaways

12. Europe Market Analysis 2018 to 2022 and Forecast 2023 to 2033, By Country

    12.1. Historical Market Size Value (US$ Million) Trend Analysis By Market Taxonomy, 2018 to 2022

    12.2. Market Size Value (US$ Million) Forecast By Market Taxonomy, 2023 to 2033

        12.2.1. By Country

            12.2.1.1. Germany

            12.2.1.2. United Kingdom

            12.2.1.3. France

            12.2.1.4. Spain

            12.2.1.5. Italy

            12.2.1.6. Rest of Europe

        12.2.2. By Component

        12.2.3. By Deployment Mode

        12.2.4. By Organization Size

        12.2.5. By Verticals

    12.3. Market Attractiveness Analysis

        12.3.1. By Country

        12.3.2. By Component

        12.3.3. By Deployment Mode

        12.3.4. By Organization Size

        12.3.5. By Verticals

    12.4. Key Takeaways

13. South Asia Market Analysis 2018 to 2022 and Forecast 2023 to 2033, By Country

    13.1. Historical Market Size Value (US$ Million) Trend Analysis By Market Taxonomy, 2018 to 2022

    13.2. Market Size Value (US$ Million) Forecast By Market Taxonomy, 2023 to 2033

        13.2.1. By Country

            13.2.1.1. India

            13.2.1.2. Malaysia

            13.2.1.3. Singapore

            13.2.1.4. Thailand

            13.2.1.5. Rest of South Asia

        13.2.2. By Component

        13.2.3. By Deployment Mode

        13.2.4. By Organization Size

        13.2.5. By Verticals

    13.3. Market Attractiveness Analysis

        13.3.1. By Country

        13.3.2. By Component

        13.3.3. By Deployment Mode

        13.3.4. By Organization Size

        13.3.5. By Verticals

    13.4. Key Takeaways

14. East Asia Market Analysis 2018 to 2022 and Forecast 2023 to 2033, By Country

    14.1. Historical Market Size Value (US$ Million) Trend Analysis By Market Taxonomy, 2018 to 2022

    14.2. Market Size Value (US$ Million) Forecast By Market Taxonomy, 2023 to 2033

        14.2.1. By Country

            14.2.1.1. China

            14.2.1.2. Japan

            14.2.1.3. South Korea

        14.2.2. By Component

        14.2.3. By Deployment Mode

        14.2.4. By Organization Size

        14.2.5. By Verticals

    14.3. Market Attractiveness Analysis

        14.3.1. By Country

        14.3.2. By Component

        14.3.3. By Deployment Mode

        14.3.4. By Organization Size

        14.3.5. By Verticals

    14.4. Key Takeaways

15. Oceania Market Analysis 2018 to 2022 and Forecast 2023 to 2033, By Country

    15.1. Historical Market Size Value (US$ Million) Trend Analysis By Market Taxonomy, 2018 to 2022

    15.2. Market Size Value (US$ Million) Forecast By Market Taxonomy, 2023 to 2033

        15.2.1. By Country

            15.2.1.1. Australia

            15.2.1.2. New Zealand

        15.2.2. By Component

        15.2.3. By Deployment Mode

        15.2.4. By Organization Size

        15.2.5. By Verticals

    15.3. Market Attractiveness Analysis

        15.3.1. By Country

        15.3.2. By Component

        15.3.3. By Deployment Mode

        15.3.4. By Organization Size

        15.3.5. By Verticals

    15.4. Key Takeaways

16. MEA Market Analysis 2018 to 2022 and Forecast 2023 to 2033, By Country

    16.1. Historical Market Size Value (US$ Million) Trend Analysis By Market Taxonomy, 2018 to 2022

    16.2. Market Size Value (US$ Million) Forecast By Market Taxonomy, 2023 to 2033

        16.2.1. By Country

            16.2.1.1. GCC Countries

            16.2.1.2. South Africa

            16.2.1.3. Israel

            16.2.1.4. Rest of MEA

        16.2.2. By Component

        16.2.3. By Deployment Mode

        16.2.4. By Organization Size

        16.2.5. By Verticals

    16.3. Market Attractiveness Analysis

        16.3.1. By Country

        16.3.2. By Component

        16.3.3. By Deployment Mode

        16.3.4. By Organization Size

        16.3.5. By Verticals

    16.4. Key Takeaways

17. Key Countries Market Analysis

    17.1. USA

        17.1.1. Pricing Analysis

        17.1.2. Market Share Analysis, 2022

            17.1.2.1. By Component

            17.1.2.2. By Deployment Mode

            17.1.2.3. By Organization Size

            17.1.2.4. By Verticals

    17.2. Canada

        17.2.1. Pricing Analysis

        17.2.2. Market Share Analysis, 2022

            17.2.2.1. By Component

            17.2.2.2. By Deployment Mode

            17.2.2.3. By Organization Size

            17.2.2.4. By Verticals

    17.3. Brazil

        17.3.1. Pricing Analysis

        17.3.2. Market Share Analysis, 2022

            17.3.2.1. By Component

            17.3.2.2. By Deployment Mode

            17.3.2.3. By Organization Size

            17.3.2.4. By Verticals

    17.4. Mexico

        17.4.1. Pricing Analysis

        17.4.2. Market Share Analysis, 2022

            17.4.2.1. By Component

            17.4.2.2. By Deployment Mode

            17.4.2.3. By Organization Size

            17.4.2.4. By Verticals

    17.5. Germany

        17.5.1. Pricing Analysis

        17.5.2. Market Share Analysis, 2022

            17.5.2.1. By Component

            17.5.2.2. By Deployment Mode

            17.5.2.3. By Organization Size

            17.5.2.4. By Verticals

    17.6. United Kingdom

        17.6.1. Pricing Analysis

        17.6.2. Market Share Analysis, 2022

            17.6.2.1. By Component

            17.6.2.2. By Deployment Mode

            17.6.2.3. By Organization Size

            17.6.2.4. By Verticals

    17.7. France

        17.7.1. Pricing Analysis

        17.7.2. Market Share Analysis, 2022

            17.7.2.1. By Component

            17.7.2.2. By Deployment Mode

            17.7.2.3. By Organization Size

            17.7.2.4. By Verticals

    17.8. Spain

        17.8.1. Pricing Analysis

        17.8.2. Market Share Analysis, 2022

            17.8.2.1. By Component

            17.8.2.2. By Deployment Mode

            17.8.2.3. By Organization Size

            17.8.2.4. By Verticals

    17.9. Italy

        17.9.1. Pricing Analysis

        17.9.2. Market Share Analysis, 2022

            17.9.2.1. By Component

            17.9.2.2. By Deployment Mode

            17.9.2.3. By Organization Size

            17.9.2.4. By Verticals

    17.10. India

        17.10.1. Pricing Analysis

        17.10.2. Market Share Analysis, 2022

            17.10.2.1. By Component

            17.10.2.2. By Deployment Mode

            17.10.2.3. By Organization Size

            17.10.2.4. By Verticals

    17.11. Malaysia

        17.11.1. Pricing Analysis

        17.11.2. Market Share Analysis, 2022

            17.11.2.1. By Component

            17.11.2.2. By Deployment Mode

            17.11.2.3. By Organization Size

            17.11.2.4. By Verticals

    17.12. Singapore

        17.12.1. Pricing Analysis

        17.12.2. Market Share Analysis, 2022

            17.12.2.1. By Component

            17.12.2.2. By Deployment Mode

            17.12.2.3. By Organization Size

            17.12.2.4. By Verticals

    17.13. Thailand

        17.13.1. Pricing Analysis

        17.13.2. Market Share Analysis, 2022

            17.13.2.1. By Component

            17.13.2.2. By Deployment Mode

            17.13.2.3. By Organization Size

            17.13.2.4. By Verticals

    17.14. China

        17.14.1. Pricing Analysis

        17.14.2. Market Share Analysis, 2022

            17.14.2.1. By Component

            17.14.2.2. By Deployment Mode

            17.14.2.3. By Organization Size

            17.14.2.4. By Verticals

    17.15. Japan

        17.15.1. Pricing Analysis

        17.15.2. Market Share Analysis, 2022

            17.15.2.1. By Component

            17.15.2.2. By Deployment Mode

            17.15.2.3. By Organization Size

            17.15.2.4. By Verticals

    17.16. South Korea

        17.16.1. Pricing Analysis

        17.16.2. Market Share Analysis, 2022

            17.16.2.1. By Component

            17.16.2.2. By Deployment Mode

            17.16.2.3. By Organization Size

            17.16.2.4. By Verticals

    17.17. Australia

        17.17.1. Pricing Analysis

        17.17.2. Market Share Analysis, 2022

            17.17.2.1. By Component

            17.17.2.2. By Deployment Mode

            17.17.2.3. By Organization Size

            17.17.2.4. By Verticals

    17.18. New Zealand

        17.18.1. Pricing Analysis

        17.18.2. Market Share Analysis, 2022

            17.18.2.1. By Component

            17.18.2.2. By Deployment Mode

            17.18.2.3. By Organization Size

            17.18.2.4. By Verticals

    17.19. GCC Countries

        17.19.1. Pricing Analysis

        17.19.2. Market Share Analysis, 2022

            17.19.2.1. By Component

            17.19.2.2. By Deployment Mode

            17.19.2.3. By Organization Size

            17.19.2.4. By Verticals

    17.20. South Africa

        17.20.1. Pricing Analysis

        17.20.2. Market Share Analysis, 2022

            17.20.2.1. By Component

            17.20.2.2. By Deployment Mode

            17.20.2.3. By Organization Size

            17.20.2.4. By Verticals

    17.21. Israel

        17.21.1. Pricing Analysis

        17.21.2. Market Share Analysis, 2022

            17.21.2.1. By Component

            17.21.2.2. By Deployment Mode

            17.21.2.3. By Organization Size

            17.21.2.4. By Verticals

18. Market Structure Analysis

    18.1. Competition Dashboard

    18.2. Competition Benchmarking

    18.3. Market Share Analysis of Top Players

        18.3.1. By Regional

        18.3.2. By Component

        18.3.3. By Deployment Mode

        18.3.4. By Organization Size

        18.3.5. By Verticals

19. Competition Analysis

    19.1. Competition Deep Dive

        19.1.1. ADOBE

            19.1.1.1. Overview

            19.1.1.2. Product Portfolio

            19.1.1.3. Profitability by Market Segments

            19.1.1.4. Sales Footprint

            19.1.1.5. Strategy Overview

                19.1.1.5.1. Marketing Strategy

        19.1.2. ORACLE

            19.1.2.1. Overview

            19.1.2.2. Product Portfolio

            19.1.2.3. Profitability by Market Segments

            19.1.2.4. Sales Footprint

            19.1.2.5. Strategy Overview

                19.1.2.5.1. Marketing Strategy

        19.1.3. PITNEY BOWES

            19.1.3.1. Overview

            19.1.3.2. Product Portfolio

            19.1.3.3. Profitability by Market Segments

            19.1.3.4. Sales Footprint

            19.1.3.5. Strategy Overview

                19.1.3.5.1. Marketing Strategy

        19.1.4. CAPGEMINI

            19.1.4.1. Overview

            19.1.4.2. Product Portfolio

            19.1.4.3. Profitability by Market Segments

            19.1.4.4. Sales Footprint

            19.1.4.5. Strategy Overview

                19.1.4.5.1. Marketing Strategy

        19.1.5. NEWGEN SOFTWARE

            19.1.5.1. Overview

            19.1.5.2. Product Portfolio

            19.1.5.3. Profitability by Market Segments

            19.1.5.4. Sales Footprint

            19.1.5.5. Strategy Overview

                19.1.5.5.1. Marketing Strategy

        19.1.6. Messagepoint Inc.

            19.1.6.1. Overview

            19.1.6.2. Product Portfolio

            19.1.6.3. Profitability by Market Segments

            19.1.6.4. Sales Footprint

            19.1.6.5. Strategy Overview

                19.1.6.5.1. Marketing Strategy

        19.1.7. Topdown Inc.

            19.1.7.1. Overview

            19.1.7.2. Product Portfolio

            19.1.7.3. Profitability by Market Segments

            19.1.7.4. Sales Footprint

            19.1.7.5. Strategy Overview

                19.1.7.5.1. Marketing Strategy

        19.1.8. Cincom Systems Inc.

            19.1.8.1. Overview

            19.1.8.2. Product Portfolio

            19.1.8.3. Profitability by Market Segments

            19.1.8.4. Sales Footprint

            19.1.8.5. Strategy Overview

                19.1.8.5.1. Marketing Strategy

        19.1.9. Zoho Corporation

            19.1.9.1. Overview

            19.1.9.2. Product Portfolio

            19.1.9.3. Profitability by Market Segments

            19.1.9.4. Sales Footprint

            19.1.9.5. Strategy Overview

                19.1.9.5.1. Marketing Strategy

        19.1.10. A Lexmark Company

            19.1.10.1. Overview

            19.1.10.2. Product Portfolio

            19.1.10.3. Profitability by Market Segments

            19.1.10.4. Sales Footprint

            19.1.10.5. Strategy Overview

                19.1.10.5.1. Marketing Strategy

20. Assumptions & Acronyms Used

21. Research Methodology

Don't pay for what you don't need

Customize your report by selecting specific countries or regions and save 30%!

List of Tables

Table 1: Global Market Value (US$ Million) Forecast by Region, 2018 to 2033

Table 2: Global Market Value (US$ Million) Forecast by Component, 2018 to 2033

Table 3: Global Market Value (US$ Million) Forecast by Deployment Mode, 2018 to 2033

Table 4: Global Market Value (US$ Million) Forecast by Organization Size, 2018 to 2033

Table 5: Global Market Value (US$ Million) Forecast by Verticals, 2018 to 2033

Table 6: North America Market Value (US$ Million) Forecast by Country, 2018 to 2033

Table 7: North America Market Value (US$ Million) Forecast by Component, 2018 to 2033

Table 8: North America Market Value (US$ Million) Forecast by Deployment Mode, 2018 to 2033

Table 9: North America Market Value (US$ Million) Forecast by Organization Size, 2018 to 2033

Table 10: North America Market Value (US$ Million) Forecast by Verticals, 2018 to 2033

Table 11: Latin America Market Value (US$ Million) Forecast by Country, 2018 to 2033

Table 12: Latin America Market Value (US$ Million) Forecast by Component, 2018 to 2033

Table 13: Latin America Market Value (US$ Million) Forecast by Deployment Mode, 2018 to 2033

Table 14: Latin America Market Value (US$ Million) Forecast by Organization Size, 2018 to 2033

Table 15: Latin America Market Value (US$ Million) Forecast by Verticals, 2018 to 2033

Table 16: Europe Market Value (US$ Million) Forecast by Country, 2018 to 2033

Table 17: Europe Market Value (US$ Million) Forecast by Component, 2018 to 2033

Table 18: Europe Market Value (US$ Million) Forecast by Deployment Mode, 2018 to 2033

Table 19: Europe Market Value (US$ Million) Forecast by Organization Size, 2018 to 2033

Table 20: Europe Market Value (US$ Million) Forecast by Verticals, 2018 to 2033

Table 21: South Asia Market Value (US$ Million) Forecast by Country, 2018 to 2033

Table 22: South Asia Market Value (US$ Million) Forecast by Component, 2018 to 2033

Table 23: South Asia Market Value (US$ Million) Forecast by Deployment Mode, 2018 to 2033

Table 24: South Asia Market Value (US$ Million) Forecast by Organization Size, 2018 to 2033

Table 25: South Asia Market Value (US$ Million) Forecast by Verticals, 2018 to 2033

Table 26: East Asia Market Value (US$ Million) Forecast by Country, 2018 to 2033

Table 27: East Asia Market Value (US$ Million) Forecast by Component, 2018 to 2033

Table 28: East Asia Market Value (US$ Million) Forecast by Deployment Mode, 2018 to 2033

Table 29: East Asia Market Value (US$ Million) Forecast by Organization Size, 2018 to 2033

Table 30: East Asia Market Value (US$ Million) Forecast by Verticals, 2018 to 2033

Table 31: Oceania Market Value (US$ Million) Forecast by Country, 2018 to 2033

Table 32: Oceania Market Value (US$ Million) Forecast by Component, 2018 to 2033

Table 33: Oceania Market Value (US$ Million) Forecast by Deployment Mode, 2018 to 2033

Table 34: Oceania Market Value (US$ Million) Forecast by Organization Size, 2018 to 2033

Table 35: Oceania Market Value (US$ Million) Forecast by Verticals, 2018 to 2033

Table 36: MEA Market Value (US$ Million) Forecast by Country, 2018 to 2033

Table 37: MEA Market Value (US$ Million) Forecast by Component, 2018 to 2033

Table 38: MEA Market Value (US$ Million) Forecast by Deployment Mode, 2018 to 2033

Table 39: MEA Market Value (US$ Million) Forecast by Organization Size, 2018 to 2033

Table 40: MEA Market Value (US$ Million) Forecast by Verticals, 2018 to 2033
Sudip Saha
Sudip Saha

Principal Consultant

Talk to Analyst

Find your sweet spots for generating winning opportunities in this market.

List of Charts

Figure 1: Global Market Value (US$ Million) by Component, 2023 to 2033

Figure 2: Global Market Value (US$ Million) by Deployment Mode, 2023 to 2033

Figure 3: Global Market Value (US$ Million) by Organization Size, 2023 to 2033

Figure 4: Global Market Value (US$ Million) by Verticals, 2023 to 2033

Figure 5: Global Market Value (US$ Million) by Region, 2023 to 2033

Figure 6: Global Market Value (US$ Million) Analysis by Region, 2018 to 2033

Figure 7: Global Market Value Share (%) and BPS Analysis by Region, 2023 to 2033

Figure 8: Global Market Y-o-Y Growth (%) Projections by Region, 2023 to 2033

Figure 9: Global Market Value (US$ Million) Analysis by Component, 2018 to 2033

Figure 10: Global Market Value Share (%) and BPS Analysis by Component, 2023 to 2033

Figure 11: Global Market Y-o-Y Growth (%) Projections by Component, 2023 to 2033

Figure 12: Global Market Value (US$ Million) Analysis by Deployment Mode, 2018 to 2033

Figure 13: Global Market Value Share (%) and BPS Analysis by Deployment Mode, 2023 to 2033

Figure 14: Global Market Y-o-Y Growth (%) Projections by Deployment Mode, 2023 to 2033

Figure 15: Global Market Value (US$ Million) Analysis by Organization Size, 2018 to 2033

Figure 16: Global Market Value Share (%) and BPS Analysis by Organization Size, 2023 to 2033

Figure 17: Global Market Y-o-Y Growth (%) Projections by Organization Size, 2023 to 2033

Figure 18: Global Market Value (US$ Million) Analysis by Verticals, 2018 to 2033

Figure 19: Global Market Value Share (%) and BPS Analysis by Verticals, 2023 to 2033

Figure 20: Global Market Y-o-Y Growth (%) Projections by Verticals, 2023 to 2033

Figure 21: Global Market Attractiveness by Component, 2023 to 2033

Figure 22: Global Market Attractiveness by Deployment Mode, 2023 to 2033

Figure 23: Global Market Attractiveness by Organization Size, 2023 to 2033

Figure 24: Global Market Attractiveness by Verticals, 2023 to 2033

Figure 25: Global Market Attractiveness by Region, 2023 to 2033

Figure 26: North America Market Value (US$ Million) by Component, 2023 to 2033

Figure 27: North America Market Value (US$ Million) by Deployment Mode, 2023 to 2033

Figure 28: North America Market Value (US$ Million) by Organization Size, 2023 to 2033

Figure 29: North America Market Value (US$ Million) by Verticals, 2023 to 2033

Figure 30: North America Market Value (US$ Million) by Country, 2023 to 2033

Figure 31: North America Market Value (US$ Million) Analysis by Country, 2018 to 2033

Figure 32: North America Market Value Share (%) and BPS Analysis by Country, 2023 to 2033

Figure 33: North America Market Y-o-Y Growth (%) Projections by Country, 2023 to 2033

Figure 34: North America Market Value (US$ Million) Analysis by Component, 2018 to 2033

Figure 35: North America Market Value Share (%) and BPS Analysis by Component, 2023 to 2033

Figure 36: North America Market Y-o-Y Growth (%) Projections by Component, 2023 to 2033

Figure 37: North America Market Value (US$ Million) Analysis by Deployment Mode, 2018 to 2033

Figure 38: North America Market Value Share (%) and BPS Analysis by Deployment Mode, 2023 to 2033

Figure 39: North America Market Y-o-Y Growth (%) Projections by Deployment Mode, 2023 to 2033

Figure 40: North America Market Value (US$ Million) Analysis by Organization Size, 2018 to 2033

Figure 41: North America Market Value Share (%) and BPS Analysis by Organization Size, 2023 to 2033

Figure 42: North America Market Y-o-Y Growth (%) Projections by Organization Size, 2023 to 2033

Figure 43: North America Market Value (US$ Million) Analysis by Verticals, 2018 to 2033

Figure 44: North America Market Value Share (%) and BPS Analysis by Verticals, 2023 to 2033

Figure 45: North America Market Y-o-Y Growth (%) Projections by Verticals, 2023 to 2033

Figure 46: North America Market Attractiveness by Component, 2023 to 2033

Figure 47: North America Market Attractiveness by Deployment Mode, 2023 to 2033

Figure 48: North America Market Attractiveness by Organization Size, 2023 to 2033

Figure 49: North America Market Attractiveness by Verticals, 2023 to 2033

Figure 50: North America Market Attractiveness by Country, 2023 to 2033

Figure 51: Latin America Market Value (US$ Million) by Component, 2023 to 2033

Figure 52: Latin America Market Value (US$ Million) by Deployment Mode, 2023 to 2033

Figure 53: Latin America Market Value (US$ Million) by Organization Size, 2023 to 2033

Figure 54: Latin America Market Value (US$ Million) by Verticals, 2023 to 2033

Figure 55: Latin America Market Value (US$ Million) by Country, 2023 to 2033

Figure 56: Latin America Market Value (US$ Million) Analysis by Country, 2018 to 2033

Figure 57: Latin America Market Value Share (%) and BPS Analysis by Country, 2023 to 2033

Figure 58: Latin America Market Y-o-Y Growth (%) Projections by Country, 2023 to 2033

Figure 59: Latin America Market Value (US$ Million) Analysis by Component, 2018 to 2033

Figure 60: Latin America Market Value Share (%) and BPS Analysis by Component, 2023 to 2033

Figure 61: Latin America Market Y-o-Y Growth (%) Projections by Component, 2023 to 2033

Figure 62: Latin America Market Value (US$ Million) Analysis by Deployment Mode, 2018 to 2033

Figure 63: Latin America Market Value Share (%) and BPS Analysis by Deployment Mode, 2023 to 2033

Figure 64: Latin America Market Y-o-Y Growth (%) Projections by Deployment Mode, 2023 to 2033

Figure 65: Latin America Market Value (US$ Million) Analysis by Organization Size, 2018 to 2033

Figure 66: Latin America Market Value Share (%) and BPS Analysis by Organization Size, 2023 to 2033

Figure 67: Latin America Market Y-o-Y Growth (%) Projections by Organization Size, 2023 to 2033

Figure 68: Latin America Market Value (US$ Million) Analysis by Verticals, 2018 to 2033

Figure 69: Latin America Market Value Share (%) and BPS Analysis by Verticals, 2023 to 2033

Figure 70: Latin America Market Y-o-Y Growth (%) Projections by Verticals, 2023 to 2033

Figure 71: Latin America Market Attractiveness by Component, 2023 to 2033

Figure 72: Latin America Market Attractiveness by Deployment Mode, 2023 to 2033

Figure 73: Latin America Market Attractiveness by Organization Size, 2023 to 2033

Figure 74: Latin America Market Attractiveness by Verticals, 2023 to 2033

Figure 75: Latin America Market Attractiveness by Country, 2023 to 2033

Figure 76: Europe Market Value (US$ Million) by Component, 2023 to 2033

Figure 77: Europe Market Value (US$ Million) by Deployment Mode, 2023 to 2033

Figure 78: Europe Market Value (US$ Million) by Organization Size, 2023 to 2033

Figure 79: Europe Market Value (US$ Million) by Verticals, 2023 to 2033

Figure 80: Europe Market Value (US$ Million) by Country, 2023 to 2033

Figure 81: Europe Market Value (US$ Million) Analysis by Country, 2018 to 2033

Figure 82: Europe Market Value Share (%) and BPS Analysis by Country, 2023 to 2033

Figure 83: Europe Market Y-o-Y Growth (%) Projections by Country, 2023 to 2033

Figure 84: Europe Market Value (US$ Million) Analysis by Component, 2018 to 2033

Figure 85: Europe Market Value Share (%) and BPS Analysis by Component, 2023 to 2033

Figure 86: Europe Market Y-o-Y Growth (%) Projections by Component, 2023 to 2033

Figure 87: Europe Market Value (US$ Million) Analysis by Deployment Mode, 2018 to 2033

Figure 88: Europe Market Value Share (%) and BPS Analysis by Deployment Mode, 2023 to 2033

Figure 89: Europe Market Y-o-Y Growth (%) Projections by Deployment Mode, 2023 to 2033

Figure 90: Europe Market Value (US$ Million) Analysis by Organization Size, 2018 to 2033

Figure 91: Europe Market Value Share (%) and BPS Analysis by Organization Size, 2023 to 2033

Figure 92: Europe Market Y-o-Y Growth (%) Projections by Organization Size, 2023 to 2033

Figure 93: Europe Market Value (US$ Million) Analysis by Verticals, 2018 to 2033

Figure 94: Europe Market Value Share (%) and BPS Analysis by Verticals, 2023 to 2033

Figure 95: Europe Market Y-o-Y Growth (%) Projections by Verticals, 2023 to 2033

Figure 96: Europe Market Attractiveness by Component, 2023 to 2033

Figure 97: Europe Market Attractiveness by Deployment Mode, 2023 to 2033

Figure 98: Europe Market Attractiveness by Organization Size, 2023 to 2033

Figure 99: Europe Market Attractiveness by Verticals, 2023 to 2033

Figure 100: Europe Market Attractiveness by Country, 2023 to 2033

Figure 101: South Asia Market Value (US$ Million) by Component, 2023 to 2033

Figure 102: South Asia Market Value (US$ Million) by Deployment Mode, 2023 to 2033

Figure 103: South Asia Market Value (US$ Million) by Organization Size, 2023 to 2033

Figure 104: South Asia Market Value (US$ Million) by Verticals, 2023 to 2033

Figure 105: South Asia Market Value (US$ Million) by Country, 2023 to 2033

Figure 106: South Asia Market Value (US$ Million) Analysis by Country, 2018 to 2033

Figure 107: South Asia Market Value Share (%) and BPS Analysis by Country, 2023 to 2033

Figure 108: South Asia Market Y-o-Y Growth (%) Projections by Country, 2023 to 2033

Figure 109: South Asia Market Value (US$ Million) Analysis by Component, 2018 to 2033

Figure 110: South Asia Market Value Share (%) and BPS Analysis by Component, 2023 to 2033

Figure 111: South Asia Market Y-o-Y Growth (%) Projections by Component, 2023 to 2033

Figure 112: South Asia Market Value (US$ Million) Analysis by Deployment Mode, 2018 to 2033

Figure 113: South Asia Market Value Share (%) and BPS Analysis by Deployment Mode, 2023 to 2033

Figure 114: South Asia Market Y-o-Y Growth (%) Projections by Deployment Mode, 2023 to 2033

Figure 115: South Asia Market Value (US$ Million) Analysis by Organization Size, 2018 to 2033

Figure 116: South Asia Market Value Share (%) and BPS Analysis by Organization Size, 2023 to 2033

Figure 117: South Asia Market Y-o-Y Growth (%) Projections by Organization Size, 2023 to 2033

Figure 118: South Asia Market Value (US$ Million) Analysis by Verticals, 2018 to 2033

Figure 119: South Asia Market Value Share (%) and BPS Analysis by Verticals, 2023 to 2033

Figure 120: South Asia Market Y-o-Y Growth (%) Projections by Verticals, 2023 to 2033

Figure 121: South Asia Market Attractiveness by Component, 2023 to 2033

Figure 122: South Asia Market Attractiveness by Deployment Mode, 2023 to 2033

Figure 123: South Asia Market Attractiveness by Organization Size, 2023 to 2033

Figure 124: South Asia Market Attractiveness by Verticals, 2023 to 2033

Figure 125: South Asia Market Attractiveness by Country, 2023 to 2033

Figure 126: East Asia Market Value (US$ Million) by Component, 2023 to 2033

Figure 127: East Asia Market Value (US$ Million) by Deployment Mode, 2023 to 2033

Figure 128: East Asia Market Value (US$ Million) by Organization Size, 2023 to 2033

Figure 129: East Asia Market Value (US$ Million) by Verticals, 2023 to 2033

Figure 130: East Asia Market Value (US$ Million) by Country, 2023 to 2033

Figure 131: East Asia Market Value (US$ Million) Analysis by Country, 2018 to 2033

Figure 132: East Asia Market Value Share (%) and BPS Analysis by Country, 2023 to 2033

Figure 133: East Asia Market Y-o-Y Growth (%) Projections by Country, 2023 to 2033

Figure 134: East Asia Market Value (US$ Million) Analysis by Component, 2018 to 2033

Figure 135: East Asia Market Value Share (%) and BPS Analysis by Component, 2023 to 2033

Figure 136: East Asia Market Y-o-Y Growth (%) Projections by Component, 2023 to 2033

Figure 137: East Asia Market Value (US$ Million) Analysis by Deployment Mode, 2018 to 2033

Figure 138: East Asia Market Value Share (%) and BPS Analysis by Deployment Mode, 2023 to 2033

Figure 139: East Asia Market Y-o-Y Growth (%) Projections by Deployment Mode, 2023 to 2033

Figure 140: East Asia Market Value (US$ Million) Analysis by Organization Size, 2018 to 2033

Figure 141: East Asia Market Value Share (%) and BPS Analysis by Organization Size, 2023 to 2033

Figure 142: East Asia Market Y-o-Y Growth (%) Projections by Organization Size, 2023 to 2033

Figure 143: East Asia Market Value (US$ Million) Analysis by Verticals, 2018 to 2033

Figure 144: East Asia Market Value Share (%) and BPS Analysis by Verticals, 2023 to 2033

Figure 145: East Asia Market Y-o-Y Growth (%) Projections by Verticals, 2023 to 2033

Figure 146: East Asia Market Attractiveness by Component, 2023 to 2033

Figure 147: East Asia Market Attractiveness by Deployment Mode, 2023 to 2033

Figure 148: East Asia Market Attractiveness by Organization Size, 2023 to 2033

Figure 149: East Asia Market Attractiveness by Verticals, 2023 to 2033

Figure 150: East Asia Market Attractiveness by Country, 2023 to 2033

Figure 151: Oceania Market Value (US$ Million) by Component, 2023 to 2033

Figure 152: Oceania Market Value (US$ Million) by Deployment Mode, 2023 to 2033

Figure 153: Oceania Market Value (US$ Million) by Organization Size, 2023 to 2033

Figure 154: Oceania Market Value (US$ Million) by Verticals, 2023 to 2033

Figure 155: Oceania Market Value (US$ Million) by Country, 2023 to 2033

Figure 156: Oceania Market Value (US$ Million) Analysis by Country, 2018 to 2033

Figure 157: Oceania Market Value Share (%) and BPS Analysis by Country, 2023 to 2033

Figure 158: Oceania Market Y-o-Y Growth (%) Projections by Country, 2023 to 2033

Figure 159: Oceania Market Value (US$ Million) Analysis by Component, 2018 to 2033

Figure 160: Oceania Market Value Share (%) and BPS Analysis by Component, 2023 to 2033

Figure 161: Oceania Market Y-o-Y Growth (%) Projections by Component, 2023 to 2033

Figure 162: Oceania Market Value (US$ Million) Analysis by Deployment Mode, 2018 to 2033

Figure 163: Oceania Market Value Share (%) and BPS Analysis by Deployment Mode, 2023 to 2033

Figure 164: Oceania Market Y-o-Y Growth (%) Projections by Deployment Mode, 2023 to 2033

Figure 165: Oceania Market Value (US$ Million) Analysis by Organization Size, 2018 to 2033

Figure 166: Oceania Market Value Share (%) and BPS Analysis by Organization Size, 2023 to 2033

Figure 167: Oceania Market Y-o-Y Growth (%) Projections by Organization Size, 2023 to 2033

Figure 168: Oceania Market Value (US$ Million) Analysis by Verticals, 2018 to 2033

Figure 169: Oceania Market Value Share (%) and BPS Analysis by Verticals, 2023 to 2033

Figure 170: Oceania Market Y-o-Y Growth (%) Projections by Verticals, 2023 to 2033

Figure 171: Oceania Market Attractiveness by Component, 2023 to 2033

Figure 172: Oceania Market Attractiveness by Deployment Mode, 2023 to 2033

Figure 173: Oceania Market Attractiveness by Organization Size, 2023 to 2033

Figure 174: Oceania Market Attractiveness by Verticals, 2023 to 2033

Figure 175: Oceania Market Attractiveness by Country, 2023 to 2033

Figure 176: MEA Market Value (US$ Million) by Component, 2023 to 2033

Figure 177: MEA Market Value (US$ Million) by Deployment Mode, 2023 to 2033

Figure 178: MEA Market Value (US$ Million) by Organization Size, 2023 to 2033

Figure 179: MEA Market Value (US$ Million) by Verticals, 2023 to 2033

Figure 180: MEA Market Value (US$ Million) by Country, 2023 to 2033

Figure 181: MEA Market Value (US$ Million) Analysis by Country, 2018 to 2033

Figure 182: MEA Market Value Share (%) and BPS Analysis by Country, 2023 to 2033

Figure 183: MEA Market Y-o-Y Growth (%) Projections by Country, 2023 to 2033

Figure 184: MEA Market Value (US$ Million) Analysis by Component, 2018 to 2033

Figure 185: MEA Market Value Share (%) and BPS Analysis by Component, 2023 to 2033

Figure 186: MEA Market Y-o-Y Growth (%) Projections by Component, 2023 to 2033

Figure 187: MEA Market Value (US$ Million) Analysis by Deployment Mode, 2018 to 2033

Figure 188: MEA Market Value Share (%) and BPS Analysis by Deployment Mode, 2023 to 2033

Figure 189: MEA Market Y-o-Y Growth (%) Projections by Deployment Mode, 2023 to 2033

Figure 190: MEA Market Value (US$ Million) Analysis by Organization Size, 2018 to 2033

Figure 191: MEA Market Value Share (%) and BPS Analysis by Organization Size, 2023 to 2033

Figure 192: MEA Market Y-o-Y Growth (%) Projections by Organization Size, 2023 to 2033

Figure 193: MEA Market Value (US$ Million) Analysis by Verticals, 2018 to 2033

Figure 194: MEA Market Value Share (%) and BPS Analysis by Verticals, 2023 to 2033

Figure 195: MEA Market Y-o-Y Growth (%) Projections by Verticals, 2023 to 2033

Figure 196: MEA Market Attractiveness by Component, 2023 to 2033

Figure 197: MEA Market Attractiveness by Deployment Mode, 2023 to 2033

Figure 198: MEA Market Attractiveness by Organization Size, 2023 to 2033

Figure 199: MEA Market Attractiveness by Verticals, 2023 to 2033

Figure 200: MEA Market Attractiveness by Country, 2023 to 2033

Recommendations

Technology

CRM Application Software Market

Published : September 2017

Explore Technology Insights

View Reports

Customer Communications Management Market