Spending In Digital Customer Experience and Engagement Solutions Market
A Detailed Analysis of Spending in Digital Customer Experience and Engagement Solutions Market by B2B, B2C, and B2B2C
Nurturing Business Success Through Digital Customer Experience and Customer Engagement Solutions
Spending in Digital Customer Experience and Engagement Solutions Market Outlook (2023 to 2033)
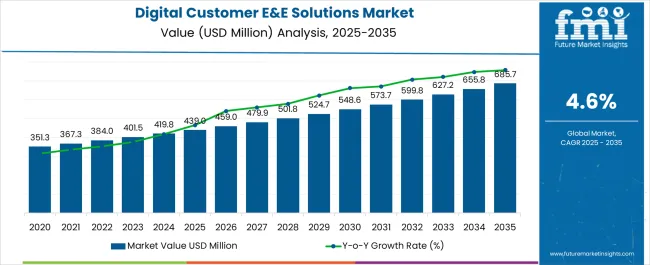
The spending in the digital customer experience and engagement solutions market was valued at around US$ 412.5 million in 2023. With a projected CAGR of 4.8% for the next ten years, the market is likely to reach a valuation of nearly US$ 661.3 million by the end of 2033. The recent surge in expectation for a good customer experience and personalization has triggered the demand for spending on digital customer experience and engagement solutions.
Report Attributes | Details |
---|---|
Global Spending in Digital Customer Experience And Engagement Solutions Market Size (2022) |
US$ 399.7 million |
Global Spending in Digital Customer Experience And Engagement Solutions Market Size (2023) |
US$ 412.5 million |
Global Spending in Digital Customer Experience And Engagement Solutions Market Projected Market Value (2033) |
US$ 661.3 million |
Global Spending in Digital Customer Experience And Engagement Solutions Market Growth Rate (2023 to 2033) |
4.8% CAGR |
North America Spending in Digital Customer Experience And Engagement Solutions Market Share (2021) |
>35% |
Key Companies Profiled |
|
Don't pay for what you don't need
Customize your report by selecting specific countries or regions and save 30%!
Sales Analysis of Spending in Digital Customer Experience and Engagement Solutions from 2018 to 2022 vs. Market Outlook for 2023 to 2033
The global market for spending on digital customer experience and engagement solutions expanded at a CAGR of 2.7% over the last five years. The market growth is projected to benefit from the surge in the B2B customer expectation for an enhanced and personalized customer experience, leading to increased avenues for the key industry players shaping the spending in digital customer experience and engagement solutions industry in the forthcoming years.
The global spending in the digital customer experience and engagement solutions market is predicted to surge at a CAGR of 4.8% and record sales worth US$ 661.3 million by the end of 2033. The United States may remain the leading market throughout the analysis period, accounting for over US$ 69.2 million absolute dollar opportunity in the coming 10-year epoch.
Increasing Use of the Customer Awareness Segment Impacted the Spending in Digital Customer Experience and Engagement Solutions Market
In the forthcoming years, it is expected that the customer awareness segment of the spending in digital customer experience and engagement solutions market may experience a CAGR of 4.9%. According to a 2022 survey, around 77% of customers tend to be better at being loyal to businesses offering marvelous services, which further expedites the customer analytics sub-segment of the customer awareness segment, which aids in improving customer experience and loyalty.
As of 2021, over 63% of companies across the globe are focusing more on customer experiences. Findings of another market survey have noted that around 71% of the customers may discontinue using the services of a company if it is found that their data is shared without permission, a development that directly impacts the growth of the customer data management platforms under the customer awareness segment by solution.
Furthermore, at 2.1 billion, with nearly 30% of the global populace digitizing their shopping experience, the requirement for a personalized omnichannel experience is surging, leading industry players such as Amazon.com Inc. in the retail and wholesale industry vertical to leverage customer analytics. All these attributes are anticipated to positively impact the spending in digital customer experience and engagement solutions market in the upcoming 10-year epoch.
Spending in Digital Customer Experience and Engagement Solutions Demand Expected to Perform with their Growing Necessity in Business to Business (B2B) Segment
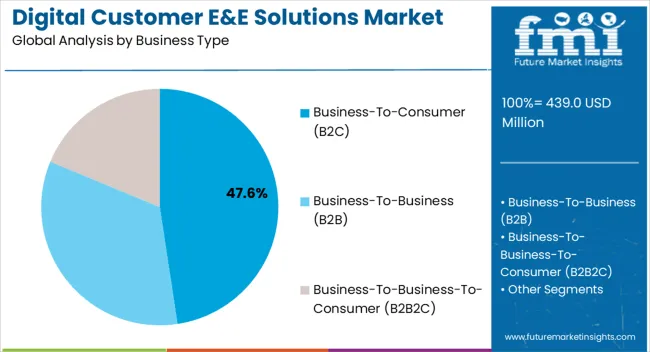
The business-to-business segment by business type of spending in the digital customer experience and engagement solutions market may be witnessing a CAGR of 4.7 % in the upcoming 10-year epoch. The business-to-business (B2B) segment by business type becomes convalescent when the B2B organizations work efficiently for customer experience enhancement. With the demand for personalization increasing among customers, B2B e-commerce and sales teams increasingly focus on customer data analytics.
A study has recently found that 80% of the B2B customer cohort post-pandemic tends to expect a buying experience similar to that of the business-to-customer (B2C) segment. Besides, a 2020 study further estimates that by 2025, around 80% of the net B2B sales transactions may be happening via digital channels. More recently, in 2022, it is predicted that by the end of 2026, over 65% of the B2B sales may be transitioning to data-driven decision-making from intuition-based decision-making.
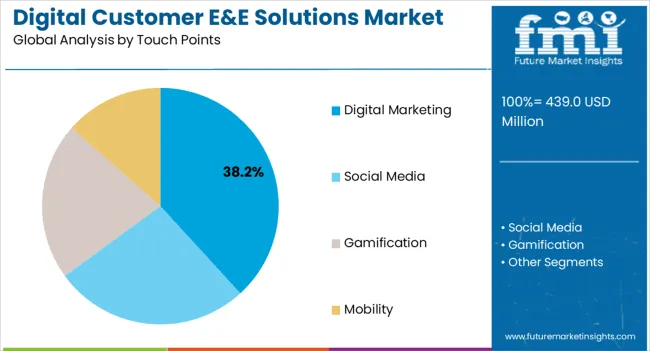
Nearly 75% of the B2B customers find themselves being extensively influenced by the social media segment by touch point, with 84% of senior executives using the platform to support purchase decisions. Moreover, automation solutions pertaining to the business-to-business (B2B) segment are estimated to rise during the forthcoming years to keep up with the increasing trends of digitization across the globe.
With key players in the B2B segment focusing on marketing automation and personalizing customer experience and requirements, this segment is anticipated to positively impact the spending in digital customer experience and engagement solutions market.
Category-wise Insights
Asia Pacific Stand as the Most Lucrative Market for Spending on Digital Customer Experience and Engagement Solutions Market
Asia Pacific may continue to be lucrative for spending in the digital customer experience and engagement solutions market in the forthcoming years. Among the various attributes favoring the market in Asia Pacific, new product launches are also included. In January 2020, the Cheetah Digital Customer Engagement Suite was launched in Japan, which provides business firms with immaculate ways of marketing to consumers. This also aids the 5.7% CAGR the country is set to witness by the end of 2033.
A recent survey noted that in India, enhancing customer experience across financial services, healthcare, retail, media, telecommunications, and travel may aid the unlocking of US$ 200 billion in brand value, along with improving the total valuation of businesses by around 125 to 400%. Also, taking into account the data related to the CX Index in India, around 80% of customers tend to recommend a brand after a satisfying experience, and only 35% may recommend it after a poor experience.
The Spending in Digital Customer Experience and Engagement Solutions Market in North America is Speeding Up
It is estimated that the North-American region may maintain its market share of more than 35% intact in the spending in the digital customer experience and engagement solutions market. One of the key attributes associated with the growth of the spending in the digital customer experience and engagement solutions market in the region is the extensive surge in spending witnessed by digital marketing in both Canada and the United States.
As of 2020, the most beneficial advertising medium in Canada was digital media, standing at US$ 5.9 billion in ad revenue, accounting for over half of the ad revenue generated in the nation. According to a March 2022 report, the churn rates associated with content streaming platforms in the United States are among the world's leading. This attribute aids in augmenting the requirement for customer engagement solutions, which helps reduce churn rates, thus leading to a surge in customer engagement. All these factors are anticipated to augment the requirement for spending in the digital customer experience and engagement solutions market in the forthcoming years.
Get the data you need at a Fraction of the cost
Personalize your report by choosing insights you need
and save 40%!
Country-wise Insights
The United States is Expected to Play a Significant Role in the Global Spending in Digital Customer Experience and Engagement Solutions Demand
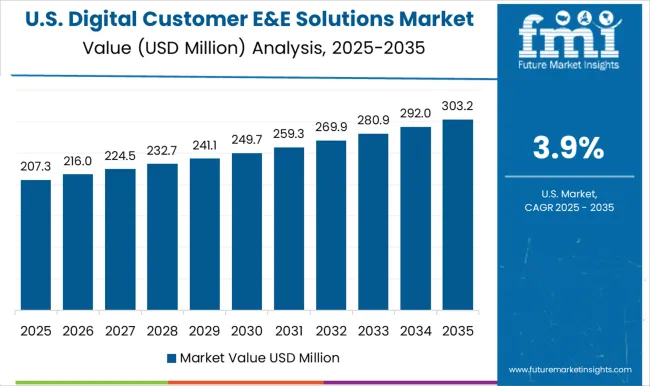
The United States commands a global market share of over 25% in the spending in the digital customer experience and engagement solutions market and may continue to keep it intact. The country is expected to witness a CAGR of 5.2% coupled with an absolute dollar opportunity of US$ 69.2 million to reach a total market valuation of US$ 174.7 million by the end of 2033. The most popular form of advertising and marketing used across the industry verticals in the United States is the Social Media segment.
According to a recent report, as of 2021, around 91.9% of the United States business marketers with more than 100 employees tended to use social media for marketing and advertising. Additionally, over US$ 153 billion was the cost associated with internet advertising and is estimated to surge ahead in the forthcoming years.
The market growth associated with social media is also expedited by the large cohort of social media users in the country, which is anticipated to increase further during the upcoming 10-year epoch. Presently, with over 231.5 million people, 72.3% of the total United States population uses social media. Additionally, the United States is among the leading and most mature industries in the world pertaining to adopting B2B e-commerce. B2B e-commerce was valued at US$ 6.7 trillion in the United States as of 2019. The attributes contributing to this growth that may further expedite it in the forthcoming years are the consistent shift of B2B customers to online corporate purchases from the more conservative buying methods. All these attributes may expedite the growth of the Spending in the Digital Customer Experience and Engagement Solutions Market in the United States during the upcoming 10-year forecast period.
Competitive Analysis
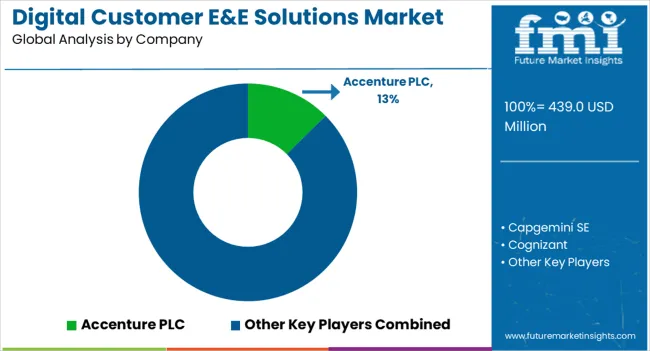
Accenture PLC, Capgemini SE, Cognizant, IBM Corporation, Liferay Inc., MEGA International, Orange Business Services, Tietoevry Corporation, SAS Institute Inc., KOFAX Inc., NCR Corporation, Tata Consultancy Services (TCS) Limited, Zendesk Inc., and SAS Institute Inc. are among the key players worldwide driving the competitive landscape of the market. Several companies are adopting strategies such as mergers, acquisitions, and partnerships to expand their product portfolio and simultaneously capitalize on the growing market demand.
Recent Developments
- January 2023: Cheetah Digital Announces Customer Engagement Suite in Japan. Cheetah Digital, a prominent supplier of consumer engagement solutions, released its consumer Engagement Suite in Japan. The suite provides several options enabling companies to communicate with their consumers across channels, including email, SMS, push notifications, and social media.
- February 2023: Salesforce Releases New Customer 360 Platform. Salesforce, a renowned supplier of CRM software, launched a new edition of its Customer 360 platform. The new platform contains various new features and capabilities, including a single picture of the consumer, predictive analytics, and AI-powered insights.
Key Segments Covered in Market Survey
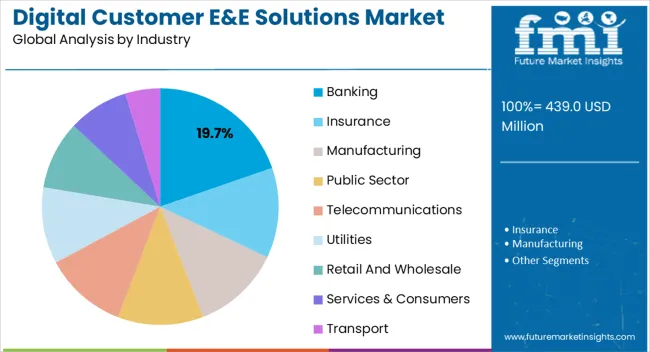
The spending in digital customer experience and engagement solutions market is segmented based on business type, touchpoints, industry, enterprise size, solution, and region.
By Business Type:
- Business-to-Business (B2B)
- Business-to-Consumer (B2C)
- Business-to-Business-to-Consumer (B2B2C)
By Touch Points:
- Social media
- Gamification
- Digital Marketing
- Mobility
By Industry:
- Banking
- Insurance
- Manufacturing
- Public Sector
- Telecommunications
- Utilities
- Retail and wholesale
- Services & Consumers
- Transport
By Enterprise Size:
- Small Enterprises
- Medium Enterprises
- Large Enterprises
By Solution:
- Customer Awareness
- Customer data management platforms
- Customer Analytics
- Advertising & Marketing
- Customer Engagement
- Personalization/Content Targeting
- Cross Selling/ Upselling
- UI Design
- Purchase and relation
- Loyalty Programs
- Transactions/ Sales
- Virtual Trials/ Displays
- Support Services
- Chatbot
- Self-serve tools
- Digital surveys
- Case Management
By Region:
- North America
- The US
- Canada
- Asia Pacific
- China
- Japan
- South Korea
- India
- Europe
- Germany
- UK
- France
- Russia
- Italy
- The Middle East and Africa (MEA)
- South Africa
- Saudi Arabia
- UAE
- Nigeria
- Egypt
- Latin America
- Mexico
- Brazil
- Argentina
- Colombia
Frequently Asked Questions
What is the Growth Rate of the Market until 2033?
By 2033, the market is likely to expand at a 4.8% CAGR.
What is the 2023 Market Value?
The 2023 market value is US$ 412.5 million.
What was the Historical CAGR of the Market?
From 2018 to 2022, the market expanded at a 2.7% CAGR.
What is the Growth Rate of the United States?
The United States is expected to develop at a 5.2% CAGR by 2033.
Which Business Type is most Preferred?
Business-to-Business (B2B) is expected to be highly preferred.
Table of Content
1. Executive Summary 1.1. Global Market Outlook 1.2. Demand-side Trends 1.3. Supply-side Trends 1.4. Technology Roadmap Analysis 1.5. Analysis and Recommendations 2. Market Overview 2.1. Market Coverage / Taxonomy 2.2. Market Definition / Scope / Limitations 3. Market Background 3.1. Market Dynamics 3.1.1. Drivers 3.1.2. Restraints 3.1.3. Opportunity 3.1.4. Trends 3.2. Scenario Forecast 3.2.1. Demand in Optimistic Scenario 3.2.2. Demand in Likely Scenario 3.2.3. Demand in Conservative Scenario 3.3. Opportunity Map Analysis 3.4. Investment Feasibility Matrix 3.5. PESTLE and Porter’s Analysis 3.6. Regulatory Landscape 3.6.1. By Key Regions 3.6.2. By Key Countries 3.7. Regional Parent Market Outlook 4. Global Market Analysis 2018 to 2022 and Forecast, 2023 to 2033 4.1. Historical Market Size Value (US$ Million) Analysis, 2018 to 2022 4.2. Current and Future Market Size Value (US$ Million) Projections, 2023 to 2033 4.2.1. Y-o-Y Growth Trend Analysis 4.2.2. Absolute $ Opportunity Analysis 5. Global Market Analysis 2018 to 2022 and Forecast 2023 to 2033, By Business Type 5.1. Introduction / Key Findings 5.2. Historical Market Size Value (US$ Million) Analysis By Business Type, 2018 to 2022 5.3. Current and Future Market Size Value (US$ Million) Analysis and Forecast By Business Type, 2023 to 2033 5.3.1. Business to Business (B2B) 5.3.2. Business to Consumer (B2C) 5.3.3. Business to Business to Consumer (B2B2C) 5.4. Y-o-Y Growth Trend Analysis By Business Type, 2018 to 2022 5.5. Absolute $ Opportunity Analysis By Business Type, 2023 to 2033 6. Global Market Analysis 2018 to 2022 and Forecast 2023 to 2033, By Touch Points 6.1. Introduction / Key Findings 6.2. Historical Market Size Value (US$ Million) Analysis By Touch Points, 2018 to 2022 6.3. Current and Future Market Size Value (US$ Million) Analysis and Forecast By Touch Points, 2023 to 2033 6.3.1. Social Media 6.3.2. Gamification 6.3.3. Digital Marketing 6.3.4. Mobility 6.4. Y-o-Y Growth Trend Analysis By Touch Points, 2018 to 2022 6.5. Absolute $ Opportunity Analysis By Touch Points, 2023 to 2033 7. Global Market Analysis 2018 to 2022 and Forecast 2023 to 2033, By Industry 7.1. Introduction / Key Findings 7.2. Historical Market Size Value (US$ Million) Analysis By Industry , 2018 to 2022 7.3. Current and Future Market Size Value (US$ Million) Analysis and Forecast By Industry , 2023 to 2033 7.3.1. Banking 7.3.2. Insurance 7.3.3. Manufacturing 7.3.4. Public Sector 7.3.5. Telecommunications 7.3.6. Utilities 7.3.7. Retail and wholesale 7.3.8. Services & Consumers 7.3.9. Transport 7.4. Y-o-Y Growth Trend Analysis By Industry , 2018 to 2022 7.5. Absolute $ Opportunity Analysis By Industry , 2023 to 2033 8. Global Market Analysis 2018 to 2022 and Forecast 2023 to 2033, By Enterprise Size 8.1. Introduction / Key Findings 8.2. Historical Market Size Value (US$ Million) Analysis By Enterprise Size, 2018 to 2022 8.3. Current and Future Market Size Value (US$ Million) Analysis and Forecast By Enterprise Size, 2023 to 2033 8.3.1. Small Enterprises 8.3.2. Medium Enterprises 8.3.3. Large Enterprises 8.4. Y-o-Y Growth Trend Analysis By Enterprise Size, 2018 to 2022 8.5. Absolute $ Opportunity Analysis By Enterprise Size, 2023 to 2033 9. Global Market Analysis 2018 to 2022 and Forecast 2023 to 2033, By Solution 9.1. Introduction / Key Findings 9.2. Historical Market Size Value (US$ Million) Analysis By Solution, 2018 to 2022 9.3. Current and Future Market Size Value (US$ Million) Analysis and Forecast By Solution, 2023 to 2033 9.3.1. Customer Awareness 9.3.1.1. Customer data management platforms 9.3.1.2. Customer Analytics 9.3.1.3. Advertising & Marketing 9.3.2. Customer Engagement 9.3.2.1. Personalization/Content Targeting 9.3.2.2. Cross Selling/ Upselling 9.3.2.3. UI Design 9.3.3. Purchase and relation 9.3.3.1. Loyalty Programs 9.3.3.2. Transactions/ Sales 9.3.3.3. Virtual Trials/ Displays 9.3.4. Support Services 9.3.4.1. Chatbot 9.3.4.2. Self-serve tools 9.3.4.3. Digital surveys 9.3.4.4. Case Management 9.4. Y-o-Y Growth Trend Analysis By Solution, 2018 to 2022 9.5. Absolute $ Opportunity Analysis By Solution, 2023 to 2033 10. Global Market Analysis 2018 to 2022 and Forecast 2023 to 2033, By Region 10.1. Introduction 10.2. Historical Market Size Value (US$ Million) Analysis By Region, 2018 to 2022 10.3. Current Market Size Value (US$ Million) Analysis and Forecast By Region, 2023 to 2033 10.3.1. North America 10.3.2. Latin America 10.3.3. Western Europe 10.3.4. Eastern Europe 10.3.5. South Asia and Pacific 10.3.6. East Asia 10.3.7. Middle East and Africa 10.4. Market Attractiveness Analysis By Region 11. North America Market Analysis 2018 to 2022 and Forecast 2023 to 2033, By Country 11.1. Historical Market Size Value (US$ Million) Trend Analysis By Market Taxonomy, 2018 to 2022 11.2. Market Size Value (US$ Million) Forecast By Market Taxonomy, 2023 to 2033 11.2.1. By Country 11.2.1.1. USA. 11.2.1.2. Canada 11.2.2. By Business Type 11.2.3. By Touch Points 11.2.4. By Industry 11.2.5. By Enterprise Size 11.2.6. By Solution 11.3. Market Attractiveness Analysis 11.3.1. By Country 11.3.2. By Business Type 11.3.3. By Touch Points 11.3.4. By Industry 11.3.5. By Enterprise Size 11.3.6. By Solution 11.4. Key Takeaways 12. Latin America Market Analysis 2018 to 2022 and Forecast 2023 to 2033, By Country 12.1. Historical Market Size Value (US$ Million) Trend Analysis By Market Taxonomy, 2018 to 2022 12.2. Market Size Value (US$ Million) Forecast By Market Taxonomy, 2023 to 2033 12.2.1. By Country 12.2.1.1. Brazil 12.2.1.2. Mexico 12.2.1.3. Rest of Latin America 12.2.2. By Business Type 12.2.3. By Touch Points 12.2.4. By Industry 12.2.5. By Enterprise Size 12.2.6. By Solution 12.3. Market Attractiveness Analysis 12.3.1. By Country 12.3.2. By Business Type 12.3.3. By Touch Points 12.3.4. By Industry 12.3.5. By Enterprise Size 12.3.6. By Solution 12.4. Key Takeaways 13. Western Europe Market Analysis 2018 to 2022 and Forecast 2023 to 2033, By Country 13.1. Historical Market Size Value (US$ Million) Trend Analysis By Market Taxonomy, 2018 to 2022 13.2. Market Size Value (US$ Million) Forecast By Market Taxonomy, 2023 to 2033 13.2.1. By Country 13.2.1.1. Germany 13.2.1.2. United Kingdom. 13.2.1.3. France 13.2.1.4. Spain 13.2.1.5. Italy 13.2.1.6. Rest of Western Europe 13.2.2. By Business Type 13.2.3. By Touch Points 13.2.4. By Industry 13.2.5. By Enterprise Size 13.2.6. By Solution 13.3. Market Attractiveness Analysis 13.3.1. By Country 13.3.2. By Business Type 13.3.3. By Touch Points 13.3.4. By Industry 13.3.5. By Enterprise Size 13.3.6. By Solution 13.4. Key Takeaways 14. Eastern Europe Market Analysis 2018 to 2022 and Forecast 2023 to 2033, By Country 14.1. Historical Market Size Value (US$ Million) Trend Analysis By Market Taxonomy, 2018 to 2022 14.2. Market Size Value (US$ Million) Forecast By Market Taxonomy, 2023 to 2033 14.2.1. By Country 14.2.1.1. Poland 14.2.1.2. Russia 14.2.1.3. Czech Republic 14.2.1.4. Romania 14.2.1.5. Rest of Eastern Europe 14.2.2. By Business Type 14.2.3. By Touch Points 14.2.4. By Industry 14.2.5. By Enterprise Size 14.2.6. By Solution 14.3. Market Attractiveness Analysis 14.3.1. By Country 14.3.2. By Business Type 14.3.3. By Touch Points 14.3.4. By Industry 14.3.5. By Enterprise Size 14.3.6. By Solution 14.4. Key Takeaways 15. South Asia and Pacific Market Analysis 2018 to 2022 and Forecast 2023 to 2033, By Country 15.1. Historical Market Size Value (US$ Million) Trend Analysis By Market Taxonomy, 2018 to 2022 15.2. Market Size Value (US$ Million) Forecast By Market Taxonomy, 2023 to 2033 15.2.1. By Country 15.2.1.1. India 15.2.1.2. Bangladesh 15.2.1.3. Australia 15.2.1.4. New Zealand 15.2.1.5. Rest of South Asia and Pacific 15.2.2. By Business Type 15.2.3. By Touch Points 15.2.4. By Industry 15.2.5. By Enterprise Size 15.2.6. By Solution 15.3. Market Attractiveness Analysis 15.3.1. By Country 15.3.2. By Business Type 15.3.3. By Touch Points 15.3.4. By Industry 15.3.5. By Enterprise Size 15.3.6. By Solution 15.4. Key Takeaways 16. East Asia Market Analysis 2018 to 2022 and Forecast 2023 to 2033, By Country 16.1. Historical Market Size Value (US$ Million) Trend Analysis By Market Taxonomy, 2018 to 2022 16.2. Market Size Value (US$ Million) Forecast By Market Taxonomy, 2023 to 2033 16.2.1. By Country 16.2.1.1. China 16.2.1.2. Japan 16.2.1.3. South Korea 16.2.2. By Business Type 16.2.3. By Touch Points 16.2.4. By Industry 16.2.5. By Enterprise Size 16.2.6. By Solution 16.3. Market Attractiveness Analysis 16.3.1. By Country 16.3.2. By Business Type 16.3.3. By Touch Points 16.3.4. By Industry 16.3.5. By Enterprise Size 16.3.6. By Solution 16.4. Key Takeaways 17. Middle East and Africa Market Analysis 2018 to 2022 and Forecast 2023 to 2033, By Country 17.1. Historical Market Size Value (US$ Million) Trend Analysis By Market Taxonomy, 2018 to 2022 17.2. Market Size Value (US$ Million) Forecast By Market Taxonomy, 2023 to 2033 17.2.1. By Country 17.2.1.1. GCC Countries 17.2.1.2. South Africa 17.2.1.3. Israel 17.2.1.4. Rest of MEA 17.2.2. By Business Type 17.2.3. By Touch Points 17.2.4. By Industry 17.2.5. By Enterprise Size 17.2.6. By Solution 17.3. Market Attractiveness Analysis 17.3.1. By Country 17.3.2. By Business Type 17.3.3. By Touch Points 17.3.4. By Industry 17.3.5. By Enterprise Size 17.3.6. By Solution 17.4. Key Takeaways 18. Key Countries Market Analysis 18.1. USA. 18.1.1. Pricing Analysis 18.1.2. Market Share Analysis, 2022 18.1.2.1. By Business Type 18.1.2.2. By Touch Points 18.1.2.3. By Industry 18.1.2.4. By Enterprise Size 18.1.2.5. By Solution 18.2. Canada 18.2.1. Pricing Analysis 18.2.2. Market Share Analysis, 2022 18.2.2.1. By Business Type 18.2.2.2. By Touch Points 18.2.2.3. By Industry 18.2.2.4. By Enterprise Size 18.2.2.5. By Solution 18.3. Brazil 18.3.1. Pricing Analysis 18.3.2. Market Share Analysis, 2022 18.3.2.1. By Business Type 18.3.2.2. By Touch Points 18.3.2.3. By Industry 18.3.2.4. By Enterprise Size 18.3.2.5. By Solution 18.4. Mexico 18.4.1. Pricing Analysis 18.4.2. Market Share Analysis, 2022 18.4.2.1. By Business Type 18.4.2.2. By Touch Points 18.4.2.3. By Industry 18.4.2.4. By Enterprise Size 18.4.2.5. By Solution 18.5. Germany 18.5.1. Pricing Analysis 18.5.2. Market Share Analysis, 2022 18.5.2.1. By Business Type 18.5.2.2. By Touch Points 18.5.2.3. By Industry 18.5.2.4. By Enterprise Size 18.5.2.5. By Solution 18.6. United Kingdom. 18.6.1. Pricing Analysis 18.6.2. Market Share Analysis, 2022 18.6.2.1. By Business Type 18.6.2.2. By Touch Points 18.6.2.3. By Industry 18.6.2.4. By Enterprise Size 18.6.2.5. By Solution 18.7. France 18.7.1. Pricing Analysis 18.7.2. Market Share Analysis, 2022 18.7.2.1. By Business Type 18.7.2.2. By Touch Points 18.7.2.3. By Industry 18.7.2.4. By Enterprise Size 18.7.2.5. By Solution 18.8. Spain 18.8.1. Pricing Analysis 18.8.2. Market Share Analysis, 2022 18.8.2.1. By Business Type 18.8.2.2. By Touch Points 18.8.2.3. By Industry 18.8.2.4. By Enterprise Size 18.8.2.5. By Solution 18.9. Italy 18.9.1. Pricing Analysis 18.9.2. Market Share Analysis, 2022 18.9.2.1. By Business Type 18.9.2.2. By Touch Points 18.9.2.3. By Industry 18.9.2.4. By Enterprise Size 18.9.2.5. By Solution 18.10. Poland 18.10.1. Pricing Analysis 18.10.2. Market Share Analysis, 2022 18.10.2.1. By Business Type 18.10.2.2. By Touch Points 18.10.2.3. By Industry 18.10.2.4. By Enterprise Size 18.10.2.5. By Solution 18.11. Russia 18.11.1. Pricing Analysis 18.11.2. Market Share Analysis, 2022 18.11.2.1. By Business Type 18.11.2.2. By Touch Points 18.11.2.3. By Industry 18.11.2.4. By Enterprise Size 18.11.2.5. By Solution 18.12. Czech Republic 18.12.1. Pricing Analysis 18.12.2. Market Share Analysis, 2022 18.12.2.1. By Business Type 18.12.2.2. By Touch Points 18.12.2.3. By Industry 18.12.2.4. By Enterprise Size 18.12.2.5. By Solution 18.13. Romania 18.13.1. Pricing Analysis 18.13.2. Market Share Analysis, 2022 18.13.2.1. By Business Type 18.13.2.2. By Touch Points 18.13.2.3. By Industry 18.13.2.4. By Enterprise Size 18.13.2.5. By Solution 18.14. India 18.14.1. Pricing Analysis 18.14.2. Market Share Analysis, 2022 18.14.2.1. By Business Type 18.14.2.2. By Touch Points 18.14.2.3. By Industry 18.14.2.4. By Enterprise Size 18.14.2.5. By Solution 18.15. Bangladesh 18.15.1. Pricing Analysis 18.15.2. Market Share Analysis, 2022 18.15.2.1. By Business Type 18.15.2.2. By Touch Points 18.15.2.3. By Industry 18.15.2.4. By Enterprise Size 18.15.2.5. By Solution 18.16. Australia 18.16.1. Pricing Analysis 18.16.2. Market Share Analysis, 2022 18.16.2.1. By Business Type 18.16.2.2. By Touch Points 18.16.2.3. By Industry 18.16.2.4. By Enterprise Size 18.16.2.5. By Solution 18.17. New Zealand 18.17.1. Pricing Analysis 18.17.2. Market Share Analysis, 2022 18.17.2.1. By Business Type 18.17.2.2. By Touch Points 18.17.2.3. By Industry 18.17.2.4. By Enterprise Size 18.17.2.5. By Solution 18.18. China 18.18.1. Pricing Analysis 18.18.2. Market Share Analysis, 2022 18.18.2.1. By Business Type 18.18.2.2. By Touch Points 18.18.2.3. By Industry 18.18.2.4. By Enterprise Size 18.18.2.5. By Solution 18.19. Japan 18.19.1. Pricing Analysis 18.19.2. Market Share Analysis, 2022 18.19.2.1. By Business Type 18.19.2.2. By Touch Points 18.19.2.3. By Industry 18.19.2.4. By Enterprise Size 18.19.2.5. By Solution 18.20. South Korea 18.20.1. Pricing Analysis 18.20.2. Market Share Analysis, 2022 18.20.2.1. By Business Type 18.20.2.2. By Touch Points 18.20.2.3. By Industry 18.20.2.4. By Enterprise Size 18.20.2.5. By Solution 18.21. GCC Countries 18.21.1. Pricing Analysis 18.21.2. Market Share Analysis, 2022 18.21.2.1. By Business Type 18.21.2.2. By Touch Points 18.21.2.3. By Industry 18.21.2.4. By Enterprise Size 18.21.2.5. By Solution 18.22. South Africa 18.22.1. Pricing Analysis 18.22.2. Market Share Analysis, 2022 18.22.2.1. By Business Type 18.22.2.2. By Touch Points 18.22.2.3. By Industry 18.22.2.4. By Enterprise Size 18.22.2.5. By Solution 18.23. Israel 18.23.1. Pricing Analysis 18.23.2. Market Share Analysis, 2022 18.23.2.1. By Business Type 18.23.2.2. By Touch Points 18.23.2.3. By Industry 18.23.2.4. By Enterprise Size 18.23.2.5. By Solution 19. Market Structure Analysis 19.1. Competition Dashboard 19.2. Competition Benchmarking 19.3. Market Share Analysis of Top Players 19.3.1. By Regional 19.3.2. By Business Type 19.3.3. By Touch Points 19.3.4. By Industry 19.3.5. By Enterprise Size 19.3.6. By Solution 20. Competition Analysis 20.1. Competition Deep Dive 20.1.1. Accenture PLC 20.1.1.1. Overview 20.1.1.2. Product Portfolio 20.1.1.3. Profitability by Market Segments 20.1.1.4. Sales Footprint 20.1.1.5. Strategy Overview 20.1.1.5.1. Marketing Strategy 20.1.2. Capgemini SE 20.1.2.1. Overview 20.1.2.2. Product Portfolio 20.1.2.3. Profitability by Market Segments 20.1.2.4. Sales Footprint 20.1.2.5. Strategy Overview 20.1.2.5.1. Marketing Strategy 20.1.3. Cognizant 20.1.3.1. Overview 20.1.3.2. Product Portfolio 20.1.3.3. Profitability by Market Segments 20.1.3.4. Sales Footprint 20.1.3.5. Strategy Overview 20.1.3.5.1. Marketing Strategy 20.1.4. IBM Corporation 20.1.4.1. Overview 20.1.4.2. Product Portfolio 20.1.4.3. Profitability by Market Segments 20.1.4.4. Sales Footprint 20.1.4.5. Strategy Overview 20.1.4.5.1. Marketing Strategy 20.1.5. Liferay Inc. 20.1.5.1. Overview 20.1.5.2. Product Portfolio 20.1.5.3. Profitability by Market Segments 20.1.5.4. Sales Footprint 20.1.5.5. Strategy Overview 20.1.5.5.1. Marketing Strategy 20.1.6. MEGA International 20.1.6.1. Overview 20.1.6.2. Product Portfolio 20.1.6.3. Profitability by Market Segments 20.1.6.4. Sales Footprint 20.1.6.5. Strategy Overview 20.1.6.5.1. Marketing Strategy 20.1.7. Orange Business Services 20.1.7.1. Overview 20.1.7.2. Product Portfolio 20.1.7.3. Profitability by Market Segments 20.1.7.4. Sales Footprint 20.1.7.5. Strategy Overview 20.1.7.5.1. Marketing Strategy 20.1.8. Tietoevry Corporation 20.1.8.1. Overview 20.1.8.2. Product Portfolio 20.1.8.3. Profitability by Market Segments 20.1.8.4. Sales Footprint 20.1.8.5. Strategy Overview 20.1.8.5.1. Marketing Strategy 20.1.9. SAS Institute Inc. 20.1.9.1. Overview 20.1.9.2. Product Portfolio 20.1.9.3. Profitability by Market Segments 20.1.9.4. Sales Footprint 20.1.9.5. Strategy Overview 20.1.9.5.1. Marketing Strategy 20.1.10. KOFAX Inc. 20.1.10.1. Overview 20.1.10.2. Product Portfolio 20.1.10.3. Profitability by Market Segments 20.1.10.4. Sales Footprint 20.1.10.5. Strategy Overview 20.1.10.5.1. Marketing Strategy 20.1.11. NCR Corporation 20.1.11.1. Overview 20.1.11.2. Product Portfolio 20.1.11.3. Profitability by Market Segments 20.1.11.4. Sales Footprint 20.1.11.5. Strategy Overview 20.1.11.5.1. Marketing Strategy 20.1.12. Tata Consultancy Services Limited 20.1.12.1. Overview 20.1.12.2. Product Portfolio 20.1.12.3. Profitability by Market Segments 20.1.12.4. Sales Footprint 20.1.12.5. Strategy Overview 20.1.12.5.1. Marketing Strategy 20.1.13. Zendesk Inc. 20.1.13.1. Overview 20.1.13.2. Product Portfolio 20.1.13.3. Profitability by Market Segments 20.1.13.4. Sales Footprint 20.1.13.5. Strategy Overview 20.1.13.5.1. Marketing Strategy 20.1.14. SAS Institute Inc. 20.1.14.1. Overview 20.1.14.2. Product Portfolio 20.1.14.3. Profitability by Market Segments 20.1.14.4. Sales Footprint 20.1.14.5. Strategy Overview 20.1.14.5.1. Marketing Strategy 21. Assumptions & Acronyms Used 22. Research Methodology
Don't pay for what you don't need
Customize your report by selecting specific countries or regions and save 30%!
List of Tables
Table 1: Global Market Value (US$ Million) Forecast by Region, 2018 to 2033 Table 2: Global Market Value (US$ Million) Forecast by Business Type, 2018 to 2033 Table 3: Global Market Value (US$ Million) Forecast by Touch Points, 2018 to 2033 Table 4: Global Market Value (US$ Million) Forecast by Industry , 2018 to 2033 Table 5: Global Market Value (US$ Million) Forecast by Enterprise Size, 2018 to 2033 Table 6: Global Market Value (US$ Million) Forecast by Solution, 2018 to 2033 Table 7: North America Market Value (US$ Million) Forecast by Country, 2018 to 2033 Table 8: North America Market Value (US$ Million) Forecast by Business Type, 2018 to 2033 Table 9: North America Market Value (US$ Million) Forecast by Touch Points, 2018 to 2033 Table 10: North America Market Value (US$ Million) Forecast by Industry , 2018 to 2033 Table 11: North America Market Value (US$ Million) Forecast by Enterprise Size, 2018 to 2033 Table 12: North America Market Value (US$ Million) Forecast by Solution, 2018 to 2033 Table 13: Latin America Market Value (US$ Million) Forecast by Country, 2018 to 2033 Table 14: Latin America Market Value (US$ Million) Forecast by Business Type, 2018 to 2033 Table 15: Latin America Market Value (US$ Million) Forecast by Touch Points, 2018 to 2033 Table 16: Latin America Market Value (US$ Million) Forecast by Industry , 2018 to 2033 Table 17: Latin America Market Value (US$ Million) Forecast by Enterprise Size, 2018 to 2033 Table 18: Latin America Market Value (US$ Million) Forecast by Solution, 2018 to 2033 Table 19: Western Europe Market Value (US$ Million) Forecast by Country, 2018 to 2033 Table 20: Western Europe Market Value (US$ Million) Forecast by Business Type, 2018 to 2033 Table 21: Western Europe Market Value (US$ Million) Forecast by Touch Points, 2018 to 2033 Table 22: Western Europe Market Value (US$ Million) Forecast by Industry , 2018 to 2033 Table 23: Western Europe Market Value (US$ Million) Forecast by Enterprise Size, 2018 to 2033 Table 24: Western Europe Market Value (US$ Million) Forecast by Solution, 2018 to 2033 Table 25: Eastern Europe Market Value (US$ Million) Forecast by Country, 2018 to 2033 Table 26: Eastern Europe Market Value (US$ Million) Forecast by Business Type, 2018 to 2033 Table 27: Eastern Europe Market Value (US$ Million) Forecast by Touch Points, 2018 to 2033 Table 28: Eastern Europe Market Value (US$ Million) Forecast by Industry , 2018 to 2033 Table 29: Eastern Europe Market Value (US$ Million) Forecast by Enterprise Size, 2018 to 2033 Table 30: Eastern Europe Market Value (US$ Million) Forecast by Solution, 2018 to 2033 Table 31: South Asia and Pacific Market Value (US$ Million) Forecast by Country, 2018 to 2033 Table 32: South Asia and Pacific Market Value (US$ Million) Forecast by Business Type, 2018 to 2033 Table 33: South Asia and Pacific Market Value (US$ Million) Forecast by Touch Points, 2018 to 2033 Table 34: South Asia and Pacific Market Value (US$ Million) Forecast by Industry , 2018 to 2033 Table 35: South Asia and Pacific Market Value (US$ Million) Forecast by Enterprise Size, 2018 to 2033 Table 36: South Asia and Pacific Market Value (US$ Million) Forecast by Solution, 2018 to 2033 Table 37: East Asia Market Value (US$ Million) Forecast by Country, 2018 to 2033 Table 38: East Asia Market Value (US$ Million) Forecast by Business Type, 2018 to 2033 Table 39: East Asia Market Value (US$ Million) Forecast by Touch Points, 2018 to 2033 Table 40: East Asia Market Value (US$ Million) Forecast by Industry , 2018 to 2033 Table 41: East Asia Market Value (US$ Million) Forecast by Enterprise Size, 2018 to 2033 Table 42: East Asia Market Value (US$ Million) Forecast by Solution, 2018 to 2033 Table 43: Middle East and Africa Market Value (US$ Million) Forecast by Country, 2018 to 2033 Table 44: Middle East and Africa Market Value (US$ Million) Forecast by Business Type, 2018 to 2033 Table 45: Middle East and Africa Market Value (US$ Million) Forecast by Touch Points, 2018 to 2033 Table 46: Middle East and Africa Market Value (US$ Million) Forecast by Industry , 2018 to 2033 Table 47: Middle East and Africa Market Value (US$ Million) Forecast by Enterprise Size, 2018 to 2033 Table 48: Middle East and Africa Market Value (US$ Million) Forecast by Solution, 2018 to 2033
List of Charts
Figure 1: Global Market Value (US$ Million) by Business Type, 2023 to 2033 Figure 2: Global Market Value (US$ Million) by Touch Points, 2023 to 2033 Figure 3: Global Market Value (US$ Million) by Industry , 2023 to 2033 Figure 4: Global Market Value (US$ Million) by Enterprise Size, 2023 to 2033 Figure 5: Global Market Value (US$ Million) by Solution, 2023 to 2033 Figure 6: Global Market Value (US$ Million) by Region, 2023 to 2033 Figure 7: Global Market Value (US$ Million) Analysis by Region, 2018 to 2033 Figure 8: Global Market Value Share (%) and BPS Analysis by Region, 2023 to 2033 Figure 9: Global Market Y-o-Y Growth (%) Projections by Region, 2023 to 2033 Figure 10: Global Market Value (US$ Million) Analysis by Business Type, 2018 to 2033 Figure 11: Global Market Value Share (%) and BPS Analysis by Business Type, 2023 to 2033 Figure 12: Global Market Y-o-Y Growth (%) Projections by Business Type, 2023 to 2033 Figure 13: Global Market Value (US$ Million) Analysis by Touch Points, 2018 to 2033 Figure 14: Global Market Value Share (%) and BPS Analysis by Touch Points, 2023 to 2033 Figure 15: Global Market Y-o-Y Growth (%) Projections by Touch Points, 2023 to 2033 Figure 16: Global Market Value (US$ Million) Analysis by Industry , 2018 to 2033 Figure 17: Global Market Value Share (%) and BPS Analysis by Industry , 2023 to 2033 Figure 18: Global Market Y-o-Y Growth (%) Projections by Industry , 2023 to 2033 Figure 19: Global Market Value (US$ Million) Analysis by Enterprise Size, 2018 to 2033 Figure 20: Global Market Value Share (%) and BPS Analysis by Enterprise Size, 2023 to 2033 Figure 21: Global Market Y-o-Y Growth (%) Projections by Enterprise Size, 2023 to 2033 Figure 22: Global Market Value (US$ Million) Analysis by Solution, 2018 to 2033 Figure 23: Global Market Value Share (%) and BPS Analysis by Solution, 2023 to 2033 Figure 24: Global Market Y-o-Y Growth (%) Projections by Solution, 2023 to 2033 Figure 25: Global Market Attractiveness by Business Type, 2023 to 2033 Figure 26: Global Market Attractiveness by Touch Points, 2023 to 2033 Figure 27: Global Market Attractiveness by Industry , 2023 to 2033 Figure 28: Global Market Attractiveness by Enterprise Size, 2023 to 2033 Figure 29: Global Market Attractiveness by Solution, 2023 to 2033 Figure 30: Global Market Attractiveness by Region, 2023 to 2033 Figure 31: North America Market Value (US$ Million) by Business Type, 2023 to 2033 Figure 32: North America Market Value (US$ Million) by Touch Points, 2023 to 2033 Figure 33: North America Market Value (US$ Million) by Industry , 2023 to 2033 Figure 34: North America Market Value (US$ Million) by Enterprise Size, 2023 to 2033 Figure 35: North America Market Value (US$ Million) by Solution, 2023 to 2033 Figure 36: North America Market Value (US$ Million) by Country, 2023 to 2033 Figure 37: North America Market Value (US$ Million) Analysis by Country, 2018 to 2033 Figure 38: North America Market Value Share (%) and BPS Analysis by Country, 2023 to 2033 Figure 39: North America Market Y-o-Y Growth (%) Projections by Country, 2023 to 2033 Figure 40: North America Market Value (US$ Million) Analysis by Business Type, 2018 to 2033 Figure 41: North America Market Value Share (%) and BPS Analysis by Business Type, 2023 to 2033 Figure 42: North America Market Y-o-Y Growth (%) Projections by Business Type, 2023 to 2033 Figure 43: North America Market Value (US$ Million) Analysis by Touch Points, 2018 to 2033 Figure 44: North America Market Value Share (%) and BPS Analysis by Touch Points, 2023 to 2033 Figure 45: North America Market Y-o-Y Growth (%) Projections by Touch Points, 2023 to 2033 Figure 46: North America Market Value (US$ Million) Analysis by Industry , 2018 to 2033 Figure 47: North America Market Value Share (%) and BPS Analysis by Industry , 2023 to 2033 Figure 48: North America Market Y-o-Y Growth (%) Projections by Industry , 2023 to 2033 Figure 49: North America Market Value (US$ Million) Analysis by Enterprise Size, 2018 to 2033 Figure 50: North America Market Value Share (%) and BPS Analysis by Enterprise Size, 2023 to 2033 Figure 51: North America Market Y-o-Y Growth (%) Projections by Enterprise Size, 2023 to 2033 Figure 52: North America Market Value (US$ Million) Analysis by Solution, 2018 to 2033 Figure 53: North America Market Value Share (%) and BPS Analysis by Solution, 2023 to 2033 Figure 54: North America Market Y-o-Y Growth (%) Projections by Solution, 2023 to 2033 Figure 55: North America Market Attractiveness by Business Type, 2023 to 2033 Figure 56: North America Market Attractiveness by Touch Points, 2023 to 2033 Figure 57: North America Market Attractiveness by Industry , 2023 to 2033 Figure 58: North America Market Attractiveness by Enterprise Size, 2023 to 2033 Figure 59: North America Market Attractiveness by Solution, 2023 to 2033 Figure 60: North America Market Attractiveness by Country, 2023 to 2033 Figure 61: Latin America Market Value (US$ Million) by Business Type, 2023 to 2033 Figure 62: Latin America Market Value (US$ Million) by Touch Points, 2023 to 2033 Figure 63: Latin America Market Value (US$ Million) by Industry , 2023 to 2033 Figure 64: Latin America Market Value (US$ Million) by Enterprise Size, 2023 to 2033 Figure 65: Latin America Market Value (US$ Million) by Solution, 2023 to 2033 Figure 66: Latin America Market Value (US$ Million) by Country, 2023 to 2033 Figure 67: Latin America Market Value (US$ Million) Analysis by Country, 2018 to 2033 Figure 68: Latin America Market Value Share (%) and BPS Analysis by Country, 2023 to 2033 Figure 69: Latin America Market Y-o-Y Growth (%) Projections by Country, 2023 to 2033 Figure 70: Latin America Market Value (US$ Million) Analysis by Business Type, 2018 to 2033 Figure 71: Latin America Market Value Share (%) and BPS Analysis by Business Type, 2023 to 2033 Figure 72: Latin America Market Y-o-Y Growth (%) Projections by Business Type, 2023 to 2033 Figure 73: Latin America Market Value (US$ Million) Analysis by Touch Points, 2018 to 2033 Figure 74: Latin America Market Value Share (%) and BPS Analysis by Touch Points, 2023 to 2033 Figure 75: Latin America Market Y-o-Y Growth (%) Projections by Touch Points, 2023 to 2033 Figure 76: Latin America Market Value (US$ Million) Analysis by Industry , 2018 to 2033 Figure 77: Latin America Market Value Share (%) and BPS Analysis by Industry , 2023 to 2033 Figure 78: Latin America Market Y-o-Y Growth (%) Projections by Industry , 2023 to 2033 Figure 79: Latin America Market Value (US$ Million) Analysis by Enterprise Size, 2018 to 2033 Figure 80: Latin America Market Value Share (%) and BPS Analysis by Enterprise Size, 2023 to 2033 Figure 81: Latin America Market Y-o-Y Growth (%) Projections by Enterprise Size, 2023 to 2033 Figure 82: Latin America Market Value (US$ Million) Analysis by Solution, 2018 to 2033 Figure 83: Latin America Market Value Share (%) and BPS Analysis by Solution, 2023 to 2033 Figure 84: Latin America Market Y-o-Y Growth (%) Projections by Solution, 2023 to 2033 Figure 85: Latin America Market Attractiveness by Business Type, 2023 to 2033 Figure 86: Latin America Market Attractiveness by Touch Points, 2023 to 2033 Figure 87: Latin America Market Attractiveness by Industry , 2023 to 2033 Figure 88: Latin America Market Attractiveness by Enterprise Size, 2023 to 2033 Figure 89: Latin America Market Attractiveness by Solution, 2023 to 2033 Figure 90: Latin America Market Attractiveness by Country, 2023 to 2033 Figure 91: Western Europe Market Value (US$ Million) by Business Type, 2023 to 2033 Figure 92: Western Europe Market Value (US$ Million) by Touch Points, 2023 to 2033 Figure 93: Western Europe Market Value (US$ Million) by Industry , 2023 to 2033 Figure 94: Western Europe Market Value (US$ Million) by Enterprise Size, 2023 to 2033 Figure 95: Western Europe Market Value (US$ Million) by Solution, 2023 to 2033 Figure 96: Western Europe Market Value (US$ Million) by Country, 2023 to 2033 Figure 97: Western Europe Market Value (US$ Million) Analysis by Country, 2018 to 2033 Figure 98: Western Europe Market Value Share (%) and BPS Analysis by Country, 2023 to 2033 Figure 99: Western Europe Market Y-o-Y Growth (%) Projections by Country, 2023 to 2033 Figure 100: Western Europe Market Value (US$ Million) Analysis by Business Type, 2018 to 2033 Figure 101: Western Europe Market Value Share (%) and BPS Analysis by Business Type, 2023 to 2033 Figure 102: Western Europe Market Y-o-Y Growth (%) Projections by Business Type, 2023 to 2033 Figure 103: Western Europe Market Value (US$ Million) Analysis by Touch Points, 2018 to 2033 Figure 104: Western Europe Market Value Share (%) and BPS Analysis by Touch Points, 2023 to 2033 Figure 105: Western Europe Market Y-o-Y Growth (%) Projections by Touch Points, 2023 to 2033 Figure 106: Western Europe Market Value (US$ Million) Analysis by Industry , 2018 to 2033 Figure 107: Western Europe Market Value Share (%) and BPS Analysis by Industry , 2023 to 2033 Figure 108: Western Europe Market Y-o-Y Growth (%) Projections by Industry , 2023 to 2033 Figure 109: Western Europe Market Value (US$ Million) Analysis by Enterprise Size, 2018 to 2033 Figure 110: Western Europe Market Value Share (%) and BPS Analysis by Enterprise Size, 2023 to 2033 Figure 111: Western Europe Market Y-o-Y Growth (%) Projections by Enterprise Size, 2023 to 2033 Figure 112: Western Europe Market Value (US$ Million) Analysis by Solution, 2018 to 2033 Figure 113: Western Europe Market Value Share (%) and BPS Analysis by Solution, 2023 to 2033 Figure 114: Western Europe Market Y-o-Y Growth (%) Projections by Solution, 2023 to 2033 Figure 115: Western Europe Market Attractiveness by Business Type, 2023 to 2033 Figure 116: Western Europe Market Attractiveness by Touch Points, 2023 to 2033 Figure 117: Western Europe Market Attractiveness by Industry , 2023 to 2033 Figure 118: Western Europe Market Attractiveness by Enterprise Size, 2023 to 2033 Figure 119: Western Europe Market Attractiveness by Solution, 2023 to 2033 Figure 120: Western Europe Market Attractiveness by Country, 2023 to 2033 Figure 121: Eastern Europe Market Value (US$ Million) by Business Type, 2023 to 2033 Figure 122: Eastern Europe Market Value (US$ Million) by Touch Points, 2023 to 2033 Figure 123: Eastern Europe Market Value (US$ Million) by Industry , 2023 to 2033 Figure 124: Eastern Europe Market Value (US$ Million) by Enterprise Size, 2023 to 2033 Figure 125: Eastern Europe Market Value (US$ Million) by Solution, 2023 to 2033 Figure 126: Eastern Europe Market Value (US$ Million) by Country, 2023 to 2033 Figure 127: Eastern Europe Market Value (US$ Million) Analysis by Country, 2018 to 2033 Figure 128: Eastern Europe Market Value Share (%) and BPS Analysis by Country, 2023 to 2033 Figure 129: Eastern Europe Market Y-o-Y Growth (%) Projections by Country, 2023 to 2033 Figure 130: Eastern Europe Market Value (US$ Million) Analysis by Business Type, 2018 to 2033 Figure 131: Eastern Europe Market Value Share (%) and BPS Analysis by Business Type, 2023 to 2033 Figure 132: Eastern Europe Market Y-o-Y Growth (%) Projections by Business Type, 2023 to 2033 Figure 133: Eastern Europe Market Value (US$ Million) Analysis by Touch Points, 2018 to 2033 Figure 134: Eastern Europe Market Value Share (%) and BPS Analysis by Touch Points, 2023 to 2033 Figure 135: Eastern Europe Market Y-o-Y Growth (%) Projections by Touch Points, 2023 to 2033 Figure 136: Eastern Europe Market Value (US$ Million) Analysis by Industry , 2018 to 2033 Figure 137: Eastern Europe Market Value Share (%) and BPS Analysis by Industry , 2023 to 2033 Figure 138: Eastern Europe Market Y-o-Y Growth (%) Projections by Industry , 2023 to 2033 Figure 139: Eastern Europe Market Value (US$ Million) Analysis by Enterprise Size, 2018 to 2033 Figure 140: Eastern Europe Market Value Share (%) and BPS Analysis by Enterprise Size, 2023 to 2033 Figure 141: Eastern Europe Market Y-o-Y Growth (%) Projections by Enterprise Size, 2023 to 2033 Figure 142: Eastern Europe Market Value (US$ Million) Analysis by Solution, 2018 to 2033 Figure 143: Eastern Europe Market Value Share (%) and BPS Analysis by Solution, 2023 to 2033 Figure 144: Eastern Europe Market Y-o-Y Growth (%) Projections by Solution, 2023 to 2033 Figure 145: Eastern Europe Market Attractiveness by Business Type, 2023 to 2033 Figure 146: Eastern Europe Market Attractiveness by Touch Points, 2023 to 2033 Figure 147: Eastern Europe Market Attractiveness by Industry , 2023 to 2033 Figure 148: Eastern Europe Market Attractiveness by Enterprise Size, 2023 to 2033 Figure 149: Eastern Europe Market Attractiveness by Solution, 2023 to 2033 Figure 150: Eastern Europe Market Attractiveness by Country, 2023 to 2033 Figure 151: South Asia and Pacific Market Value (US$ Million) by Business Type, 2023 to 2033 Figure 152: South Asia and Pacific Market Value (US$ Million) by Touch Points, 2023 to 2033 Figure 153: South Asia and Pacific Market Value (US$ Million) by Industry , 2023 to 2033 Figure 154: South Asia and Pacific Market Value (US$ Million) by Enterprise Size, 2023 to 2033 Figure 155: South Asia and Pacific Market Value (US$ Million) by Solution, 2023 to 2033 Figure 156: South Asia and Pacific Market Value (US$ Million) by Country, 2023 to 2033 Figure 157: South Asia and Pacific Market Value (US$ Million) Analysis by Country, 2018 to 2033 Figure 158: South Asia and Pacific Market Value Share (%) and BPS Analysis by Country, 2023 to 2033 Figure 159: South Asia and Pacific Market Y-o-Y Growth (%) Projections by Country, 2023 to 2033 Figure 160: South Asia and Pacific Market Value (US$ Million) Analysis by Business Type, 2018 to 2033 Figure 161: South Asia and Pacific Market Value Share (%) and BPS Analysis by Business Type, 2023 to 2033 Figure 162: South Asia and Pacific Market Y-o-Y Growth (%) Projections by Business Type, 2023 to 2033 Figure 163: South Asia and Pacific Market Value (US$ Million) Analysis by Touch Points, 2018 to 2033 Figure 164: South Asia and Pacific Market Value Share (%) and BPS Analysis by Touch Points, 2023 to 2033 Figure 165: South Asia and Pacific Market Y-o-Y Growth (%) Projections by Touch Points, 2023 to 2033 Figure 166: South Asia and Pacific Market Value (US$ Million) Analysis by Industry , 2018 to 2033 Figure 167: South Asia and Pacific Market Value Share (%) and BPS Analysis by Industry , 2023 to 2033 Figure 168: South Asia and Pacific Market Y-o-Y Growth (%) Projections by Industry , 2023 to 2033 Figure 169: South Asia and Pacific Market Value (US$ Million) Analysis by Enterprise Size, 2018 to 2033 Figure 170: South Asia and Pacific Market Value Share (%) and BPS Analysis by Enterprise Size, 2023 to 2033 Figure 171: South Asia and Pacific Market Y-o-Y Growth (%) Projections by Enterprise Size, 2023 to 2033 Figure 172: South Asia and Pacific Market Value (US$ Million) Analysis by Solution, 2018 to 2033 Figure 173: South Asia and Pacific Market Value Share (%) and BPS Analysis by Solution, 2023 to 2033 Figure 174: South Asia and Pacific Market Y-o-Y Growth (%) Projections by Solution, 2023 to 2033 Figure 175: South Asia and Pacific Market Attractiveness by Business Type, 2023 to 2033 Figure 176: South Asia and Pacific Market Attractiveness by Touch Points, 2023 to 2033 Figure 177: South Asia and Pacific Market Attractiveness by Industry , 2023 to 2033 Figure 178: South Asia and Pacific Market Attractiveness by Enterprise Size, 2023 to 2033 Figure 179: South Asia and Pacific Market Attractiveness by Solution, 2023 to 2033 Figure 180: South Asia and Pacific Market Attractiveness by Country, 2023 to 2033 Figure 181: East Asia Market Value (US$ Million) by Business Type, 2023 to 2033 Figure 182: East Asia Market Value (US$ Million) by Touch Points, 2023 to 2033 Figure 183: East Asia Market Value (US$ Million) by Industry , 2023 to 2033 Figure 184: East Asia Market Value (US$ Million) by Enterprise Size, 2023 to 2033 Figure 185: East Asia Market Value (US$ Million) by Solution, 2023 to 2033 Figure 186: East Asia Market Value (US$ Million) by Country, 2023 to 2033 Figure 187: East Asia Market Value (US$ Million) Analysis by Country, 2018 to 2033 Figure 188: East Asia Market Value Share (%) and BPS Analysis by Country, 2023 to 2033 Figure 189: East Asia Market Y-o-Y Growth (%) Projections by Country, 2023 to 2033 Figure 190: East Asia Market Value (US$ Million) Analysis by Business Type, 2018 to 2033 Figure 191: East Asia Market Value Share (%) and BPS Analysis by Business Type, 2023 to 2033 Figure 192: East Asia Market Y-o-Y Growth (%) Projections by Business Type, 2023 to 2033 Figure 193: East Asia Market Value (US$ Million) Analysis by Touch Points, 2018 to 2033 Figure 194: East Asia Market Value Share (%) and BPS Analysis by Touch Points, 2023 to 2033 Figure 195: East Asia Market Y-o-Y Growth (%) Projections by Touch Points, 2023 to 2033 Figure 196: East Asia Market Value (US$ Million) Analysis by Industry , 2018 to 2033 Figure 197: East Asia Market Value Share (%) and BPS Analysis by Industry , 2023 to 2033 Figure 198: East Asia Market Y-o-Y Growth (%) Projections by Industry , 2023 to 2033 Figure 199: East Asia Market Value (US$ Million) Analysis by Enterprise Size, 2018 to 2033 Figure 200: East Asia Market Value Share (%) and BPS Analysis by Enterprise Size, 2023 to 2033 Figure 201: East Asia Market Y-o-Y Growth (%) Projections by Enterprise Size, 2023 to 2033 Figure 202: East Asia Market Value (US$ Million) Analysis by Solution, 2018 to 2033 Figure 203: East Asia Market Value Share (%) and BPS Analysis by Solution, 2023 to 2033 Figure 204: East Asia Market Y-o-Y Growth (%) Projections by Solution, 2023 to 2033 Figure 205: East Asia Market Attractiveness by Business Type, 2023 to 2033 Figure 206: East Asia Market Attractiveness by Touch Points, 2023 to 2033 Figure 207: East Asia Market Attractiveness by Industry , 2023 to 2033 Figure 208: East Asia Market Attractiveness by Enterprise Size, 2023 to 2033 Figure 209: East Asia Market Attractiveness by Solution, 2023 to 2033 Figure 210: East Asia Market Attractiveness by Country, 2023 to 2033 Figure 211: Middle East and Africa Market Value (US$ Million) by Business Type, 2023 to 2033 Figure 212: Middle East and Africa Market Value (US$ Million) by Touch Points, 2023 to 2033 Figure 213: Middle East and Africa Market Value (US$ Million) by Industry , 2023 to 2033 Figure 214: Middle East and Africa Market Value (US$ Million) by Enterprise Size, 2023 to 2033 Figure 215: Middle East and Africa Market Value (US$ Million) by Solution, 2023 to 2033 Figure 216: Middle East and Africa Market Value (US$ Million) by Country, 2023 to 2033 Figure 217: Middle East and Africa Market Value (US$ Million) Analysis by Country, 2018 to 2033 Figure 218: Middle East and Africa Market Value Share (%) and BPS Analysis by Country, 2023 to 2033 Figure 219: Middle East and Africa Market Y-o-Y Growth (%) Projections by Country, 2023 to 2033 Figure 220: Middle East and Africa Market Value (US$ Million) Analysis by Business Type, 2018 to 2033 Figure 221: Middle East and Africa Market Value Share (%) and BPS Analysis by Business Type, 2023 to 2033 Figure 222: Middle East and Africa Market Y-o-Y Growth (%) Projections by Business Type, 2023 to 2033 Figure 223: Middle East and Africa Market Value (US$ Million) Analysis by Touch Points, 2018 to 2033 Figure 224: Middle East and Africa Market Value Share (%) and BPS Analysis by Touch Points, 2023 to 2033 Figure 225: Middle East and Africa Market Y-o-Y Growth (%) Projections by Touch Points, 2023 to 2033 Figure 226: Middle East and Africa Market Value (US$ Million) Analysis by Industry , 2018 to 2033 Figure 227: Middle East and Africa Market Value Share (%) and BPS Analysis by Industry , 2023 to 2033 Figure 228: Middle East and Africa Market Y-o-Y Growth (%) Projections by Industry , 2023 to 2033 Figure 229: Middle East and Africa Market Value (US$ Million) Analysis by Enterprise Size, 2018 to 2033 Figure 230: Middle East and Africa Market Value Share (%) and BPS Analysis by Enterprise Size, 2023 to 2033 Figure 231: Middle East and Africa Market Y-o-Y Growth (%) Projections by Enterprise Size, 2023 to 2033 Figure 232: Middle East and Africa Market Value (US$ Million) Analysis by Solution, 2018 to 2033 Figure 233: Middle East and Africa Market Value Share (%) and BPS Analysis by Solution, 2023 to 2033 Figure 234: Middle East and Africa Market Y-o-Y Growth (%) Projections by Solution, 2023 to 2033 Figure 235: Middle East and Africa Market Attractiveness by Business Type, 2023 to 2033 Figure 236: Middle East and Africa Market Attractiveness by Touch Points, 2023 to 2033 Figure 237: Middle East and Africa Market Attractiveness by Industry , 2023 to 2033 Figure 238: Middle East and Africa Market Attractiveness by Enterprise Size, 2023 to 2033 Figure 239: Middle East and Africa Market Attractiveness by Solution, 2023 to 2033 Figure 240: Middle East and Africa Market Attractiveness by Country, 2023 to 2033
Recommendations
Explore Technology Insights
View Reports