The injectable drug industry in North America is showing strong growth, supported by advancements in biologics, increased prevalence of chronic diseases, and rising adoption of targeted therapies. The market is witnessing higher demand due to the effectiveness of injectables in delivering rapid therapeutic action, especially in critical care and chronic disease management. Increasing investments in pharmaceutical research and development, combined with a growing focus on patient-centric drug delivery systems, are shaping the regional industry.
The use of prefilled syringes, auto-injectors, and innovative formulations is further improving treatment adherence and safety. Expanding healthcare infrastructure, supportive regulatory frameworks, and greater access to advanced therapies have also boosted adoption across hospitals and clinics. The rise in geriatric population, coupled with higher incidences of cancer, diabetes, and autoimmune disorders, continues to fuel demand for injectable drugs.
Moreover, partnerships between pharmaceutical companies and healthcare providers are ensuring wider accessibility of these therapies As North America remains at the forefront of innovation in biologics and specialty medicines, the injectable drug market is projected to experience sustained growth in the coming years.
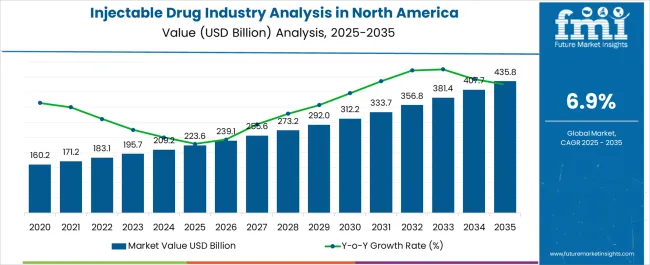
| Metric | Value |
|---|---|
| Injectable Drug Industry Analysis in North America Estimated Value in (2025 E) | USD 223.6 billion |
| Injectable Drug Industry Analysis in North America Forecast Value in (2035 F) | USD 435.8 billion |
| Forecast CAGR (2025 to 2035) | 6.9% |
The market is segmented by Drug Class, Route Of Administration, Therapeutic Area, Molecule Type, and Distribution Channel and region. By Drug Class, the market is divided into Antibiotics, Antivirals, Antifungal, Antibacterial, Analgesics, Antipsychotic, Opioids, Local And General Anesthetics, Anticoagulants, Anticovasculants, Muscle Relaxant, Antihistamines, Corticosteroids, Calcium, Cardiotonic, Sympathomimetic, Hormonal Contraceptive, Intravenous Infusion, Vasodilator, Beta-blockers, Vitamins, Antiemetic, Proton-Pump Inhibitors (PPIs), Chemotherapy Drugs, and Others. In terms of Route Of Administration, the market is classified into Intravenous (IV) Injections, Intramuscular (IM) Injections, and Subcutaneous (SC) Injections. Based on Therapeutic Area, the market is segmented into Pain Management, Cardiovascular Disease, Infectious Disease, Allergy, Gastrointestinal Disease, Nutrition Deficiency, Hematology Disorders, Gynecology, and Cancer. By Molecule Type, the market is divided into Small Molecules and Large Molecules. By Distribution Channel, the market is segmented into Hospitals, Clinics, Ambulatory Surgical Centers, Long Term Care Facilities, Retail Pharmacy Chains, and Online Pharmacies/Mail Order Pharmacies. Regionally, the market is classified into North America, Latin America, Western Europe, Eastern Europe, Balkan & Baltic Countries, Russia & Belarus, Central Asia, East Asia, South Asia & Pacific, and the Middle East & Africa.
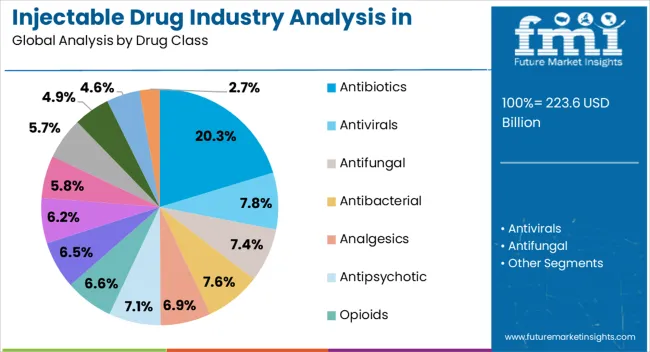
The antibiotics drug class segment is projected to hold 20.3% of the injectable drug industry revenue share in North America in 2025, highlighting its continued relevance in healthcare. Antibiotics delivered via injectable form are preferred in cases requiring immediate therapeutic intervention, such as sepsis and severe infections, where oral therapies may not be effective. The rising prevalence of resistant bacterial strains has further increased reliance on injectable antibiotics, as they offer higher bioavailability and more rapid clinical outcomes.
Hospitals and specialty clinics across the region rely heavily on injectable antibiotics for inpatient care, surgical prophylaxis, and critical infections. Pharmaceutical companies are also introducing advanced formulations to combat resistance and improve safety profiles, which is supporting adoption. Growing regulatory approvals of novel injectable antibiotics and expanded clinical use are ensuring their continued role in the therapeutic landscape.
Additionally, public health initiatives focused on managing antimicrobial resistance are reinforcing demand With continuous research in anti-infective drugs and the need for effective hospital-based treatments, the antibiotics segment is expected to remain a significant contributor to the industry.
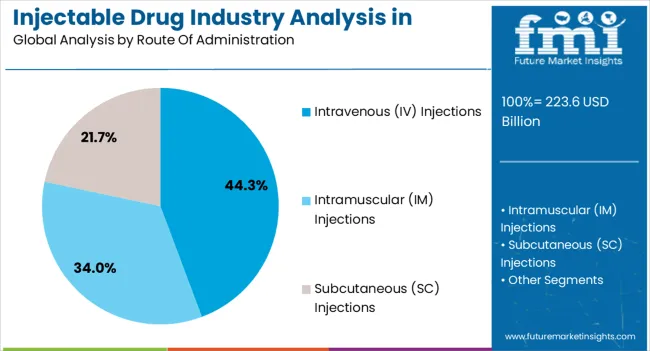
The intravenous injections segment is expected to account for 44.3% of the injectable drug industry revenue share in North America in 2025, making it the leading route of administration. Intravenous delivery is widely adopted due to its ability to provide immediate systemic effects and precise dosing, which are crucial for managing critical care conditions. It is extensively used in hospitals for oncology, cardiology, infectious diseases, and emergency treatments where rapid drug action is essential.
The versatility of IV injections in accommodating a wide range of drugs, including biologics and biosimilars, has further strengthened their role. Growth is being supported by increasing hospital admissions, higher demand for infusion therapies, and innovations in infusion devices that improve patient safety. Additionally, intravenous administration is preferred for drugs with poor oral bioavailability, which has reinforced its importance in treatment regimens.
Rising prevalence of chronic diseases and expansion of specialty care centers across North America continue to drive adoption As more advanced formulations are introduced, IV injections are expected to retain their dominance in the market.
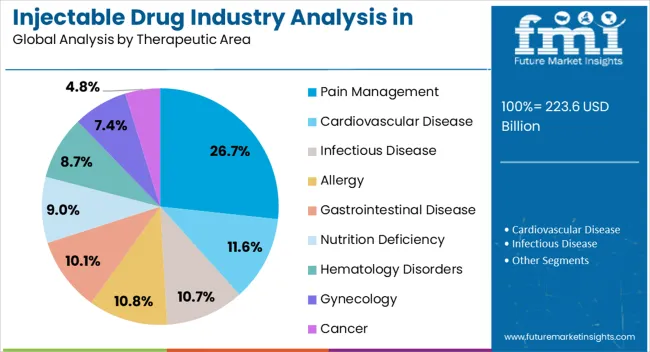
The pain management therapeutic area segment is anticipated to capture 26.7% of the injectable drug industry revenue share in North America in 2025, underscoring its importance in clinical care. Rising prevalence of chronic pain conditions such as arthritis, lower back pain, neuropathic disorders, and cancer-related pain is driving demand for effective injectable therapies. Injectable pain medications provide faster relief compared to oral alternatives, making them a preferred choice for acute care and severe pain episodes.
Hospitals and ambulatory surgical centers are increasingly utilizing injectable pain treatments during surgical procedures and postoperative care, which is boosting adoption. The rising focus on patient-centric pain management and the introduction of long-acting injectable formulations are also contributing to market expansion. Concerns related to opioid misuse are encouraging pharmaceutical companies to develop non-opioid injectable alternatives, which are gaining attention across the region.
In addition, advancements in targeted drug delivery for localized pain relief are enhancing therapeutic outcomes As the demand for effective pain control continues to grow, the pain management segment is expected to maintain a leading role within the injectable drug industry.
Injectable drugs such as antibiotics, antivirals, analgesics, corticosteroids, vasodilators, antipsychotics, and opioids are witnessing high demand across North America. This can be attributed to rising incidence of chronic disease and quick and effective action of injectables.
Injectable drugs are becoming versatile and effective means of delivering medication quickly. Their fast action, enhanced bioavailability, and higher effectiveness make them popular in managing a wide variety of medical conditions.
Healthcare professionals prefer injectable drugs, especially in complex cases, as they allow for accurate dosing and rapid biological response. Growing popularity of injectable drugs for treating chronic infections, diabetes, cancer, and pain will propel sales growth.
The rise of biologics like insulin, monoclonal antibodies, and gene therapies is opening new growth windows for injectable drug companies. Similarly, rising popularity of self-injectables due to their convenience will benefit the injectable drug industry in North America.
Sales remain particularly high for analgesic drugs owing to their adoption for pain management. These medications quickly and effectively relieve severe pain, making them highly sought-after in the region.
There are a handful of sterile injectable manufacturers with limited production capacity. Also, the manufacturing process is complicated and has large lead time. These factors have made the injectable drug industry prone to shortage.
As per the survey conducted by ASHP in March 2025, there was a shortage of certain important injectable drugs. The key finding of the survey showed prefilled 50% dextrose syringes, 0.9% saline syringes or vials, local anesthetic vials (with or without epinephrine), and prefilled epinephrine syringes were severely impacted by the shortage along with other medications.
To address this shortage, manufacturers are focusing on enhancing their production capacity. They are also collaborating with contract manufacturing organizations (CMOs) to reduce costs and save their time.
Sales of injectable drugs in North America increased at a CAGR of 5.9% from 2020 to 2025. Total revenue at the end of 2035 reached around USD 223.6 billion. Between 2025 and 2035, injectable drug demand in the region is forecast to surge at 6.9% CAGR.
Growing awareness about the advantages of injectables is a key factor propelling demand. Injectable drugs offer multiple benefits, including fast action and high effectiveness. This is making them popular among healthcare professionals and patients.
Another contributor to the industry expansion is the continuous drug approval and product launch. Top injectable drug manufacturers are constantly introducing new products targeting various therapeutic areas.
In 2025, the United States Food & Drug Administration (US FDA) approved over 100 injectable drugs. Also, in April 2025, Endo Pharmaceutical announced the launch of Argatroban injection through Premier's ProRx private-label program.
In January 2025, Hikma launched the diazepam injection, USP, in a single-dose prefilled syringe. This shows the harmony between the strategic moves adopted by companies and the supporting regulatory process, which is fueling the injectable drug industry.
Rising trend of outsourcing drug development processes is emerging as a key factor boosting the industry. Injectable pharmaceutical companies are shifting toward contract development and manufacturing organizations for numerous reasons.
Outsourcing manufacturing allows companies to increase their production capacity and tackle the drug shortage within the industry. It also reduces the investment required for facility and maintaining the team of experts.
The growing adoption of generic injectable drugs is another factor boosting injectable drug industry growth in North America. According to the US FDA, 91% of all prescriptions are generic drugs in the United States.
In 2020, the FDA granted approval for 80 new orphan indications and further 53 approvals in 2024. Hence, the shift toward outsourcing manufacturing activities, increased adoption of generic drugs, and new approval of orphan drugs will create lucrative growth prospects for manufacturers.
Despite the significant opportunity for injectable drug industry, the high operational costs of injectable drugs act as a restraint for the industry. These medications require complex equipment for manufacturing. This leads to high operating costs and high debt levels due to the purchase or rent-to-lease of capital equipment.
The elevated expenses can create challenges for patients, healthcare providers, and healthcare systems, potentially leading to restricted access and utilization of injectable therapies. Additionally, high drug prices may result in increased financial burdens on individuals and healthcare budgets, influencing treatment decisions and industry expansion.
The regulatory cost burden is also high as the United States Food and Drug Administration (FDA) mandates to maintain a high degree of care in not only manufacturing but also packaging, storage, and distribution. Some areas of high cost include maintaining sterility from bacterial and fungal contamination and stability issues (crystallization). This can limit industry expansion.
The table below shows the estimated growth rates of different nations across North America. Canada is set to witness high injectable drug consumption, recording a CAGR of 8.7% through 2035.
Growth Outlook by Key Countries
| Countries | Value CAGR |
|---|---|
| United States | 6.8% |
| Canada | 8.7% |
The United States injectable drug industry has a bright future, with total valuation reaching USD 223.6 billion in 2025. Emerging trends indicate injectable drug sales to rise at around 6.8% across the United States through 2035.
Growing incidence of chronic diseases, such as diabetes and cancer, is a key factor providing impetus for sales growth. Subsequently, escalating popularity of biologics, especially insulin and other cancer treatments, administered through injection will boost sales.
The United States has a well-established healthcare infrastructure which establishes its dominance in North America. According to the American Hospital Association (AHA), there are around 916,752 staffed beds in all United States hospitals and about 33,679,935 admissions.
The growing hospital admissions and high prevalence of chronic diseases are leading to increased use of injectable drugs, thereby pushing sales growth. Strong presence of top pharmaceutical giants is also improving the United States injectable drug industry share.
Canada is emerging as a highly remunerative pocket for injectable drug manufacturers and distributors. A robust CAGR of 8.7% has been predicted for Canada's injectable drug industry between 2025 and 2035.
Canada has a stringent regulatory framework, and there is growing adoption of biologics. These complex molecules, often administered via injection, offer targeted therapies for various diseases. This is providing impetus for the growth of injectable drug industry in the country.
The ongoing innovations in drug delivery systems and rising burden of diseases are other factors behind the rising sales of injectable drugs. Similarly, favorable government support will aid in the expansion of the target industry.
The section covers all the leading segments of North America’s injectable drug industry. By drug class, the analgesics segment is projected to witness a CAGR of 8.8% through 2035. In terms of route of administration, the intravenous (IV) injections segment is likely to showcase a 6.0% CAGR through 2035.
Growth Outlook by Drug Class
| Drug Class | Value CAGR |
|---|---|
| Antibiotics | 5.1% |
| Antivirals | 7.0% |
| Antifungal | 9.4% |
| Antibacterial | 4.8% |
| Analgesics | 8.8% |
| Antipsychotic | 7.6% |
| Opioids | 4.1% |
| Local and General Anesthetics | 7.8% |
| Anticoagulants | 9.0% |
| Anticovasculants | 7.7% |
| Muscle Relaxant | 8.3% |
| Antihistamines | 7.2% |
| Corticosteroids | 4.4% |
| Calcium | 6.1% |
| Cardiotonic | 8.0% |
| Sympathomimetic | 9.2% |
| Hormonal Contraceptive | 4.7% |
| Intravenous Infusion | 9.1% |
| Vasodilator | 5.7% |
| Beta-blockers | 4.6% |
| Vitamins | 7.3% |
| Antiemetic | 8.4% |
| Proton-Pump Inhibitors (PPIs) | 4.2% |
| Chemotherapy Drugs | 8.4% |
| Others | 5.2% |
Injectable analgesic drugs are in high demand across North America. This is attributable to growing need for pain management across different therapeutic areas. As per the latest analysis, the analgesics segment will display a CAGR of 8.8%, accounting for a revenue share of 12.6% in 2035.
Analgesics drugs like paracetamol, opioids, aspirin, and NSAIDS are the first line to treat many cases of pain management. Injectable analgesics are especially gaining popularity in North America due to their ability to quickly and effectively relieve severe or acute pain.
Growth Outlook by Route of Administration
| Route of Administration | Value CAGR |
|---|---|
| Intravenous (IV) Injections | 6.0% |
| Intramuscular (IM) Injections | 7.7% |
| Subcutaneous (SC) Injections | 8.8% |
Intravenous injections remain the gold standard route of administration in North America. This is due to its multiple benefits, including fast drug delivery and precision. This route of administration is ideal in situations where speed and accuracy are significant.
As per the latest report, the intravenous injections segment will continue to retain its dominance in North America, holding a share of 47.9% in 2025. Further, a CAGR of 6.0% is on the cards for the target segment.
Intravenous administration is a widely preferred route of administration in hospitals and by major surgeons. This is because it offers predictable bioavailability and precise dosage delivery.
In chronic cases where quick response is required, IV route is used. IV medications have the tendency to deliver life-saving drugs quickly and effectively in situations like heart attack, shock, and chronic infection.
Growth Outlook By Therapeutic Area
| Therapeutic Area | Value CAGR |
|---|---|
| Pain Management | 5.4% |
| Cardiovascular Disease | 7.9% |
| Infectious Disease | 5.9% |
| Allergy | 6.8% |
| Gastrointestinal Disease | 6.5% |
| Nutrition Deficiency | 4.1% |
| Hematology Disorders | 5.0% |
| Gynecology | 7.3% |
| Cancer | 9.8% |
Injectable drug usage is rising rapidly in cancer treatments due to their fast and quick action. Courtesy of this, the target segment will probably thrive at 9.8% CAGR between 2025 and 2035.
Growing incidence of cancer in North America will lead to higher demand for cancer treatments, creating growth opportunities for injectable drug manufacturers. Similarly, rising importance of injectable drugs for cancer is set to accelerating segment growth.
According to the World Health Organization (WHO), the cancer burden is escalating in North America and other regions. This, in turn, is propelling demand for chemotherapy and other cancer treatments that use injectable drugs.
Chemotherapy is the most widely used treatment option for cancer patients. It involves administration of chemical agents through IV route to target cancerous cells. Hence, growing cancer prevalence and rise in chemotherapy will continue to give the cancer segment a slight edge over other therapeutic areas.
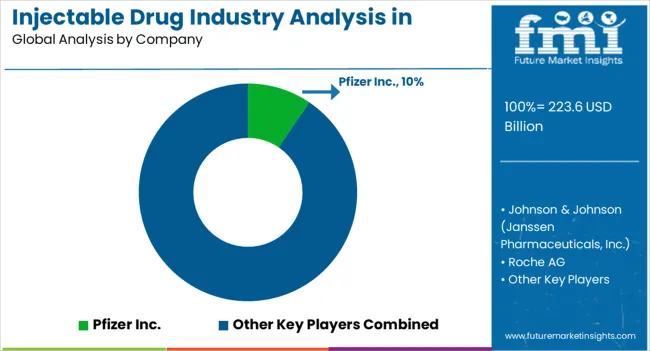
Leading manufacturers of injectable drugs in North America are constantly investing in research and development to explore new drugs targeting various therapeutic areas. They are also exploring new drug delivery systems, including self-injectable options, as well as developing targeted therapies and biologics to stay ahead of the competition.
Several injectable drug companies are partnering and collaborating with contract manufacturing organizations (CMOs) to reduce costs and save time. Similarly, the North America injectable drug industry is witnessing strategies like acquisitions, distribution agreements, and mergers as players look to push their expertise and footprint.
Recent Developments in North America Injectable Drug Industry
| Attribute | Details |
|---|---|
| Industry Value in 2025 | USD 209.2 billion |
| Industry Size in 2035 | USD 407.2 billion |
| Growth Rate (2025 to 2035) | 6.9% CAGR |
| Forecast Period | 2025 to 2035 |
| Historical Data Available for | 2020 to 2025 |
| Industry Analysis | USD billion for Value |
| Key Regions Covered | North America |
| Key Countries Covered | United States, Canada, and Mexico |
| Key Industry Segments Covered | Drug Class, Route of Administration, Therapeutic Area, Molecule Type, and Distribution Channel. |
| Key Companies Profiled | Pfizer Inc.; GlaxoSmithKline Plc.; Sanofi; Merck & Co., Inc.; Eli Lilly and Company; Boehringer Ingelheim International GmbH; Johnson & Johnson (Janssen Pharmaceuticals, Inc.); Bayer AG; Amgen Inc.; Novo Nordisk A/S; Takeda Pharmaceutical Company Limited; Eisai Co., Ltd.; Sandoz (Novartis AG); Teva Pharmaceutical Industries Ltd.; Cipla Ltd.; Sun Pharmaceutical Industries Ltd.; Lupin Pharmaceuticals; Hikma Pharmaceuticals PLC; Viatris Inc. (Mylan N.V); Endo International (Par Pharmaceutical ); Aspen Pharmacare; Aurobindo Pharma |
| Report Coverage | Industry Forecast, Competition Intelligence, DROT Analysis, Industry Dynamics and Challenges, Strategic Growth Initiatives |
The global injectable drug industry analysis in north america is estimated to be valued at USD 223.6 billion in 2025.
The market size for the injectable drug industry analysis in north america is projected to reach USD 435.8 billion by 2035.
The injectable drug industry analysis in north america is expected to grow at a 6.9% CAGR between 2025 and 2035.
The key product types in injectable drug industry analysis in north america are antibiotics, antivirals, antifungal, antibacterial, analgesics, antipsychotic, opioids, local and general anesthetics, anticoagulants, anticovasculants, muscle relaxant, antihistamines, corticosteroids, calcium, cardiotonic, sympathomimetic, hormonal contraceptive, intravenous infusion, vasodilator, beta-blockers, vitamins, antiemetic, proton-pump inhibitors (ppis), chemotherapy drugs and others.
In terms of route of administration, intravenous (iv) injections segment to command 44.3% share in the injectable drug industry analysis in north america in 2025.


Our Research Products

The "Full Research Suite" delivers actionable market intel, deep dives on markets or technologies, so clients act faster, cut risk, and unlock growth.

The Leaderboard benchmarks and ranks top vendors, classifying them as Established Leaders, Leading Challengers, or Disruptors & Challengers.

Locates where complements amplify value and substitutes erode it, forecasting net impact by horizon

We deliver granular, decision-grade intel: market sizing, 5-year forecasts, pricing, adoption, usage, revenue, and operational KPIs—plus competitor tracking, regulation, and value chains—across 60 countries broadly.

Spot the shifts before they hit your P&L. We track inflection points, adoption curves, pricing moves, and ecosystem plays to show where demand is heading, why it is changing, and what to do next across high-growth markets and disruptive tech

Real-time reads of user behavior. We track shifting priorities, perceptions of today’s and next-gen services, and provider experience, then pace how fast tech moves from trial to adoption, blending buyer, consumer, and channel inputs with social signals (#WhySwitch, #UX).

Partner with our analyst team to build a custom report designed around your business priorities. From analysing market trends to assessing competitors or crafting bespoke datasets, we tailor insights to your needs.
Supplier Intelligence
Discovery & Profiling
Capacity & Footprint
Performance & Risk
Compliance & Governance
Commercial Readiness
Who Supplies Whom
Scorecards & Shortlists
Playbooks & Docs
Category Intelligence
Definition & Scope
Demand & Use Cases
Cost Drivers
Market Structure
Supply Chain Map
Trade & Policy
Operating Norms
Deliverables
Buyer Intelligence
Account Basics
Spend & Scope
Procurement Model
Vendor Requirements
Terms & Policies
Entry Strategy
Pain Points & Triggers
Outputs
Pricing Analysis
Benchmarks
Trends
Should-Cost
Indexation
Landed Cost
Commercial Terms
Deliverables
Brand Analysis
Positioning & Value Prop
Share & Presence
Customer Evidence
Go-to-Market
Digital & Reputation
Compliance & Trust
KPIs & Gaps
Outputs
Full Research Suite comprises of:
Market outlook & trends analysis
Interviews & case studies
Strategic recommendations
Vendor profiles & capabilities analysis
5-year forecasts
8 regions and 60+ country-level data splits
Market segment data splits
12 months of continuous data updates
DELIVERED AS:
PDF EXCEL ONLINE
Industry Analysis of Paper Bag in North America Size and Share Forecast Outlook 2025 to 2035
Snowplow Industry Analysis in North America Size and Share Forecast Outlook 2025 to 2035
Toilet Seat Industry Analysis in North America Size and Share Forecast Outlook 2025 to 2035
Cosmetic Jar Industry Analysis in North America Size and Share Forecast Outlook 2025 to 2035
Carbon Steel Industry Analysis in North America Forecast & Analysis: 2025 to 2035
North America Booklet Label Market Growth – Trends & Forecast 2023-2033
North America Cement Packaging Industry Analysis – Trends & Forecast 2024-2034
Palletizing Robot Industry Analysis in North America Size and Share Forecast Outlook 2025 to 2035
Potassium Formate Industry Analysis in North America - Size, Share & Forecast 2025 to 2035
Organic Fertilizer Industry Analysis in North America Analysis – Size, Share, and Forecast Outlook 2025 to 2035
North America Vertical Turbine Pump Market Analysis & Forecast by Head, Material Type, Stages, Power Rating, End-use, and Region Through 2035
Luxury Interior Fabric Industry Analysis in North America and Europe Growth, Trends and Forecast from 2025 to 2035
Home Healthcare Software Industry Analysis in North America Size and Share Forecast Outlook 2025 to 2035
Hardware Asset Management Industry Analysis in North America Forecast Outlook 2025 to 2035
Yoga & Meditation Product Industry analysis in North America Size and Share Forecast Outlook 2025 to 2035
Medium Voltage Transformer Industry Analysis in North America Size and Share Forecast Outlook 2025 to 2035
Walk-In Cooler and Freezer Market Growth – Trends & Forecast 2024-2034
Yoga and Meditation Service Industry Analysis in North Americat Growth – Demand & Forecast 2025 to 2035
Fountain Dispenser Equipment Industry Analysis in North America Growth, Trends and Forecast from 2025 to 2035
North America Returnable Transport Packaging Market Trends – Forecast 2023-2033

Thank you!
You will receive an email from our Business Development Manager. Please be sure to check your SPAM/JUNK folder too.
Chat With
MaRIA