Reports

- Global Locations -

Headquarters

Future Market Insights, Inc.

Christiana Corporate, 200
Continental Drive, Suite 401,
Newark, Delaware - 19713,
United States

T: +1-845-579-5705

Americas

Future Market Insights, Inc.

616 Corporate Way, Suite 2-9018,
Valley Cottage, NY 10989, United States

T: +1-347-918-3531

MEA

Future Market Insights

1602-6 Jumeirah Bay X2 Tower, Plot No: JLT-PH2-X2A,
Jumeirah Lakes Towers, Dubai,
United Arab Emirates

Europe

Future Market Insights

3rd Floor, 207 Regent Street,
W1B 3HH London
United Kingdom

T: + 44 (0) 20 8123 9659
D: +44 (0) 20 3287 4268

Asia Pacific

Future Market Insights

IndiaLand Global Tech Park, Unit UG-1, Behind Grand HighStreet, Phase 1, Hinjawadi, MH, Pune – 411057, India

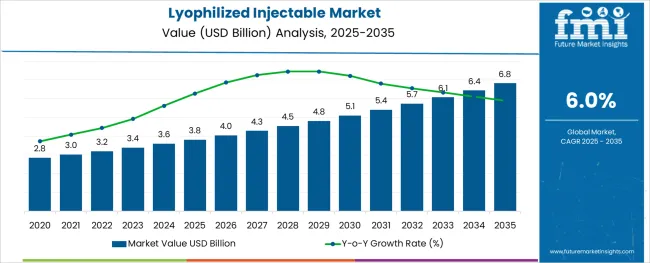
Lyophilized Injectable Market Outlook (2023 to 2033)

The global lyophilized injectable market is projected to register at a moderate-paced (Compound Annual Growth Rate) CAGR of 5.8% over the forecast period. The lyophilized injectable market is currently valued at US$ 3043.55 Million in 2023. By 2033, demand for lyophilized injectables is expected to reach a high of US$ 5348.56 Million.

This growth in the adoption of lyophilized injectables is supported by the following:

  • Increased investments from the biotech, pharma and biopharma industries have led to a rise in research and development efforts.
  • Increases in both study and adoption of lyophilized injectable drugs
  • Expansion of government spending

Don't pay for what you don't need

Customize your report by selecting specific countries or regions and save 30%!

Increasing approval of pharmaceutical products

Trials that are still going on are revealing added information about the safety and effectiveness of new lyophilized medicines that are being used to treat COVID-19. Manufacturers in the global lyophilized injectable market are getting licenses from the USA Food and Drug Administration (FDA) for the Emergency Use Authorization (EUA) of these products so they can treat people with severe COVID-19 symptoms.

Since the COVID-19 pandemic, companies that export lyophilized injectables have worked harder to obtain authorization from authorities like the Drug Controller General of India (DCGI) so that their goods may be used in India for limited emergency purposes. As more medications, like Remdesivir, get approved, the need for lyophilized injections will inevitably rise. The Food and Drug Administration (FDA) and other regulatory agencies have given their approvals for the following:

  • In February 2020, the Drug Controller General of India (DCGI) granted regulatory approval to Mylan for the use of lyophilized Remdesivir powder in India for restricted emergency usage in COVID-19 patients.
  • In June 2020, Cipla introduced Cipremi, which is a lyophilized powder form of Remdesivir intended for injection. Furthermore, the USA Food and Drug Administration (FDA) granted Gilead Sciences Inc. an Emergency Use Authorization (EUA) for the use of Remdesivir in the treatment of hospitalized COVID-19 patients. It is the only EUA medication that has been approved by the FDA for both adult and pediatric patients who are hospitalized and suspected of having or have laboratory confirmation of having COVID-19 infection. Therefore, in May, Gilead Sciences Inc. granted Cipla a license to produce and distribute CIPREMI, which is Cipla's generic version of remdesivir. This license was granted voluntarily and was not exclusive.
  • The Drug Controller General of India (DCGI) granted Jubilant Life approval in July 2020 to manufacture and market Remdesivir for 100 mg/vial (lyophilized injection) for restricted emergency use in India for the treatment of severe COVID-19. This approval was granted to Jubilant Life for the treatment of severe COVID-19.
  • EU approval for the lyophilized powder in a single-use vial formulation of Cosentyx was granted by Novartis AG in August 2020. Psoriasis patients who took the medication that was eventually approved saw significant and speedy improvements in their skin problems, which led to an overall improvement in the patient’s quality of life.

As a result, the expansion of the market for lyophilized injections is being driven by the rising number of approvals being granted all over the world.

Attribute Details
Market Value (2023) US$ 3043.55 Million
Market Value (2033) US$ 5348.56 Million
CAGR 5.8%

Key Drivers and Restraints for the Lyophilized Injectable Market

There has been a significant increase in the number of businesses throughout the world using lyophilization technology because of the superior quality and longer shelf life of lyophilized medications. There has been a substantial uptick in the utilization of lyophilized injection pharmaceuticals by global contract research and manufacturing firms during the past few years. The primary motivation for this change is to supply final consumers with better goods. Opportunities in the global lyophilized injectable market are being created by reasons such as the fast growth of Contract Research Manufacturing Services (CRAMS).

Due to their safety and capacity to fulfill their stated functions, lyophilized products have witnessed a substantial increase in usage recently compared to non-lyophilized ones. Besides this, the cold chain is not necessary for these items. Therefore, they contribute to lower carbon footprints and total expenses. As a result of these factors, the lyophilized injectable market is predicted to expand into new lucrative areas in the coming years.

The expansion of the sector for lyophilized injection drugs may be hampered by several incidents involving the recall of products containing complex medications. In recent years, there has been a significant increase in product recalls that have been reported by manufacturers. These recalls have been brought about by the presence of unwanted foreign substances or by adverse drug effects. Recalls have the potential to harm a company's reputation as well as its ability to generate revenue.

Sabyasachi Ghosh
Sabyasachi Ghosh

Principal Consultant

Talk to Analyst

Find your sweet spots for generating winning opportunities in this market.

Comparative Analysis of Adjacent Markets

Lyophilized Injectable Market:

Differentiating Aspects Lyophilized Injectable Market
CAGR 5.8%
Market Valuation in 2023 US$ 3043.55 Million
Projected Market Value in 2033 US$ 5348.56 Million
Drivers Globally, the incidence of chronic diseases is rising. Increasing investments in Research and Development by businesses There has been a rise in the number of lyophilized injection drugs approved for use. The evolution of the lyophilized injections drug delivery system

Congenital Hyperinsulinism Treatment Market:

Differentiating Aspects Congenital Hyperinsulinism Treatment Market
CAGR 5.7Z%
Market Valuation in 2023 US$ 206.0 Million
Projected Market Value in 2033 US$ 319.9 Million
Drivers Improvements in diagnosis and management of congenital hyperinsulinism The number of studies aimed at discovering new treatments for congenital hyperinsulinism has increased.

Urinary Tract Infection Therapeutic Market:

Differentiating Aspects Urinary Tract Infection Therapeutic Market
CAGR 3%
Market Valuation in 2023 US$ 8,665.5 Million
Projected Market Value in 2033 US$ 10,686.5 Million
Drivers Constantly high rates of urinary tract infection throughout the world. The aging population and the rising incidence of diabetes

Category-wise Insights

It is anticipated that the injection supplies pharmaceuticals market coming from the retail pharmacy segment is anticipated to hold more than 30 percent of the total industry share by 2033. As they provide convenient access, cheap rates, high-end customer care, and an extensive selection of items, retail pharmacies have emerged as one of the primary distribution channels. This is because retail pharmacies offer all these benefits.

In addition to this, pharmacies and other retail locations sell pharmaceuticals and offer individuals individualized guidance that caters to their specific healthcare issues and needs. In recent years, there has been a considerable increase in the number of retail pharmacies as well as pharmacy chains, which is indicative of a strong preference among customers for this type of distribution channel.

It is anticipated that the demand for lyophilized injectable medicines in the prefilled device category is likely to reach US$210 Billion by 2033. Prefilled devices are becoming increasingly popular because of their ability to reduce the amount of time that patients are required to wait during hospital visits and to improve the level of medical care.

Along with ensuring the safe and convenient delivery of treatment, it also guarantees an elevated level of precision in the dosing of medications. Although the introduction of prefilled devices across a spectrum of drug classes and therapeutic categories can look quite different, it is anticipated that demand for the product is likely to remain steady.
Get the data you need at a Fraction of the cost

Personalize your report by choosing insights you need
and save 40%!

Regional Insights

What are the driving factors for the USA Lyophilized Injectable Market?

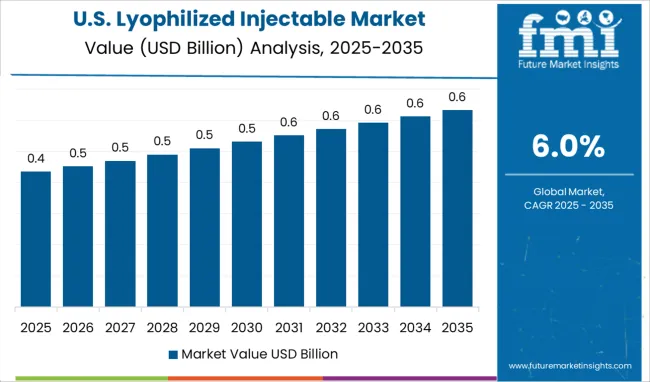
The lyophilized Injectable market is estimated to grow profitably in North America in the upcoming years because of the rising frequency of disorders in the United States. . The presence of significant manufacturers, like Fresenius Kabi and Merck & Co. Inc., and Amneal Pharmaceutical, both are involved in the production of lyophilized injections and helping to drive growth in the USA Lyophilized Injectable Market. Furthermore, the increasing number of product approvals made by regulatory authorities in North America is anticipated to be fueling the expansion of the USA Lyophilized Injectable Market.
What are the defining characteristics of the European Lyophilized Injectable Market?

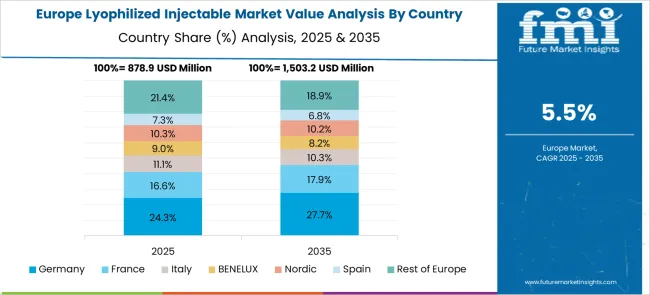
It is expected that the size of the lyophilized injectable market in Europe is expected to exceed US$185 Billion by 2030. This region is predicted to become a suitable region for the expansion of existing businesses due to the rising incidence of cancer and other ailments. Europe, which has one of the oldest populations overall, is home to some of the world's oldest individuals. The growth of the senior population, which has a compromised immunological and metabolic system and is consequently at a higher risk of developing life-threatening illnesses, is another significant factor that is projected to propel the sector. According to several studies, the native populations of Belgium, the Netherlands, Denmark, and Ireland have the greatest incidence of cancer patients compared to that of any other European nation.

Remdesivir Lyophilized Powder Receives End-User Authorization in India for the Treatment of COVID-19

The coronavirus has grown to pose a significant threat to public health because it causes such severe respiratory symptoms and is ever-evolving. Adult hospitalized patients with COVID-19 are the focus of ongoing research on the efficacy and safety of novel lyophilized treatment medicines. Within this context, Cipla, a worldwide pharmaceutical business, is getting attention for releasing CIPREMI, a remdesivir lyophilized powder for injection (100 mg). Manufacturers in the lyophilized injectable market are adopting cues from these developments to enhance access to the Emergency Use Authorization (EUA) medication approved by the USA Food and Drug Administration for people experiencing severe COVID-19 symptoms.

With the third wave of the pandemic hitting India, manufacturers in the lyophilized injections industry there are stepping up their efforts to secure regulatory permission from the Drug Controller General of India (DCGI) for limited emergency use in the country.
Competitive Landscape

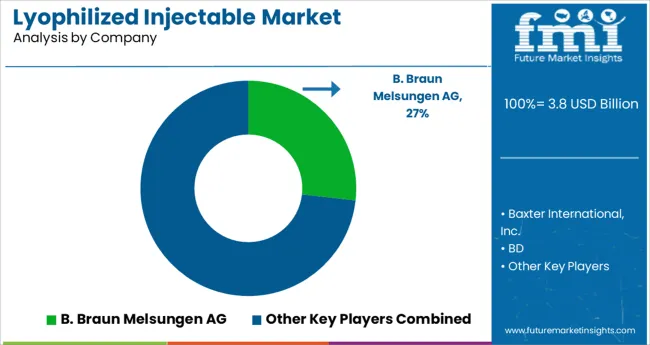
Major players catering to the global demand for lyophilized injectables are showing a rising interest in the creation of drug delivery systems that are universal, upgradeable, and configurable. To do this, they are putting a significant amount of money into research and development-related operations.

A trend toward the incorporation of electronic components into injectors and other types of devices is likely to emerge among industry participants in the years to come. It is anticipated that these capabilities are expected to permit modification as per the user type that is proposed. Soon, it's anticipated that these devices' networking capabilities will allow for remote upgrades. As of this element, the process of managing the lifecycle of these devices is anticipated to become less difficult.

Key players in this industry rely on a strategy of continuous product development and improvement to meet the needs of their clients throughout the world and maintain their reputation in the cutthroat global lyophilized injectable market. In April of 2022, for instance, Recipharm purchased both the advanced therapy CDMO (Contract Development and Manufacturing Organization) Arranta Bio and the virotherapy CDMO Vibalogics. As a result of the purchase, Recipharm now has a sturdy foundation in the USA owing to its new Boxborough, Massachusetts facilities, and a solid foundation upon which to expand its capabilities into other biologics modalities.

Key Segments in the Lyophilized Injectable Market

Packaging:

  • Single-Use Vials
  • Point-of-Care Reconstitution
  • Specialty Packaging

Type of Delivery:

  • Prefilled Diluent Syringes
  • Single-Step Devices
  • Proprietary Reconstitution Devices
  • Multi-Step Devices

Indication:

  • Metabolic and Oncology Conditions
  • Infectious Diseases
  • Autoimmune Diseases
  • Others

End User:

  • Hospitals
  • Ambulatory Surgical Centers
  • Specialty Clinics
  • Others

By Region:

  • North America
  • Latin America
  • Asia Pacific
  • MEA (Middle East and Africa)
  • Europe

Frequently Asked Questions

What is the Growth Outlook for the Lyophilized Injectable Market?

The growth outlook for the Lyophilized Injectable market is predicted to advance at a CAGR of 5.8% from 2022 to 2032.

Which Region Leads the Lyophilized Injectable Market?

Europe region is anticipated to lead the Lyophilized Injectable market over the forecast period.

What is the market valuation of Lyophilized Injectable in 2023?

The valuation of the Lyophilized Injectable market stands at US$ 3043.55 Million in 2023.

How much Growth Potential do Lyophilized Injectable hold?

The Lyophilized Injectable market is likely to hold a valuation of US$ 5348.56 Million by 2033.

Table of Content

1. Executive Summary | Lyophilized Injectable Market

    1.1. Global Market Outlook

    1.2. Demand-side Trends

    1.3. Supply-side Trends

    1.4. Technology Roadmap Analysis

    1.5. Analysis and Recommendations

2. Market Overview

    2.1. Market Coverage / Taxonomy

    2.2. Market Definition / Scope / Limitations

3. Market Background

    3.1. Market Dynamics

        3.1.1. Drivers

        3.1.2. Restraints

        3.1.3. Opportunity

        3.1.4. Trends

    3.2. Scenario Forecast

        3.2.1. Demand in Optimistic Scenario

        3.2.2. Demand in Likely Scenario

        3.2.3. Demand in Conservative Scenario

    3.3. Opportunity Map Analysis

    3.4. Investment Feasibility Matrix

    3.5. PESTLE and Porter’s Analysis

    3.6. Regulatory Landscape

        3.6.1. By Key Regions

        3.6.2. By Key Countries

    3.7. Regional Parent Market Outlook

4. Global Market Analysis 2017 to 2021 and Forecast, 2022 to 2032

    4.1. Historical Market Size Value (US$ Million) Analysis, 2017 to 2021

    4.2. Current and Future Market Size Value (US$ Million) Projections, 2022 to 2032

        4.2.1. Y-o-Y Growth Trend Analysis

        4.2.2. Absolute $ Opportunity Analysis

5. Global Market Analysis 2017 to 2021 and Forecast 2022 to 2032, By Type of Packaging

    5.1. Introduction / Key Findings

    5.2. Historical Market Size Value (US$ Million) Analysis By Type of Packaging, 2017 to 2021

    5.3. Current and Future Market Size Value (US$ Million) Analysis and Forecast By Type of Packaging, 2022 to 2032

        5.3.1. Single-use Vials

        5.3.2. Point-of-care Reconstitution

        5.3.3. Specialty Packaging

    5.4. Y-o-Y Growth Trend Analysis By Type of Packaging, 2017 to 2021

    5.5. Absolute $ Opportunity Analysis By Type of Packaging, 2022 to 2032

6. Global Market Analysis 2017 to 2021 and Forecast 2022 to 2032, By Type of Delivery

    6.1. Introduction / Key Findings

    6.2. Historical Market Size Value (US$ Million) Analysis By Type of Delivery, 2017 to 2021

    6.3. Current and Future Market Size Value (US$ Million) Analysis and Forecast By Type of Delivery, 2022 to 2032

        6.3.1. Prefilled Diluent Syringes

        6.3.2. Proprietary Reconstitution Devices

        6.3.3. Single-step Devices

        6.3.4. Multi-step Devices

    6.4. Y-o-Y Growth Trend Analysis By Type of Delivery, 2017 to 2021

    6.5. Absolute $ Opportunity Analysis By Type of Delivery, 2022 to 2032

7. Global Market Analysis 2017 to 2021 and Forecast 2022 to 2032, By Indication

    7.1. Introduction / Key Findings

    7.2. Historical Market Size Value (US$ Million) Analysis By Indication, 2017 to 2021

    7.3. Current and Future Market Size Value (US$ Million) Analysis and Forecast By Indication, 2022 to 2032

        7.3.1. Autoimmune Diseases

        7.3.2. Infectious Diseases

        7.3.3. Metabolic Conditions

        7.3.4. Others

    7.4. Y-o-Y Growth Trend Analysis By Indication, 2017 to 2021

    7.5. Absolute $ Opportunity Analysis By Indication, 2022 to 2032

8. Global Market Analysis 2017 to 2021 and Forecast 2022 to 2032, By End User

    8.1. Introduction / Key Findings

    8.2. Historical Market Size Value (US$ Million) Analysis By End User, 2017 to 2021

    8.3. Current and Future Market Size Value (US$ Million) Analysis and Forecast By End User, 2022 to 2032

        8.3.1. Hospitals

        8.3.2. Ambulatory Surgical Centers

        8.3.3. Specialty Clinics

        8.3.4. Others

    8.4. Y-o-Y Growth Trend Analysis By End User, 2017 to 2021

    8.5. Absolute $ Opportunity Analysis By End User, 2022 to 2032

9. Global Market Analysis 2017 to 2021 and Forecast 2022 to 2032, By Region

    9.1. Introduction

    9.2. Historical Market Size Value (US$ Million) Analysis By Region, 2017 to 2021

    9.3. Current Market Size Value (US$ Million) Analysis and Forecast By Region, 2022 to 2032

        9.3.1. North America

        9.3.2. Latin America

        9.3.3. Europe

        9.3.4. Asia Pacific

        9.3.5. Middle East and Africa(MEA)

    9.4. Market Attractiveness Analysis By Region

10. North America Market Analysis 2017 to 2021 and Forecast 2022 to 2032, By Country

    10.1. Historical Market Size Value (US$ Million) Trend Analysis By Market Taxonomy, 2017 to 2021

    10.2. Market Size Value (US$ Million) Forecast By Market Taxonomy, 2022 to 2032

        10.2.1. By Country

            10.2.1.1. USA

            10.2.1.2. Canada

        10.2.2. By Type of Packaging

        10.2.3. By Type of Delivery

        10.2.4. By Indication

        10.2.5. By End User

    10.3. Market Attractiveness Analysis

        10.3.1. By Country

        10.3.2. By Type of Packaging

        10.3.3. By Type of Delivery

        10.3.4. By Indication

        10.3.5. By End User

    10.4. Key Takeaways

11. Latin America Market Analysis 2017 to 2021 and Forecast 2022 to 2032, By Country

    11.1. Historical Market Size Value (US$ Million) Trend Analysis By Market Taxonomy, 2017 to 2021

    11.2. Market Size Value (US$ Million) Forecast By Market Taxonomy, 2022 to 2032

        11.2.1. By Country

            11.2.1.1. Brazil

            11.2.1.2. Mexico

            11.2.1.3. Rest of Latin America

        11.2.2. By Type of Packaging

        11.2.3. By Type of Delivery

        11.2.4. By Indication

        11.2.5. By End User

    11.3. Market Attractiveness Analysis

        11.3.1. By Country

        11.3.2. By Type of Packaging

        11.3.3. By Type of Delivery

        11.3.4. By Indication

        11.3.5. By End User

    11.4. Key Takeaways

12. Europe Market Analysis 2017 to 2021 and Forecast 2022 to 2032, By Country

    12.1. Historical Market Size Value (US$ Million) Trend Analysis By Market Taxonomy, 2017 to 2021

    12.2. Market Size Value (US$ Million) Forecast By Market Taxonomy, 2022 to 2032

        12.2.1. By Country

            12.2.1.1. Germany

            12.2.1.2. United Kingdom

            12.2.1.3. France

            12.2.1.4. Spain

            12.2.1.5. Italy

            12.2.1.6. Rest of Europe

        12.2.2. By Type of Packaging

        12.2.3. By Type of Delivery

        12.2.4. By Indication

        12.2.5. By End User

    12.3. Market Attractiveness Analysis

        12.3.1. By Country

        12.3.2. By Type of Packaging

        12.3.3. By Type of Delivery

        12.3.4. By Indication

        12.3.5. By End User

    12.4. Key Takeaways

13. Asia Pacific Market Analysis 2017 to 2021 and Forecast 2022 to 2032, By Country

    13.1. Historical Market Size Value (US$ Million) Trend Analysis By Market Taxonomy, 2017 to 2021

    13.2. Market Size Value (US$ Million) Forecast By Market Taxonomy, 2022 to 2032

        13.2.1. By Country

            13.2.1.1. China

            13.2.1.2. Japan

            13.2.1.3. South Korea

            13.2.1.4. India

            13.2.1.5. Malaysia

            13.2.1.6. Singapore

            13.2.1.7. Australia

            13.2.1.8. New Zealand

            13.2.1.9. Rest of Asia Pacific

        13.2.2. By Type of Packaging

        13.2.3. By Type of Delivery

        13.2.4. By Indication

        13.2.5. By End User

    13.3. Market Attractiveness Analysis

        13.3.1. By Country

        13.3.2. By Type of Packaging

        13.3.3. By Type of Delivery

        13.3.4. By Indication

        13.3.5. By End User

    13.4. Key Takeaways

14. MEA Market Analysis 2017 to 2021 and Forecast 2022 to 2032, By Country

    14.1. Historical Market Size Value (US$ Million) Trend Analysis By Market Taxonomy, 2017 to 2021

    14.2. Market Size Value (US$ Million) Forecast By Market Taxonomy, 2022 to 2032

        14.2.1. By Country

            14.2.1.1. GCC Countries

            14.2.1.2. South Africa

            14.2.1.3. Israel

            14.2.1.4. Rest of Middle East and Africa(MEA)

        14.2.2. By Type of Packaging

        14.2.3. By Type of Delivery

        14.2.4. By Indication

        14.2.5. By End User

    14.3. Market Attractiveness Analysis

        14.3.1. By Country

        14.3.2. By Type of Packaging

        14.3.3. By Type of Delivery

        14.3.4. By Indication

        14.3.5. By End User

    14.4. Key Takeaways

15. Key Countries Market Analysis

    15.1. USA

        15.1.1. Pricing Analysis

        15.1.2. Market Share Analysis, 2021

            15.1.2.1. By Type of Packaging

            15.1.2.2. By Type of Delivery

            15.1.2.3. By Indication

            15.1.2.4. By End User

    15.2. Canada

        15.2.1. Pricing Analysis

        15.2.2. Market Share Analysis, 2021

            15.2.2.1. By Type of Packaging

            15.2.2.2. By Type of Delivery

            15.2.2.3. By Indication

            15.2.2.4. By End User

    15.3. Brazil

        15.3.1. Pricing Analysis

        15.3.2. Market Share Analysis, 2021

            15.3.2.1. By Type of Packaging

            15.3.2.2. By Type of Delivery

            15.3.2.3. By Indication

            15.3.2.4. By End User

    15.4. Mexico

        15.4.1. Pricing Analysis

        15.4.2. Market Share Analysis, 2021

            15.4.2.1. By Type of Packaging

            15.4.2.2. By Type of Delivery

            15.4.2.3. By Indication

            15.4.2.4. By End User

    15.5. Germany

        15.5.1. Pricing Analysis

        15.5.2. Market Share Analysis, 2021

            15.5.2.1. By Type of Packaging

            15.5.2.2. By Type of Delivery

            15.5.2.3. By Indication

            15.5.2.4. By End User

    15.6. United Kingdom

        15.6.1. Pricing Analysis

        15.6.2. Market Share Analysis, 2021

            15.6.2.1. By Type of Packaging

            15.6.2.2. By Type of Delivery

            15.6.2.3. By Indication

            15.6.2.4. By End User

    15.7. France

        15.7.1. Pricing Analysis

        15.7.2. Market Share Analysis, 2021

            15.7.2.1. By Type of Packaging

            15.7.2.2. By Type of Delivery

            15.7.2.3. By Indication

            15.7.2.4. By End User

    15.8. Spain

        15.8.1. Pricing Analysis

        15.8.2. Market Share Analysis, 2021

            15.8.2.1. By Type of Packaging

            15.8.2.2. By Type of Delivery

            15.8.2.3. By Indication

            15.8.2.4. By End User

    15.9. Italy

        15.9.1. Pricing Analysis

        15.9.2. Market Share Analysis, 2021

            15.9.2.1. By Type of Packaging

            15.9.2.2. By Type of Delivery

            15.9.2.3. By Indication

            15.9.2.4. By End User

    15.10. China

        15.10.1. Pricing Analysis

        15.10.2. Market Share Analysis, 2021

            15.10.2.1. By Type of Packaging

            15.10.2.2. By Type of Delivery

            15.10.2.3. By Indication

            15.10.2.4. By End User

    15.11. Japan

        15.11.1. Pricing Analysis

        15.11.2. Market Share Analysis, 2021

            15.11.2.1. By Type of Packaging

            15.11.2.2. By Type of Delivery

            15.11.2.3. By Indication

            15.11.2.4. By End User

    15.12. South Korea

        15.12.1. Pricing Analysis

        15.12.2. Market Share Analysis, 2021

            15.12.2.1. By Type of Packaging

            15.12.2.2. By Type of Delivery

            15.12.2.3. By Indication

            15.12.2.4. By End User

    15.13. Malaysia

        15.13.1. Pricing Analysis

        15.13.2. Market Share Analysis, 2021

            15.13.2.1. By Type of Packaging

            15.13.2.2. By Type of Delivery

            15.13.2.3. By Indication

            15.13.2.4. By End User

    15.14. Singapore

        15.14.1. Pricing Analysis

        15.14.2. Market Share Analysis, 2021

            15.14.2.1. By Type of Packaging

            15.14.2.2. By Type of Delivery

            15.14.2.3. By Indication

            15.14.2.4. By End User

    15.15. Australia

        15.15.1. Pricing Analysis

        15.15.2. Market Share Analysis, 2021

            15.15.2.1. By Type of Packaging

            15.15.2.2. By Type of Delivery

            15.15.2.3. By Indication

            15.15.2.4. By End User

    15.16. New Zealand

        15.16.1. Pricing Analysis

        15.16.2. Market Share Analysis, 2021

            15.16.2.1. By Type of Packaging

            15.16.2.2. By Type of Delivery

            15.16.2.3. By Indication

            15.16.2.4. By End User

    15.17. GCC Countries

        15.17.1. Pricing Analysis

        15.17.2. Market Share Analysis, 2021

            15.17.2.1. By Type of Packaging

            15.17.2.2. By Type of Delivery

            15.17.2.3. By Indication

            15.17.2.4. By End User

    15.18. South Africa

        15.18.1. Pricing Analysis

        15.18.2. Market Share Analysis, 2021

            15.18.2.1. By Type of Packaging

            15.18.2.2. By Type of Delivery

            15.18.2.3. By Indication

            15.18.2.4. By End User

    15.19. Israel

        15.19.1. Pricing Analysis

        15.19.2. Market Share Analysis, 2021

            15.19.2.1. By Type of Packaging

            15.19.2.2. By Type of Delivery

            15.19.2.3. By Indication

            15.19.2.4. By End User

16. Market Structure Analysis

    16.1. Competition Dashboard

    16.2. Competition Benchmarking

    16.3. Market Share Analysis of Top Players

        16.3.1. By Regional

        16.3.2. By Type of Packaging

        16.3.3. By Type of Delivery

        16.3.4. By Indication

        16.3.5. By End User

17. Competition Analysis

    17.1. Competition Deep Dive

        17.1.1. B. Braun Melsungen AG

            17.1.1.1. Overview

            17.1.1.2. Product Portfolio

            17.1.1.3. Profitability by Market Segments

            17.1.1.4. Sales Footprint

            17.1.1.5. Strategy Overview

                17.1.1.5.1. Marketing Strategy

        17.1.2. Baxter International, Inc.

            17.1.2.1. Overview

            17.1.2.2. Product Portfolio

            17.1.2.3. Profitability by Market Segments

            17.1.2.4. Sales Footprint

            17.1.2.5. Strategy Overview

                17.1.2.5.1. Marketing Strategy

        17.1.3. BD

            17.1.3.1. Overview

            17.1.3.2. Product Portfolio

            17.1.3.3. Profitability by Market Segments

            17.1.3.4. Sales Footprint

            17.1.3.5. Strategy Overview

                17.1.3.5.1. Marketing Strategy

        17.1.4. Schott AG

            17.1.4.1. Overview

            17.1.4.2. Product Portfolio

            17.1.4.3. Profitability by Market Segments

            17.1.4.4. Sales Footprint

            17.1.4.5. Strategy Overview

                17.1.4.5.1. Marketing Strategy

        17.1.5. Aristopharma Ltd.

            17.1.5.1. Overview

            17.1.5.2. Product Portfolio

            17.1.5.3. Profitability by Market Segments

            17.1.5.4. Sales Footprint

            17.1.5.5. Strategy Overview

                17.1.5.5.1. Marketing Strategy

        17.1.6. Vetter Pharma

            17.1.6.1. Overview

            17.1.6.2. Product Portfolio

            17.1.6.3. Profitability by Market Segments

            17.1.6.4. Sales Footprint

            17.1.6.5. Strategy Overview

                17.1.6.5.1. Marketing Strategy

        17.1.7. Jubilant HollisterStier LLC

            17.1.7.1. Overview

            17.1.7.2. Product Portfolio

            17.1.7.3. Profitability by Market Segments

            17.1.7.4. Sales Footprint

            17.1.7.5. Strategy Overview

                17.1.7.5.1. Marketing Strategy

        17.1.8. among others

            17.1.8.1. Overview

            17.1.8.2. Product Portfolio

            17.1.8.3. Profitability by Market Segments

            17.1.8.4. Sales Footprint

            17.1.8.5. Strategy Overview

                17.1.8.5.1. Marketing Strategy

18. Assumptions & Acronyms Used

19. Research Methodology

List of Tables

Table 1: Global Market Value (US$ Million) Forecast by Region, 2017 to 2032

Table 2: Global Market Value (US$ Million) Forecast by Type of Packaging, 2017 to 2032

Table 3: Global Market Value (US$ Million) Forecast by Type of Delivery, 2017 to 2032

Table 4: Global Market Value (US$ Million) Forecast by Indication, 2017 to 2032

Table 5: Global Market Value (US$ Million) Forecast by End User, 2017 to 2032

Table 6: North America Market Value (US$ Million) Forecast by Country, 2017 to 2032

Table 7: North America Market Value (US$ Million) Forecast by Type of Packaging, 2017 to 2032

Table 8: North America Market Value (US$ Million) Forecast by Type of Delivery, 2017 to 2032

Table 9: North America Market Value (US$ Million) Forecast by Indication, 2017 to 2032

Table 10: North America Market Value (US$ Million) Forecast by End User, 2017 to 2032

Table 11: Latin America Market Value (US$ Million) Forecast by Country, 2017 to 2032

Table 12: Latin America Market Value (US$ Million) Forecast by Type of Packaging, 2017 to 2032

Table 13: Latin America Market Value (US$ Million) Forecast by Type of Delivery, 2017 to 2032

Table 14: Latin America Market Value (US$ Million) Forecast by Indication, 2017 to 2032

Table 15: Latin America Market Value (US$ Million) Forecast by End User, 2017 to 2032

Table 16: Europe Market Value (US$ Million) Forecast by Country, 2017 to 2032

Table 17: Europe Market Value (US$ Million) Forecast by Type of Packaging, 2017 to 2032

Table 18: Europe Market Value (US$ Million) Forecast by Type of Delivery, 2017 to 2032

Table 19: Europe Market Value (US$ Million) Forecast by Indication, 2017 to 2032

Table 20: Europe Market Value (US$ Million) Forecast by End User, 2017 to 2032

Table 21: Asia Pacific Market Value (US$ Million) Forecast by Country, 2017 to 2032

Table 22: Asia Pacific Market Value (US$ Million) Forecast by Type of Packaging, 2017 to 2032

Table 23: Asia Pacific Market Value (US$ Million) Forecast by Type of Delivery, 2017 to 2032

Table 24: Asia Pacific Market Value (US$ Million) Forecast by Indication, 2017 to 2032

Table 25: Asia Pacific Market Value (US$ Million) Forecast by End User, 2017 to 2032

Table 26: MEA Market Value (US$ Million) Forecast by Country, 2017 to 2032

Table 27: MEA Market Value (US$ Million) Forecast by Type of Packaging, 2017 to 2032

Table 28: MEA Market Value (US$ Million) Forecast by Type of Delivery, 2017 to 2032

Table 29: MEA Market Value (US$ Million) Forecast by Indication, 2017 to 2032

Table 30: MEA Market Value (US$ Million) Forecast by End User, 2017 to 2032

List of Charts

Figure 1: Global Market Value (US$ Million) by Type of Packaging, 2022 to 2032

Figure 2: Global Market Value (US$ Million) by Type of Delivery, 2022 to 2032

Figure 3: Global Market Value (US$ Million) by Indication, 2022 to 2032

Figure 4: Global Market Value (US$ Million) by End User, 2022 to 2032

Figure 5: Global Market Value (US$ Million) by Region, 2022 to 2032

Figure 6: Global Market Value (US$ Million) Analysis by Region, 2017 to 2032

Figure 7: Global Market Value Share (%) and BPS Analysis by Region, 2022 to 2032

Figure 8: Global Market Y-o-Y Growth (%) Projections by Region, 2022 to 2032

Figure 9: Global Market Value (US$ Million) Analysis by Type of Packaging, 2017 to 2032

Figure 10: Global Market Value Share (%) and BPS Analysis by Type of Packaging, 2022 to 2032

Figure 11: Global Market Y-o-Y Growth (%) Projections by Type of Packaging, 2022 to 2032

Figure 12: Global Market Value (US$ Million) Analysis by Type of Delivery, 2017 to 2032

Figure 13: Global Market Value Share (%) and BPS Analysis by Type of Delivery, 2022 to 2032

Figure 14: Global Market Y-o-Y Growth (%) Projections by Type of Delivery, 2022 to 2032

Figure 15: Global Market Value (US$ Million) Analysis by Indication, 2017 to 2032

Figure 16: Global Market Value Share (%) and BPS Analysis by Indication, 2022 to 2032

Figure 17: Global Market Y-o-Y Growth (%) Projections by Indication, 2022 to 2032

Figure 18: Global Market Value (US$ Million) Analysis by End User, 2017 to 2032

Figure 19: Global Market Value Share (%) and BPS Analysis by End User, 2022 to 2032

Figure 20: Global Market Y-o-Y Growth (%) Projections by End User, 2022 to 2032

Figure 21: Global Market Attractiveness by Type of Packaging, 2022 to 2032

Figure 22: Global Market Attractiveness by Type of Delivery, 2022 to 2032

Figure 23: Global Market Attractiveness by Indication, 2022 to 2032

Figure 24: Global Market Attractiveness by End User, 2022 to 2032

Figure 25: Global Market Attractiveness by Region, 2022 to 2032

Figure 26: North America Market Value (US$ Million) by Type of Packaging, 2022 to 2032

Figure 27: North America Market Value (US$ Million) by Type of Delivery, 2022 to 2032

Figure 28: North America Market Value (US$ Million) by Indication, 2022 to 2032

Figure 29: North America Market Value (US$ Million) by End User, 2022 to 2032

Figure 30: North America Market Value (US$ Million) by Country, 2022 to 2032

Figure 31: North America Market Value (US$ Million) Analysis by Country, 2017 to 2032

Figure 32: North America Market Value Share (%) and BPS Analysis by Country, 2022 to 2032

Figure 33: North America Market Y-o-Y Growth (%) Projections by Country, 2022 to 2032

Figure 34: North America Market Value (US$ Million) Analysis by Type of Packaging, 2017 to 2032

Figure 35: North America Market Value Share (%) and BPS Analysis by Type of Packaging, 2022 to 2032

Figure 36: North America Market Y-o-Y Growth (%) Projections by Type of Packaging, 2022 to 2032

Figure 37: North America Market Value (US$ Million) Analysis by Type of Delivery, 2017 to 2032

Figure 38: North America Market Value Share (%) and BPS Analysis by Type of Delivery, 2022 to 2032

Figure 39: North America Market Y-o-Y Growth (%) Projections by Type of Delivery, 2022 to 2032

Figure 40: North America Market Value (US$ Million) Analysis by Indication, 2017 to 2032

Figure 41: North America Market Value Share (%) and BPS Analysis by Indication, 2022 to 2032

Figure 42: North America Market Y-o-Y Growth (%) Projections by Indication, 2022 to 2032

Figure 43: North America Market Value (US$ Million) Analysis by End User, 2017 to 2032

Figure 44: North America Market Value Share (%) and BPS Analysis by End User, 2022 to 2032

Figure 45: North America Market Y-o-Y Growth (%) Projections by End User, 2022 to 2032

Figure 46: North America Market Attractiveness by Type of Packaging, 2022 to 2032

Figure 47: North America Market Attractiveness by Type of Delivery, 2022 to 2032

Figure 48: North America Market Attractiveness by Indication, 2022 to 2032

Figure 49: North America Market Attractiveness by End User, 2022 to 2032

Figure 50: North America Market Attractiveness by Country, 2022 to 2032

Figure 51: Latin America Market Value (US$ Million) by Type of Packaging, 2022 to 2032

Figure 52: Latin America Market Value (US$ Million) by Type of Delivery, 2022 to 2032

Figure 53: Latin America Market Value (US$ Million) by Indication, 2022 to 2032

Figure 54: Latin America Market Value (US$ Million) by End User, 2022 to 2032

Figure 55: Latin America Market Value (US$ Million) by Country, 2022 to 2032

Figure 56: Latin America Market Value (US$ Million) Analysis by Country, 2017 to 2032

Figure 57: Latin America Market Value Share (%) and BPS Analysis by Country, 2022 to 2032

Figure 58: Latin America Market Y-o-Y Growth (%) Projections by Country, 2022 to 2032

Figure 59: Latin America Market Value (US$ Million) Analysis by Type of Packaging, 2017 to 2032

Figure 60: Latin America Market Value Share (%) and BPS Analysis by Type of Packaging, 2022 to 2032

Figure 61: Latin America Market Y-o-Y Growth (%) Projections by Type of Packaging, 2022 to 2032

Figure 62: Latin America Market Value (US$ Million) Analysis by Type of Delivery, 2017 to 2032

Figure 63: Latin America Market Value Share (%) and BPS Analysis by Type of Delivery, 2022 to 2032

Figure 64: Latin America Market Y-o-Y Growth (%) Projections by Type of Delivery, 2022 to 2032

Figure 65: Latin America Market Value (US$ Million) Analysis by Indication, 2017 to 2032

Figure 66: Latin America Market Value Share (%) and BPS Analysis by Indication, 2022 to 2032

Figure 67: Latin America Market Y-o-Y Growth (%) Projections by Indication, 2022 to 2032

Figure 68: Latin America Market Value (US$ Million) Analysis by End User, 2017 to 2032

Figure 69: Latin America Market Value Share (%) and BPS Analysis by End User, 2022 to 2032

Figure 70: Latin America Market Y-o-Y Growth (%) Projections by End User, 2022 to 2032

Figure 71: Latin America Market Attractiveness by Type of Packaging, 2022 to 2032

Figure 72: Latin America Market Attractiveness by Type of Delivery, 2022 to 2032

Figure 73: Latin America Market Attractiveness by Indication, 2022 to 2032

Figure 74: Latin America Market Attractiveness by End User, 2022 to 2032

Figure 75: Latin America Market Attractiveness by Country, 2022 to 2032

Figure 76: Europe Market Value (US$ Million) by Type of Packaging, 2022 to 2032

Figure 77: Europe Market Value (US$ Million) by Type of Delivery, 2022 to 2032

Figure 78: Europe Market Value (US$ Million) by Indication, 2022 to 2032

Figure 79: Europe Market Value (US$ Million) by End User, 2022 to 2032

Figure 80: Europe Market Value (US$ Million) by Country, 2022 to 2032

Figure 81: Europe Market Value (US$ Million) Analysis by Country, 2017 to 2032

Figure 82: Europe Market Value Share (%) and BPS Analysis by Country, 2022 to 2032

Figure 83: Europe Market Y-o-Y Growth (%) Projections by Country, 2022 to 2032

Figure 84: Europe Market Value (US$ Million) Analysis by Type of Packaging, 2017 to 2032

Figure 85: Europe Market Value Share (%) and BPS Analysis by Type of Packaging, 2022 to 2032

Figure 86: Europe Market Y-o-Y Growth (%) Projections by Type of Packaging, 2022 to 2032

Figure 87: Europe Market Value (US$ Million) Analysis by Type of Delivery, 2017 to 2032

Figure 88: Europe Market Value Share (%) and BPS Analysis by Type of Delivery, 2022 to 2032

Figure 89: Europe Market Y-o-Y Growth (%) Projections by Type of Delivery, 2022 to 2032

Figure 90: Europe Market Value (US$ Million) Analysis by Indication, 2017 to 2032

Figure 91: Europe Market Value Share (%) and BPS Analysis by Indication, 2022 to 2032

Figure 92: Europe Market Y-o-Y Growth (%) Projections by Indication, 2022 to 2032

Figure 93: Europe Market Value (US$ Million) Analysis by End User, 2017 to 2032

Figure 94: Europe Market Value Share (%) and BPS Analysis by End User, 2022 to 2032

Figure 95: Europe Market Y-o-Y Growth (%) Projections by End User, 2022 to 2032

Figure 96: Europe Market Attractiveness by Type of Packaging, 2022 to 2032

Figure 97: Europe Market Attractiveness by Type of Delivery, 2022 to 2032

Figure 98: Europe Market Attractiveness by Indication, 2022 to 2032

Figure 99: Europe Market Attractiveness by End User, 2022 to 2032

Figure 100: Europe Market Attractiveness by Country, 2022 to 2032

Figure 101: Asia Pacific Market Value (US$ Million) by Type of Packaging, 2022 to 2032

Figure 102: Asia Pacific Market Value (US$ Million) by Type of Delivery, 2022 to 2032

Figure 103: Asia Pacific Market Value (US$ Million) by Indication, 2022 to 2032

Figure 104: Asia Pacific Market Value (US$ Million) by End User, 2022 to 2032

Figure 105: Asia Pacific Market Value (US$ Million) by Country, 2022 to 2032

Figure 106: Asia Pacific Market Value (US$ Million) Analysis by Country, 2017 to 2032

Figure 107: Asia Pacific Market Value Share (%) and BPS Analysis by Country, 2022 to 2032

Figure 108: Asia Pacific Market Y-o-Y Growth (%) Projections by Country, 2022 to 2032

Figure 109: Asia Pacific Market Value (US$ Million) Analysis by Type of Packaging, 2017 to 2032

Figure 110: Asia Pacific Market Value Share (%) and BPS Analysis by Type of Packaging, 2022 to 2032

Figure 111: Asia Pacific Market Y-o-Y Growth (%) Projections by Type of Packaging, 2022 to 2032

Figure 112: Asia Pacific Market Value (US$ Million) Analysis by Type of Delivery, 2017 to 2032

Figure 113: Asia Pacific Market Value Share (%) and BPS Analysis by Type of Delivery, 2022 to 2032

Figure 114: Asia Pacific Market Y-o-Y Growth (%) Projections by Type of Delivery, 2022 to 2032

Figure 115: Asia Pacific Market Value (US$ Million) Analysis by Indication, 2017 to 2032

Figure 116: Asia Pacific Market Value Share (%) and BPS Analysis by Indication, 2022 to 2032

Figure 117: Asia Pacific Market Y-o-Y Growth (%) Projections by Indication, 2022 to 2032

Figure 118: Asia Pacific Market Value (US$ Million) Analysis by End User, 2017 to 2032

Figure 119: Asia Pacific Market Value Share (%) and BPS Analysis by End User, 2022 to 2032

Figure 120: Asia Pacific Market Y-o-Y Growth (%) Projections by End User, 2022 to 2032

Figure 121: Asia Pacific Market Attractiveness by Type of Packaging, 2022 to 2032

Figure 122: Asia Pacific Market Attractiveness by Type of Delivery, 2022 to 2032

Figure 123: Asia Pacific Market Attractiveness by Indication, 2022 to 2032

Figure 124: Asia Pacific Market Attractiveness by End User, 2022 to 2032

Figure 125: Asia Pacific Market Attractiveness by Country, 2022 to 2032

Figure 126: MEA Market Value (US$ Million) by Type of Packaging, 2022 to 2032

Figure 127: MEA Market Value (US$ Million) by Type of Delivery, 2022 to 2032

Figure 128: MEA Market Value (US$ Million) by Indication, 2022 to 2032

Figure 129: MEA Market Value (US$ Million) by End User, 2022 to 2032

Figure 130: MEA Market Value (US$ Million) by Country, 2022 to 2032

Figure 131: MEA Market Value (US$ Million) Analysis by Country, 2017 to 2032

Figure 132: MEA Market Value Share (%) and BPS Analysis by Country, 2022 to 2032

Figure 133: MEA Market Y-o-Y Growth (%) Projections by Country, 2022 to 2032

Figure 134: MEA Market Value (US$ Million) Analysis by Type of Packaging, 2017 to 2032

Figure 135: MEA Market Value Share (%) and BPS Analysis by Type of Packaging, 2022 to 2032

Figure 136: MEA Market Y-o-Y Growth (%) Projections by Type of Packaging, 2022 to 2032

Figure 137: MEA Market Value (US$ Million) Analysis by Type of Delivery, 2017 to 2032

Figure 138: MEA Market Value Share (%) and BPS Analysis by Type of Delivery, 2022 to 2032

Figure 139: MEA Market Y-o-Y Growth (%) Projections by Type of Delivery, 2022 to 2032

Figure 140: MEA Market Value (US$ Million) Analysis by Indication, 2017 to 2032

Figure 141: MEA Market Value Share (%) and BPS Analysis by Indication, 2022 to 2032

Figure 142: MEA Market Y-o-Y Growth (%) Projections by Indication, 2022 to 2032

Figure 143: MEA Market Value (US$ Million) Analysis by End User, 2017 to 2032

Figure 144: MEA Market Value Share (%) and BPS Analysis by End User, 2022 to 2032

Figure 145: MEA Market Y-o-Y Growth (%) Projections by End User, 2022 to 2032

Figure 146: MEA Market Attractiveness by Type of Packaging, 2022 to 2032

Figure 147: MEA Market Attractiveness by Type of Delivery, 2022 to 2032

Figure 148: MEA Market Attractiveness by Indication, 2022 to 2032

Figure 149: MEA Market Attractiveness by End User, 2022 to 2032

Figure 150: MEA Market Attractiveness by Country, 2022 to 2032

Recommendations

Healthcare

Injectable Drug Delivery Market

Published : April 2024

Healthcare

Injection Pen Market

Published : February 2023

Explore Healthcare Insights

View Reports

Lyophilized Injectable Market