Intimate Wash Care Product Market Overview for 2024 to 2034

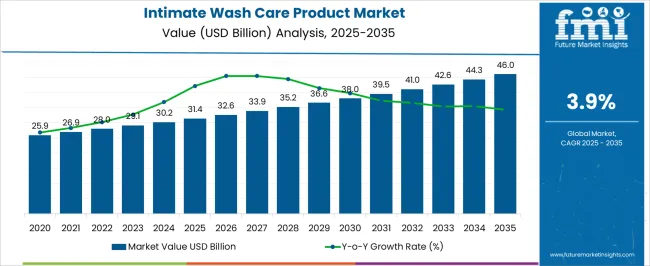
The intimate wash care product market has witnessed remarkable growth in recent years, reaching a market value of USD 30,213.80 million in 2024, surpassing the previous year's figures. This upward trend has been consistent over the last decade and is set to persist with a sluggish CAGR of 3.90%.

By 2034, the market is anticipated to reach a value of USD 44,355.00 million. Therefore, the future outlook for the market remains positive, with increasing consumer awareness about personal hygiene and health driving demand for these products.

Attributes Details
Intimate Wash Care Product Market Value for 2024 USD 30,213.80 million
Projected Market Value for 2034 USD 44,355.00 million
Value-based CAGR of Market for 2024 to 2034 3.90%

Intimate Wash Care Product Market Dynamics

  • The market is experiencing substantial growth due to growing consumer demand for organic and natural feminine hygiene products.
  • The anticipated increase in demand for intimate wash care products is owing to booming availability through eCommerce platforms, pharmacies, specialty outlets, and others across the global level.
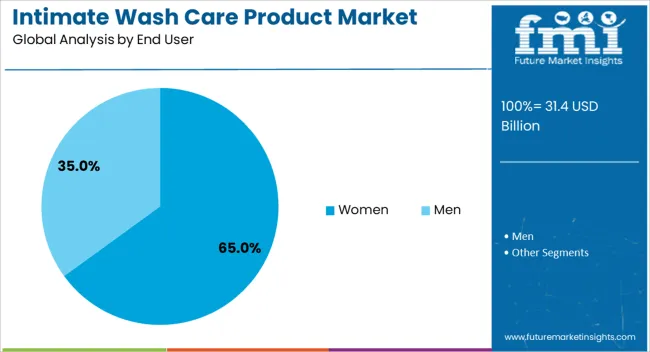
  • The surge in awareness is a major factor accelerating market growth, especially among female consumers in developing countries.
  • Government initiatives and local non-government organizations are increasing awareness among women about intimate wash care products, driving market growth.
  • The industry is collaborating to invest in formulating a variety of products, and the adoption of personal care hygiene accelerates market growth.

Category-wise Outlook

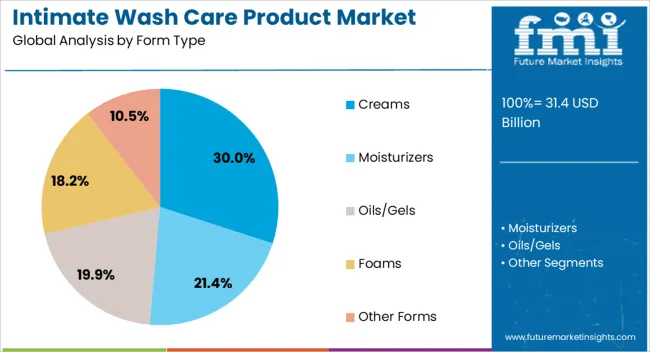
The gel-based product is the leading segment of the intimate wash care product market, offering various benefits. Conventional natural intimate care products are also driving market growth on the other hand.

Manufacturers Drive Market Growth with Gel-based Intimate Care Products

The gel-based product is projected to acquire a market share of 48.60% in 2024. Reasons influencing this segment’s growth are:

  • The variety of gel intimate wash care products is easily available in stores and online websites, and consumers are more likely to prefer and be impressed by gel products because of their exceptional benefits. The growing demand for gel intimate products upsurges the growth of the market.
  • Manufacturers are focusing on experimenting with gel-based intimate wash care products to gain consumer popularity among the new inventory of hygiene products, driving the growth rate of the market and helping to increase segment shares.
Attributes Details
Product Type Gel
Market Share (2024) 48.60%

Natural Intimate Wash Care Industry Expands amid Chemical Concerns

Conventional intimate wash care products are influencing the market's growth, holding a market share of 75.10% in 2024. Factors accounting for the growth of this segment are:

  • The natural intimate wash care product market is projected to continue growing as consumers become more educated about the potential risks associated with traditional chemical-based products. This growth presents opportunities for both established brands and new entrants to capitalize on the demand for natural alternatives.
  • The increased demand for natural conventional products in the market is characterized by growing consumer awareness and a focus on sustainability. Brands that meet regulatory standards are highly positioned to succeed in this segment and enhance market growth.
Attributes Details
Natural Conventional
Market Share (2024) 75.10%

Country-wise Analysis

The explosive upsurge in demand for intimate wash care products in multiple regions such as North America, Europe, and Asia Pacific can be attributed to several factors. The increasing awareness of personal hygiene and health is prompting individuals to seek specialized products for intimate care.

The rising development of gentler and safer intimate wash products is attracting consumers toward natural and organic ingredients, leading the market of personal hygiene. Increasing disposable income and urbanization contribute to the growing demand for such products, especially in emerging markets like Asia Pacific. Cultural factors and changing lifestyles also play a significant role in the market expansion across different regions.

Countries CAGR (2024 to 2034)
United State 3.00%
Germany 3.50%
China 6.30%
India 6.10%
Australia 5.20%

Health Concerns and Product Availability Drive the United States Intimate Wash Market

The forecasted CAGR for the United States intimate wash care product market is 3.00%, with various factors affecting its growth.

  • The growing availability of a wide range of products catering to different preferences and needs drives consumer choice, demonstrating the growth of the market.
  • The increased concern about hygiene health issues such as infection and irritation is fueling the market's growth.
  • The enhancement of disposable income allows the target audience to spend more on premium products.

Sustainable Wellness Trends Boost the Intimate Care Market Growth in Germany

The market in Germany is expected to see a CAGR of 3.50%, with various factors influencing this growth.

  • The emphasis on eco-friendly and sustainable ingredients in intimate care products aligns with consumer choices. The growing trend toward environmental protection is boosting market growth.
  • Strong distribution networks and access to premium products support market growth.
  • Increasing acceptance of intimate care as part of the overall wellness regimen fuels demand.

Urbanization and Western Influences Drive China’s Intimate Wash Market Growth

The market in China is expected to see 6.30% CAGR growth through 2034, influenced by various factors.

  • Rapid urbanization and changing lifestyles lead to increased focus on personal hygiene. With the influence of Western beauty standards and trends encouraging the adoption of intimate care products, growing sales are driven by market growth.
  • Rising availability of intimate wash care products online and offline helps facilitate easy access to a wide variety of products, contributing to market growth.

Cost-efficient Herbal Concepts Fuel Growth in India’s Intimate Wash Market

The market in India is expected to see a 6.10% CAGR from 2024 to 2034, with various factors influencing its growth.

  • India’s culture moving toward openness about intimate health issues is boosting the growth of the market.
  • The herbal concept has highly impacted India’s healthcare industry, promoting several varieties of products in different sectors and driving market growth.
  • Cost-effective and sustainable hygiene care product development has enhanced the growth rate of the market.

Premium Product Innovation Drives the Intimate Wash Market in Australia

The market in Australia is expected to see a CAGR of 5.20% during the forecast period, with various factors influencing its growth.
  • Preference for premium and high-quality products supports the expansion of the market. The influence of a multicultural population leads to demand for diverse product offerings. Growing innovation penetration provides a wide range of products, driving market growth.
  • Government organizations and manufacturers are concentrating on research and development to formulate safer and higher-standard products to gain consumer trust and satisfaction, driving market growth.

Competitive Landscape

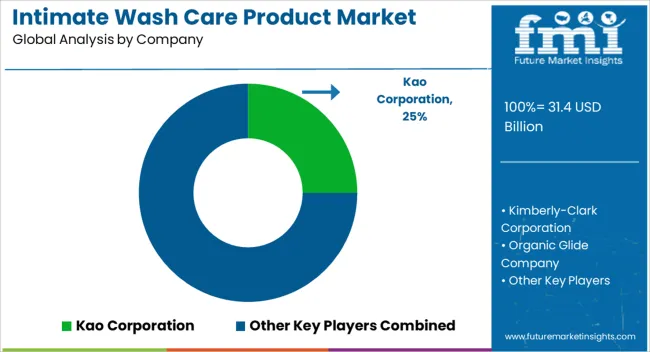
The intimate wash care product market is experiencing continuous and steady growth due to growing awareness about personal hygiene among both categories of consumers. The factors encouraging the growth of the market include rising disposable income, changing lifestyles, and growing concerns about intimate health, driving the market forward. The global move toward organic and natural products is leading to the introduction of innovation and premium offerings in the market.

Various market players are contributing to the growth of the market, and the names of the industries such as Procter & Gamble, Johnson & Johnson, The Himalaya Drug Company, Glenmark Pharmaceuticals, and Cipla are among the prominent players. These companies have established strong distribution networks, brand recognition, and diverse product portfolios, catering to various consumer needs and preferences. Additionally, new entrants and smaller players are entering the market with niche offerings, targeting specific segments such as organic, hypoallergenic, or fragrance-free products.

Recent developments among key players in the market showcase a focus on product innovation, expansion into new markets, and strategic partnerships.

  • Procter & Gamble introduced new formulations with enhanced benefits such as pH-balanced formulas and natural ingredients.
  • Johnson & Johnson expanded its product line to include variants targeting specific concerns such as sensitive skin or odor control.
  • The Himalaya Drug Company strengthened its presence in emerging markets through aggressive marketing campaigns and collaborations with local retailers.
  • Glenmark Pharmaceuticals and Cipla focused on leveraging their pharmaceutical expertise to develop intimate wash products with therapeutic properties, catering to consumers seeking medical-grade solutions for intimate health issues.

Recent Developments

  • In 2023, Ohhema Products, a Ghanaian brand, launched eco-friendly sanitary napkins in the United States, aiming to change period shaming and empower women with control over their menstrual health.
  • In 2023, Femi9, a company founded by actor Nayanthara, director Vignesh Shivan, and Dr. Gomathi, offered high-quality, ultra-thin daily wear pads for women, providing period protection.
  • In 2022, VinzBerry launched a range of intimate care and wellness products for women, attracting guests including actors, models, lifestyle bloggers, and celebrity stylists.

Key Companies

  • Kao Corporation
  • Kimberly-Clark Corporation
  • Organic Glide Company
  • The Honey Pot Company, LLC
  • Prestige Consumer Healthcare Company
  • Imbue
  • Glenmark Pharmaceuticals Company
  • Combe Incorporated
  • Lemisol Corporation
  • Skin Elements Company
  • WOW Freedom Company
  • The Himalaya Drug Company
  • Makhai
  • Sirona Hygiene Private Limited

Key Coverage in the Intimate Wash Care Product Market Report

  • Personal Care Industry Analysis
  • Market Segmentation of personal hygiene products
  • Industry Growth Factors for Intimate Wash Care Products
  • Market Share of Intimate Wash Care Product Manufacturers
  • Emerging Opportunities in the Intimate Wash Care Sector
  • Intimate Wash Care Products Demand Analysis

Key Segmentation

By Form Type:

  • Creams
  • Moisturizers
  • Oils/Gels
  • Foams
  • Other Forms

By Price Range:

  • Economy Products
  • Mid-Range Products
  • Premium Products

By End User:

  • Men
  • Women

By Nature:

  • Organic
  • Conventional

By Sales Channel:

  • Supermarkets/Hypermarkets
  • Pharmacies and Drug Stores
  • Specialty Outlets
  • Independent Small Stores
  • E-retailers
  • Other Sales Channels

By Region:

  • North America
  • Latin America
  • Europe
  • South Asia
  • East Asia
  • Oceania
  • Middle East and Africa (MEA)

Table of Content

  • 1. Executive Summary
  • 2. Market Overview
  • 3. Market Background
  • 4. Global Market Analysis 2019 to 2023 and Forecast, 2024 to 2034
  • 5. Global Market Analysis 2019 to 2023 and Forecast 2024 to 2034, By Form Type
    • 5.1. Creams
    • 5.2. Moisturizers
    • 5.3. Oils/Gels
    • 5.4. Foams
    • 5.5. Others
  • 6. Global Market Analysis 2019 to 2023 and Forecast 2024 to 2034, By Price Range
    • 6.1. Economic
    • 6.2. Mid-Range
    • 6.3. Premium
  • 7. Global Market Analysis 2019 to 2023 and Forecast 2024 to 2034, By End User
    • 7.1. Men
    • 7.2. Women
  • 8. Global Market Analysis 2019 to 2023 and Forecast 2024 to 2034, By Nature
    • 8.1. Organic
    • 8.2. Conventional
  • 9. Global Market Analysis 2019 to 2023 and Forecast 2024 to 2034, By Sales Channel
    • 9.1. Supermarkets/Hypermarkets
    • 9.2. Pharmacies and Drug Stores
    • 9.3. Specialty Outlets
    • 9.4. Independent Small Stores
    • 9.5. E-Retailers
    • 9.6. Others
  • 10. Global Market Analysis 2019 to 2023 and Forecast 2024 to 2034, By Region
    • 10.1. North America
    • 10.2. Latin America
    • 10.3. Western Europe
    • 10.4. Eastern Europe
    • 10.5. South Asia and Pacific
    • 10.6. East Asia
    • 10.7. Middle East and Africa
  • 11. North America Market Analysis 2019 to 2023 and Forecast 2024 to 2034, By Country
  • 12. Latin America Market Analysis 2019 to 2023 and Forecast 2024 to 2034, By Country
  • 13. Western Europe Market Analysis 2019 to 2023 and Forecast 2024 to 2034, By Country
  • 14. Eastern Europe Market Analysis 2019 to 2023 and Forecast 2024 to 2034, By Country
  • 15. South Asia and Pacific Market Analysis 2019 to 2023 and Forecast 2024 to 2034, By Country
  • 16. East Asia Market Analysis 2019 to 2023 and Forecast 2024 to 2034, By Country
  • 17. Middle East and Africa Market Analysis 2019 to 2023 and Forecast 2024 to 2034, By Country
  • 18. Key Countries Market Analysis
  • 19. Market Structure Analysis
  • 20. Competition Analysis
    • 20.1. Kao Corporation
    • 20.2. Kimberly-Clark Corporation
    • 20.3. Organic Glide Company
    • 20.4. The Honey Pot Company, LLC
    • 20.5. Prestige Consumer Healthcare Company
    • 20.6. Imbue
    • 20.7. Glenmark Pharmaceuticals Company
    • 20.8. Combe Incorporated
    • 20.9. Lemisol Corporation
    • 20.10. Skin Elements Company
    • 20.11. WOW Freedom Company
    • 20.12. The Himalaya Drug Company
    • 20.13. Makhai
    • 20.14. Sirona Hygiene Private Limited
  • 21. Assumptions & Acronyms Used
  • 22. Research Methodology

List of Tables

Table 1: Global Market Value (US$ Million) Forecast by Region, 2019 to 2034

Table 2: Global Market Volume (Units) Forecast by Region, 2019 to 2034

Table 3: Global Market Value (US$ Million) Forecast by Form Type, 2019 to 2034

Table 4: Global Market Volume (Units) Forecast by Form Type, 2019 to 2034

Table 5: Global Market Value (US$ Million) Forecast by Price Range, 2019 to 2034

Table 6: Global Market Volume (Units) Forecast by Price Range, 2019 to 2034

Table 7: Global Market Value (US$ Million) Forecast by End User, 2019 to 2034

Table 8: Global Market Volume (Units) Forecast by End User, 2019 to 2034

Table 9: Global Market Value (US$ Million) Forecast by Nature, 2019 to 2034

Table 10: Global Market Volume (Units) Forecast by Nature, 2019 to 2034

Table 11: Global Market Value (US$ Million) Forecast by Sales Channel, 2019 to 2034

Table 12: Global Market Volume (Units) Forecast by Sales Channel, 2019 to 2034

Table 13: North America Market Value (US$ Million) Forecast by Country, 2019 to 2034

Table 14: North America Market Volume (Units) Forecast by Country, 2019 to 2034

Table 15: North America Market Value (US$ Million) Forecast by Form Type, 2019 to 2034

Table 16: North America Market Volume (Units) Forecast by Form Type, 2019 to 2034

Table 17: North America Market Value (US$ Million) Forecast by Price Range, 2019 to 2034

Table 18: North America Market Volume (Units) Forecast by Price Range, 2019 to 2034

Table 19: North America Market Value (US$ Million) Forecast by End User, 2019 to 2034

Table 20: North America Market Volume (Units) Forecast by End User, 2019 to 2034

Table 21: North America Market Value (US$ Million) Forecast by Nature, 2019 to 2034

Table 22: North America Market Volume (Units) Forecast by Nature, 2019 to 2034

Table 23: North America Market Value (US$ Million) Forecast by Sales Channel, 2019 to 2034

Table 24: North America Market Volume (Units) Forecast by Sales Channel, 2019 to 2034

Table 25: Latin America Market Value (US$ Million) Forecast by Country, 2019 to 2034

Table 26: Latin America Market Volume (Units) Forecast by Country, 2019 to 2034

Table 27: Latin America Market Value (US$ Million) Forecast by Form Type, 2019 to 2034

Table 28: Latin America Market Volume (Units) Forecast by Form Type, 2019 to 2034

Table 29: Latin America Market Value (US$ Million) Forecast by Price Range, 2019 to 2034

Table 30: Latin America Market Volume (Units) Forecast by Price Range, 2019 to 2034

Table 31: Latin America Market Value (US$ Million) Forecast by End User, 2019 to 2034

Table 32: Latin America Market Volume (Units) Forecast by End User, 2019 to 2034

Table 33: Latin America Market Value (US$ Million) Forecast by Nature, 2019 to 2034

Table 34: Latin America Market Volume (Units) Forecast by Nature, 2019 to 2034

Table 35: Latin America Market Value (US$ Million) Forecast by Sales Channel, 2019 to 2034

Table 36: Latin America Market Volume (Units) Forecast by Sales Channel, 2019 to 2034

Table 37: Western Europe Market Value (US$ Million) Forecast by Country, 2019 to 2034

Table 38: Western Europe Market Volume (Units) Forecast by Country, 2019 to 2034

Table 39: Western Europe Market Value (US$ Million) Forecast by Form Type, 2019 to 2034

Table 40: Western Europe Market Volume (Units) Forecast by Form Type, 2019 to 2034

Table 41: Western Europe Market Value (US$ Million) Forecast by Price Range, 2019 to 2034

Table 42: Western Europe Market Volume (Units) Forecast by Price Range, 2019 to 2034

Table 43: Western Europe Market Value (US$ Million) Forecast by End User, 2019 to 2034

Table 44: Western Europe Market Volume (Units) Forecast by End User, 2019 to 2034

Table 45: Western Europe Market Value (US$ Million) Forecast by Nature, 2019 to 2034

Table 46: Western Europe Market Volume (Units) Forecast by Nature, 2019 to 2034

Table 47: Western Europe Market Value (US$ Million) Forecast by Sales Channel, 2019 to 2034

Table 48: Western Europe Market Volume (Units) Forecast by Sales Channel, 2019 to 2034

Table 49: Eastern Europe Market Value (US$ Million) Forecast by Country, 2019 to 2034

Table 50: Eastern Europe Market Volume (Units) Forecast by Country, 2019 to 2034

Table 51: Eastern Europe Market Value (US$ Million) Forecast by Form Type, 2019 to 2034

Table 52: Eastern Europe Market Volume (Units) Forecast by Form Type, 2019 to 2034

Table 53: Eastern Europe Market Value (US$ Million) Forecast by Price Range, 2019 to 2034

Table 54: Eastern Europe Market Volume (Units) Forecast by Price Range, 2019 to 2034

Table 55: Eastern Europe Market Value (US$ Million) Forecast by End User, 2019 to 2034

Table 56: Eastern Europe Market Volume (Units) Forecast by End User, 2019 to 2034

Table 57: Eastern Europe Market Value (US$ Million) Forecast by Nature, 2019 to 2034

Table 58: Eastern Europe Market Volume (Units) Forecast by Nature, 2019 to 2034

Table 59: Eastern Europe Market Value (US$ Million) Forecast by Sales Channel, 2019 to 2034

Table 60: Eastern Europe Market Volume (Units) Forecast by Sales Channel, 2019 to 2034

Table 61: South Asia and Pacific Market Value (US$ Million) Forecast by Country, 2019 to 2034

Table 62: South Asia and Pacific Market Volume (Units) Forecast by Country, 2019 to 2034

Table 63: South Asia and Pacific Market Value (US$ Million) Forecast by Form Type, 2019 to 2034

Table 64: South Asia and Pacific Market Volume (Units) Forecast by Form Type, 2019 to 2034

Table 65: South Asia and Pacific Market Value (US$ Million) Forecast by Price Range, 2019 to 2034

Table 66: South Asia and Pacific Market Volume (Units) Forecast by Price Range, 2019 to 2034

Table 67: South Asia and Pacific Market Value (US$ Million) Forecast by End User, 2019 to 2034

Table 68: South Asia and Pacific Market Volume (Units) Forecast by End User, 2019 to 2034

Table 69: South Asia and Pacific Market Value (US$ Million) Forecast by Nature, 2019 to 2034

Table 70: South Asia and Pacific Market Volume (Units) Forecast by Nature, 2019 to 2034

Table 71: South Asia and Pacific Market Value (US$ Million) Forecast by Sales Channel, 2019 to 2034

Table 72: South Asia and Pacific Market Volume (Units) Forecast by Sales Channel, 2019 to 2034

Table 73: East Asia Market Value (US$ Million) Forecast by Country, 2019 to 2034

Table 74: East Asia Market Volume (Units) Forecast by Country, 2019 to 2034

Table 75: East Asia Market Value (US$ Million) Forecast by Form Type, 2019 to 2034

Table 76: East Asia Market Volume (Units) Forecast by Form Type, 2019 to 2034

Table 77: East Asia Market Value (US$ Million) Forecast by Price Range, 2019 to 2034

Table 78: East Asia Market Volume (Units) Forecast by Price Range, 2019 to 2034

Table 79: East Asia Market Value (US$ Million) Forecast by End User, 2019 to 2034

Table 80: East Asia Market Volume (Units) Forecast by End User, 2019 to 2034

Table 81: East Asia Market Value (US$ Million) Forecast by Nature, 2019 to 2034

Table 82: East Asia Market Volume (Units) Forecast by Nature, 2019 to 2034

Table 83: East Asia Market Value (US$ Million) Forecast by Sales Channel, 2019 to 2034

Table 84: East Asia Market Volume (Units) Forecast by Sales Channel, 2019 to 2034

Table 85: Middle East and Africa Market Value (US$ Million) Forecast by Country, 2019 to 2034

Table 86: Middle East and Africa Market Volume (Units) Forecast by Country, 2019 to 2034

Table 87: Middle East and Africa Market Value (US$ Million) Forecast by Form Type, 2019 to 2034

Table 88: Middle East and Africa Market Volume (Units) Forecast by Form Type, 2019 to 2034

Table 89: Middle East and Africa Market Value (US$ Million) Forecast by Price Range, 2019 to 2034

Table 90: Middle East and Africa Market Volume (Units) Forecast by Price Range, 2019 to 2034

Table 91: Middle East and Africa Market Value (US$ Million) Forecast by End User, 2019 to 2034

Table 92: Middle East and Africa Market Volume (Units) Forecast by End User, 2019 to 2034

Table 93: Middle East and Africa Market Value (US$ Million) Forecast by Nature, 2019 to 2034

Table 94: Middle East and Africa Market Volume (Units) Forecast by Nature, 2019 to 2034

Table 95: Middle East and Africa Market Value (US$ Million) Forecast by Sales Channel, 2019 to 2034

Table 96: Middle East and Africa Market Volume (Units) Forecast by Sales Channel, 2019 to 2034

List of Figures

Figure 1: Global Market Value (US$ Million) by Form Type, 2024 to 2034

Figure 2: Global Market Value (US$ Million) by Price Range, 2024 to 2034

Figure 3: Global Market Value (US$ Million) by End User, 2024 to 2034

Figure 4: Global Market Value (US$ Million) by Nature, 2024 to 2034

Figure 5: Global Market Value (US$ Million) by Sales Channel, 2024 to 2034

Figure 6: Global Market Value (US$ Million) by Region, 2024 to 2034

Figure 7: Global Market Value (US$ Million) Analysis by Region, 2019 to 2034

Figure 8: Global Market Volume (Units) Analysis by Region, 2019 to 2034

Figure 9: Global Market Value Share (%) and BPS Analysis by Region, 2024 to 2034

Figure 10: Global Market Y-o-Y Growth (%) Projections by Region, 2024 to 2034

Figure 11: Global Market Value (US$ Million) Analysis by Form Type, 2019 to 2034

Figure 12: Global Market Volume (Units) Analysis by Form Type, 2019 to 2034

Figure 13: Global Market Value Share (%) and BPS Analysis by Form Type, 2024 to 2034

Figure 14: Global Market Y-o-Y Growth (%) Projections by Form Type, 2024 to 2034

Figure 15: Global Market Value (US$ Million) Analysis by Price Range, 2019 to 2034

Figure 16: Global Market Volume (Units) Analysis by Price Range, 2019 to 2034

Figure 17: Global Market Value Share (%) and BPS Analysis by Price Range, 2024 to 2034

Figure 18: Global Market Y-o-Y Growth (%) Projections by Price Range, 2024 to 2034

Figure 19: Global Market Value (US$ Million) Analysis by End User, 2019 to 2034

Figure 20: Global Market Volume (Units) Analysis by End User, 2019 to 2034

Figure 21: Global Market Value Share (%) and BPS Analysis by End User, 2024 to 2034

Figure 22: Global Market Y-o-Y Growth (%) Projections by End User, 2024 to 2034

Figure 23: Global Market Value (US$ Million) Analysis by Nature, 2019 to 2034

Figure 24: Global Market Volume (Units) Analysis by Nature, 2019 to 2034

Figure 25: Global Market Value Share (%) and BPS Analysis by Nature, 2024 to 2034

Figure 26: Global Market Y-o-Y Growth (%) Projections by Nature, 2024 to 2034

Figure 27: Global Market Value (US$ Million) Analysis by Sales Channel, 2019 to 2034

Figure 28: Global Market Volume (Units) Analysis by Sales Channel, 2019 to 2034

Figure 29: Global Market Value Share (%) and BPS Analysis by Sales Channel, 2024 to 2034

Figure 30: Global Market Y-o-Y Growth (%) Projections by Sales Channel, 2024 to 2034

Figure 31: Global Market Attractiveness by Form Type, 2024 to 2034

Figure 32: Global Market Attractiveness by Price Range, 2024 to 2034

Figure 33: Global Market Attractiveness by End User, 2024 to 2034

Figure 34: Global Market Attractiveness by Nature, 2024 to 2034

Figure 35: Global Market Attractiveness by Sales Channel, 2024 to 2034

Figure 36: Global Market Attractiveness by Region, 2024 to 2034

Figure 37: North America Market Value (US$ Million) by Form Type, 2024 to 2034

Figure 38: North America Market Value (US$ Million) by Price Range, 2024 to 2034

Figure 39: North America Market Value (US$ Million) by End User, 2024 to 2034

Figure 40: North America Market Value (US$ Million) by Nature, 2024 to 2034

Figure 41: North America Market Value (US$ Million) by Sales Channel, 2024 to 2034

Figure 42: North America Market Value (US$ Million) by Country, 2024 to 2034

Figure 43: North America Market Value (US$ Million) Analysis by Country, 2019 to 2034

Figure 44: North America Market Volume (Units) Analysis by Country, 2019 to 2034

Figure 45: North America Market Value Share (%) and BPS Analysis by Country, 2024 to 2034

Figure 46: North America Market Y-o-Y Growth (%) Projections by Country, 2024 to 2034

Figure 47: North America Market Value (US$ Million) Analysis by Form Type, 2019 to 2034

Figure 48: North America Market Volume (Units) Analysis by Form Type, 2019 to 2034

Figure 49: North America Market Value Share (%) and BPS Analysis by Form Type, 2024 to 2034

Figure 50: North America Market Y-o-Y Growth (%) Projections by Form Type, 2024 to 2034

Figure 51: North America Market Value (US$ Million) Analysis by Price Range, 2019 to 2034

Figure 52: North America Market Volume (Units) Analysis by Price Range, 2019 to 2034

Figure 53: North America Market Value Share (%) and BPS Analysis by Price Range, 2024 to 2034

Figure 54: North America Market Y-o-Y Growth (%) Projections by Price Range, 2024 to 2034

Figure 55: North America Market Value (US$ Million) Analysis by End User, 2019 to 2034

Figure 56: North America Market Volume (Units) Analysis by End User, 2019 to 2034

Figure 57: North America Market Value Share (%) and BPS Analysis by End User, 2024 to 2034

Figure 58: North America Market Y-o-Y Growth (%) Projections by End User, 2024 to 2034

Figure 59: North America Market Value (US$ Million) Analysis by Nature, 2019 to 2034

Figure 60: North America Market Volume (Units) Analysis by Nature, 2019 to 2034

Figure 61: North America Market Value Share (%) and BPS Analysis by Nature, 2024 to 2034

Figure 62: North America Market Y-o-Y Growth (%) Projections by Nature, 2024 to 2034

Figure 63: North America Market Value (US$ Million) Analysis by Sales Channel, 2019 to 2034

Figure 64: North America Market Volume (Units) Analysis by Sales Channel, 2019 to 2034

Figure 65: North America Market Value Share (%) and BPS Analysis by Sales Channel, 2024 to 2034

Figure 66: North America Market Y-o-Y Growth (%) Projections by Sales Channel, 2024 to 2034

Figure 67: North America Market Attractiveness by Form Type, 2024 to 2034

Figure 68: North America Market Attractiveness by Price Range, 2024 to 2034

Figure 69: North America Market Attractiveness by End User, 2024 to 2034

Figure 70: North America Market Attractiveness by Nature, 2024 to 2034

Figure 71: North America Market Attractiveness by Sales Channel, 2024 to 2034

Figure 72: North America Market Attractiveness by Country, 2024 to 2034

Figure 73: Latin America Market Value (US$ Million) by Form Type, 2024 to 2034

Figure 74: Latin America Market Value (US$ Million) by Price Range, 2024 to 2034

Figure 75: Latin America Market Value (US$ Million) by End User, 2024 to 2034

Figure 76: Latin America Market Value (US$ Million) by Nature, 2024 to 2034

Figure 77: Latin America Market Value (US$ Million) by Sales Channel, 2024 to 2034

Figure 78: Latin America Market Value (US$ Million) by Country, 2024 to 2034

Figure 79: Latin America Market Value (US$ Million) Analysis by Country, 2019 to 2034

Figure 80: Latin America Market Volume (Units) Analysis by Country, 2019 to 2034

Figure 81: Latin America Market Value Share (%) and BPS Analysis by Country, 2024 to 2034

Figure 82: Latin America Market Y-o-Y Growth (%) Projections by Country, 2024 to 2034

Figure 83: Latin America Market Value (US$ Million) Analysis by Form Type, 2019 to 2034

Figure 84: Latin America Market Volume (Units) Analysis by Form Type, 2019 to 2034

Figure 85: Latin America Market Value Share (%) and BPS Analysis by Form Type, 2024 to 2034

Figure 86: Latin America Market Y-o-Y Growth (%) Projections by Form Type, 2024 to 2034

Figure 87: Latin America Market Value (US$ Million) Analysis by Price Range, 2019 to 2034

Figure 88: Latin America Market Volume (Units) Analysis by Price Range, 2019 to 2034

Figure 89: Latin America Market Value Share (%) and BPS Analysis by Price Range, 2024 to 2034

Figure 90: Latin America Market Y-o-Y Growth (%) Projections by Price Range, 2024 to 2034

Figure 91: Latin America Market Value (US$ Million) Analysis by End User, 2019 to 2034

Figure 92: Latin America Market Volume (Units) Analysis by End User, 2019 to 2034

Figure 93: Latin America Market Value Share (%) and BPS Analysis by End User, 2024 to 2034

Figure 94: Latin America Market Y-o-Y Growth (%) Projections by End User, 2024 to 2034

Figure 95: Latin America Market Value (US$ Million) Analysis by Nature, 2019 to 2034

Figure 96: Latin America Market Volume (Units) Analysis by Nature, 2019 to 2034

Figure 97: Latin America Market Value Share (%) and BPS Analysis by Nature, 2024 to 2034

Figure 98: Latin America Market Y-o-Y Growth (%) Projections by Nature, 2024 to 2034

Figure 99: Latin America Market Value (US$ Million) Analysis by Sales Channel, 2019 to 2034

Figure 100: Latin America Market Volume (Units) Analysis by Sales Channel, 2019 to 2034

Figure 101: Latin America Market Value Share (%) and BPS Analysis by Sales Channel, 2024 to 2034

Figure 102: Latin America Market Y-o-Y Growth (%) Projections by Sales Channel, 2024 to 2034

Figure 103: Latin America Market Attractiveness by Form Type, 2024 to 2034

Figure 104: Latin America Market Attractiveness by Price Range, 2024 to 2034

Figure 105: Latin America Market Attractiveness by End User, 2024 to 2034

Figure 106: Latin America Market Attractiveness by Nature, 2024 to 2034

Figure 107: Latin America Market Attractiveness by Sales Channel, 2024 to 2034

Figure 108: Latin America Market Attractiveness by Country, 2024 to 2034

Figure 109: Western Europe Market Value (US$ Million) by Form Type, 2024 to 2034

Figure 110: Western Europe Market Value (US$ Million) by Price Range, 2024 to 2034

Figure 111: Western Europe Market Value (US$ Million) by End User, 2024 to 2034

Figure 112: Western Europe Market Value (US$ Million) by Nature, 2024 to 2034

Figure 113: Western Europe Market Value (US$ Million) by Sales Channel, 2024 to 2034

Figure 114: Western Europe Market Value (US$ Million) by Country, 2024 to 2034

Figure 115: Western Europe Market Value (US$ Million) Analysis by Country, 2019 to 2034

Figure 116: Western Europe Market Volume (Units) Analysis by Country, 2019 to 2034

Figure 117: Western Europe Market Value Share (%) and BPS Analysis by Country, 2024 to 2034

Figure 118: Western Europe Market Y-o-Y Growth (%) Projections by Country, 2024 to 2034

Figure 119: Western Europe Market Value (US$ Million) Analysis by Form Type, 2019 to 2034

Figure 120: Western Europe Market Volume (Units) Analysis by Form Type, 2019 to 2034

Figure 121: Western Europe Market Value Share (%) and BPS Analysis by Form Type, 2024 to 2034

Figure 122: Western Europe Market Y-o-Y Growth (%) Projections by Form Type, 2024 to 2034

Figure 123: Western Europe Market Value (US$ Million) Analysis by Price Range, 2019 to 2034

Figure 124: Western Europe Market Volume (Units) Analysis by Price Range, 2019 to 2034

Figure 125: Western Europe Market Value Share (%) and BPS Analysis by Price Range, 2024 to 2034

Figure 126: Western Europe Market Y-o-Y Growth (%) Projections by Price Range, 2024 to 2034

Figure 127: Western Europe Market Value (US$ Million) Analysis by End User, 2019 to 2034

Figure 128: Western Europe Market Volume (Units) Analysis by End User, 2019 to 2034

Figure 129: Western Europe Market Value Share (%) and BPS Analysis by End User, 2024 to 2034

Figure 130: Western Europe Market Y-o-Y Growth (%) Projections by End User, 2024 to 2034

Figure 131: Western Europe Market Value (US$ Million) Analysis by Nature, 2019 to 2034

Figure 132: Western Europe Market Volume (Units) Analysis by Nature, 2019 to 2034

Figure 133: Western Europe Market Value Share (%) and BPS Analysis by Nature, 2024 to 2034

Figure 134: Western Europe Market Y-o-Y Growth (%) Projections by Nature, 2024 to 2034

Figure 135: Western Europe Market Value (US$ Million) Analysis by Sales Channel, 2019 to 2034

Figure 136: Western Europe Market Volume (Units) Analysis by Sales Channel, 2019 to 2034

Figure 137: Western Europe Market Value Share (%) and BPS Analysis by Sales Channel, 2024 to 2034

Figure 138: Western Europe Market Y-o-Y Growth (%) Projections by Sales Channel, 2024 to 2034

Figure 139: Western Europe Market Attractiveness by Form Type, 2024 to 2034

Figure 140: Western Europe Market Attractiveness by Price Range, 2024 to 2034

Figure 141: Western Europe Market Attractiveness by End User, 2024 to 2034

Figure 142: Western Europe Market Attractiveness by Nature, 2024 to 2034

Figure 143: Western Europe Market Attractiveness by Sales Channel, 2024 to 2034

Figure 144: Western Europe Market Attractiveness by Country, 2024 to 2034

Figure 145: Eastern Europe Market Value (US$ Million) by Form Type, 2024 to 2034

Figure 146: Eastern Europe Market Value (US$ Million) by Price Range, 2024 to 2034

Figure 147: Eastern Europe Market Value (US$ Million) by End User, 2024 to 2034

Figure 148: Eastern Europe Market Value (US$ Million) by Nature, 2024 to 2034

Figure 149: Eastern Europe Market Value (US$ Million) by Sales Channel, 2024 to 2034

Figure 150: Eastern Europe Market Value (US$ Million) by Country, 2024 to 2034

Figure 151: Eastern Europe Market Value (US$ Million) Analysis by Country, 2019 to 2034

Figure 152: Eastern Europe Market Volume (Units) Analysis by Country, 2019 to 2034

Figure 153: Eastern Europe Market Value Share (%) and BPS Analysis by Country, 2024 to 2034

Figure 154: Eastern Europe Market Y-o-Y Growth (%) Projections by Country, 2024 to 2034

Figure 155: Eastern Europe Market Value (US$ Million) Analysis by Form Type, 2019 to 2034

Figure 156: Eastern Europe Market Volume (Units) Analysis by Form Type, 2019 to 2034

Figure 157: Eastern Europe Market Value Share (%) and BPS Analysis by Form Type, 2024 to 2034

Figure 158: Eastern Europe Market Y-o-Y Growth (%) Projections by Form Type, 2024 to 2034

Figure 159: Eastern Europe Market Value (US$ Million) Analysis by Price Range, 2019 to 2034

Figure 160: Eastern Europe Market Volume (Units) Analysis by Price Range, 2019 to 2034

Figure 161: Eastern Europe Market Value Share (%) and BPS Analysis by Price Range, 2024 to 2034

Figure 162: Eastern Europe Market Y-o-Y Growth (%) Projections by Price Range, 2024 to 2034

Figure 163: Eastern Europe Market Value (US$ Million) Analysis by End User, 2019 to 2034

Figure 164: Eastern Europe Market Volume (Units) Analysis by End User, 2019 to 2034

Figure 165: Eastern Europe Market Value Share (%) and BPS Analysis by End User, 2024 to 2034

Figure 166: Eastern Europe Market Y-o-Y Growth (%) Projections by End User, 2024 to 2034

Figure 167: Eastern Europe Market Value (US$ Million) Analysis by Nature, 2019 to 2034

Figure 168: Eastern Europe Market Volume (Units) Analysis by Nature, 2019 to 2034

Figure 169: Eastern Europe Market Value Share (%) and BPS Analysis by Nature, 2024 to 2034

Figure 170: Eastern Europe Market Y-o-Y Growth (%) Projections by Nature, 2024 to 2034

Figure 171: Eastern Europe Market Value (US$ Million) Analysis by Sales Channel, 2019 to 2034

Figure 172: Eastern Europe Market Volume (Units) Analysis by Sales Channel, 2019 to 2034

Figure 173: Eastern Europe Market Value Share (%) and BPS Analysis by Sales Channel, 2024 to 2034

Figure 174: Eastern Europe Market Y-o-Y Growth (%) Projections by Sales Channel, 2024 to 2034

Figure 175: Eastern Europe Market Attractiveness by Form Type, 2024 to 2034

Figure 176: Eastern Europe Market Attractiveness by Price Range, 2024 to 2034

Figure 177: Eastern Europe Market Attractiveness by End User, 2024 to 2034

Figure 178: Eastern Europe Market Attractiveness by Nature, 2024 to 2034

Figure 179: Eastern Europe Market Attractiveness by Sales Channel, 2024 to 2034

Figure 180: Eastern Europe Market Attractiveness by Country, 2024 to 2034

Figure 181: South Asia and Pacific Market Value (US$ Million) by Form Type, 2024 to 2034

Figure 182: South Asia and Pacific Market Value (US$ Million) by Price Range, 2024 to 2034

Figure 183: South Asia and Pacific Market Value (US$ Million) by End User, 2024 to 2034

Figure 184: South Asia and Pacific Market Value (US$ Million) by Nature, 2024 to 2034

Figure 185: South Asia and Pacific Market Value (US$ Million) by Sales Channel, 2024 to 2034

Figure 186: South Asia and Pacific Market Value (US$ Million) by Country, 2024 to 2034

Figure 187: South Asia and Pacific Market Value (US$ Million) Analysis by Country, 2019 to 2034

Figure 188: South Asia and Pacific Market Volume (Units) Analysis by Country, 2019 to 2034

Figure 189: South Asia and Pacific Market Value Share (%) and BPS Analysis by Country, 2024 to 2034

Figure 190: South Asia and Pacific Market Y-o-Y Growth (%) Projections by Country, 2024 to 2034

Figure 191: South Asia and Pacific Market Value (US$ Million) Analysis by Form Type, 2019 to 2034

Figure 192: South Asia and Pacific Market Volume (Units) Analysis by Form Type, 2019 to 2034

Figure 193: South Asia and Pacific Market Value Share (%) and BPS Analysis by Form Type, 2024 to 2034

Figure 194: South Asia and Pacific Market Y-o-Y Growth (%) Projections by Form Type, 2024 to 2034

Figure 195: South Asia and Pacific Market Value (US$ Million) Analysis by Price Range, 2019 to 2034

Figure 196: South Asia and Pacific Market Volume (Units) Analysis by Price Range, 2019 to 2034

Figure 197: South Asia and Pacific Market Value Share (%) and BPS Analysis by Price Range, 2024 to 2034

Figure 198: South Asia and Pacific Market Y-o-Y Growth (%) Projections by Price Range, 2024 to 2034

Figure 199: South Asia and Pacific Market Value (US$ Million) Analysis by End User, 2019 to 2034

Figure 200: South Asia and Pacific Market Volume (Units) Analysis by End User, 2019 to 2034

Figure 201: South Asia and Pacific Market Value Share (%) and BPS Analysis by End User, 2024 to 2034

Figure 202: South Asia and Pacific Market Y-o-Y Growth (%) Projections by End User, 2024 to 2034

Figure 203: South Asia and Pacific Market Value (US$ Million) Analysis by Nature, 2019 to 2034

Figure 204: South Asia and Pacific Market Volume (Units) Analysis by Nature, 2019 to 2034

Figure 205: South Asia and Pacific Market Value Share (%) and BPS Analysis by Nature, 2024 to 2034

Figure 206: South Asia and Pacific Market Y-o-Y Growth (%) Projections by Nature, 2024 to 2034

Figure 207: South Asia and Pacific Market Value (US$ Million) Analysis by Sales Channel, 2019 to 2034

Figure 208: South Asia and Pacific Market Volume (Units) Analysis by Sales Channel, 2019 to 2034

Figure 209: South Asia and Pacific Market Value Share (%) and BPS Analysis by Sales Channel, 2024 to 2034

Figure 210: South Asia and Pacific Market Y-o-Y Growth (%) Projections by Sales Channel, 2024 to 2034

Figure 211: South Asia and Pacific Market Attractiveness by Form Type, 2024 to 2034

Figure 212: South Asia and Pacific Market Attractiveness by Price Range, 2024 to 2034

Figure 213: South Asia and Pacific Market Attractiveness by End User, 2024 to 2034

Figure 214: South Asia and Pacific Market Attractiveness by Nature, 2024 to 2034

Figure 215: South Asia and Pacific Market Attractiveness by Sales Channel, 2024 to 2034

Figure 216: South Asia and Pacific Market Attractiveness by Country, 2024 to 2034

Figure 217: East Asia Market Value (US$ Million) by Form Type, 2024 to 2034

Figure 218: East Asia Market Value (US$ Million) by Price Range, 2024 to 2034

Figure 219: East Asia Market Value (US$ Million) by End User, 2024 to 2034

Figure 220: East Asia Market Value (US$ Million) by Nature, 2024 to 2034

Figure 221: East Asia Market Value (US$ Million) by Sales Channel, 2024 to 2034

Figure 222: East Asia Market Value (US$ Million) by Country, 2024 to 2034

Figure 223: East Asia Market Value (US$ Million) Analysis by Country, 2019 to 2034

Figure 224: East Asia Market Volume (Units) Analysis by Country, 2019 to 2034

Figure 225: East Asia Market Value Share (%) and BPS Analysis by Country, 2024 to 2034

Figure 226: East Asia Market Y-o-Y Growth (%) Projections by Country, 2024 to 2034

Figure 227: East Asia Market Value (US$ Million) Analysis by Form Type, 2019 to 2034

Figure 228: East Asia Market Volume (Units) Analysis by Form Type, 2019 to 2034

Figure 229: East Asia Market Value Share (%) and BPS Analysis by Form Type, 2024 to 2034

Figure 230: East Asia Market Y-o-Y Growth (%) Projections by Form Type, 2024 to 2034

Figure 231: East Asia Market Value (US$ Million) Analysis by Price Range, 2019 to 2034

Figure 232: East Asia Market Volume (Units) Analysis by Price Range, 2019 to 2034

Figure 233: East Asia Market Value Share (%) and BPS Analysis by Price Range, 2024 to 2034

Figure 234: East Asia Market Y-o-Y Growth (%) Projections by Price Range, 2024 to 2034

Figure 235: East Asia Market Value (US$ Million) Analysis by End User, 2019 to 2034

Figure 236: East Asia Market Volume (Units) Analysis by End User, 2019 to 2034

Figure 237: East Asia Market Value Share (%) and BPS Analysis by End User, 2024 to 2034

Figure 238: East Asia Market Y-o-Y Growth (%) Projections by End User, 2024 to 2034

Figure 239: East Asia Market Value (US$ Million) Analysis by Nature, 2019 to 2034

Figure 240: East Asia Market Volume (Units) Analysis by Nature, 2019 to 2034

Figure 241: East Asia Market Value Share (%) and BPS Analysis by Nature, 2024 to 2034

Figure 242: East Asia Market Y-o-Y Growth (%) Projections by Nature, 2024 to 2034

Figure 243: East Asia Market Value (US$ Million) Analysis by Sales Channel, 2019 to 2034

Figure 244: East Asia Market Volume (Units) Analysis by Sales Channel, 2019 to 2034

Figure 245: East Asia Market Value Share (%) and BPS Analysis by Sales Channel, 2024 to 2034

Figure 246: East Asia Market Y-o-Y Growth (%) Projections by Sales Channel, 2024 to 2034

Figure 247: East Asia Market Attractiveness by Form Type, 2024 to 2034

Figure 248: East Asia Market Attractiveness by Price Range, 2024 to 2034

Figure 249: East Asia Market Attractiveness by End User, 2024 to 2034

Figure 250: East Asia Market Attractiveness by Nature, 2024 to 2034

Figure 251: East Asia Market Attractiveness by Sales Channel, 2024 to 2034

Figure 252: East Asia Market Attractiveness by Country, 2024 to 2034

Figure 253: Middle East and Africa Market Value (US$ Million) by Form Type, 2024 to 2034

Figure 254: Middle East and Africa Market Value (US$ Million) by Price Range, 2024 to 2034

Figure 255: Middle East and Africa Market Value (US$ Million) by End User, 2024 to 2034

Figure 256: Middle East and Africa Market Value (US$ Million) by Nature, 2024 to 2034

Figure 257: Middle East and Africa Market Value (US$ Million) by Sales Channel, 2024 to 2034

Figure 258: Middle East and Africa Market Value (US$ Million) by Country, 2024 to 2034

Figure 259: Middle East and Africa Market Value (US$ Million) Analysis by Country, 2019 to 2034

Figure 260: Middle East and Africa Market Volume (Units) Analysis by Country, 2019 to 2034

Figure 261: Middle East and Africa Market Value Share (%) and BPS Analysis by Country, 2024 to 2034

Figure 262: Middle East and Africa Market Y-o-Y Growth (%) Projections by Country, 2024 to 2034

Figure 263: Middle East and Africa Market Value (US$ Million) Analysis by Form Type, 2019 to 2034

Figure 264: Middle East and Africa Market Volume (Units) Analysis by Form Type, 2019 to 2034

Figure 265: Middle East and Africa Market Value Share (%) and BPS Analysis by Form Type, 2024 to 2034

Figure 266: Middle East and Africa Market Y-o-Y Growth (%) Projections by Form Type, 2024 to 2034

Figure 267: Middle East and Africa Market Value (US$ Million) Analysis by Price Range, 2019 to 2034

Figure 268: Middle East and Africa Market Volume (Units) Analysis by Price Range, 2019 to 2034

Figure 269: Middle East and Africa Market Value Share (%) and BPS Analysis by Price Range, 2024 to 2034

Figure 270: Middle East and Africa Market Y-o-Y Growth (%) Projections by Price Range, 2024 to 2034

Figure 271: Middle East and Africa Market Value (US$ Million) Analysis by End User, 2019 to 2034

Figure 272: Middle East and Africa Market Volume (Units) Analysis by End User, 2019 to 2034

Figure 273: Middle East and Africa Market Value Share (%) and BPS Analysis by End User, 2024 to 2034

Figure 274: Middle East and Africa Market Y-o-Y Growth (%) Projections by End User, 2024 to 2034

Figure 275: Middle East and Africa Market Value (US$ Million) Analysis by Nature, 2019 to 2034

Figure 276: Middle East and Africa Market Volume (Units) Analysis by Nature, 2019 to 2034

Figure 277: Middle East and Africa Market Value Share (%) and BPS Analysis by Nature, 2024 to 2034

Figure 278: Middle East and Africa Market Y-o-Y Growth (%) Projections by Nature, 2024 to 2034

Figure 279: Middle East and Africa Market Value (US$ Million) Analysis by Sales Channel, 2019 to 2034

Figure 280: Middle East and Africa Market Volume (Units) Analysis by Sales Channel, 2019 to 2034

Figure 281: Middle East and Africa Market Value Share (%) and BPS Analysis by Sales Channel, 2024 to 2034

Figure 282: Middle East and Africa Market Y-o-Y Growth (%) Projections by Sales Channel, 2024 to 2034

Figure 283: Middle East and Africa Market Attractiveness by Form Type, 2024 to 2034

Figure 284: Middle East and Africa Market Attractiveness by Price Range, 2024 to 2034

Figure 285: Middle East and Africa Market Attractiveness by End User, 2024 to 2034

Figure 286: Middle East and Africa Market Attractiveness by Nature, 2024 to 2034

Figure 287: Middle East and Africa Market Attractiveness by Sales Channel, 2024 to 2034

Figure 288: Middle East and Africa Market Attractiveness by Country, 2024 to 2034

Frequently Asked Questions

What is the Current Intimate Wash Care Product Market Size?

The market size is estimated to be USD 30,213.80 million in 2024.

What is the Projected Growth Rate for the Intimate Wash Care Product Market?

The market is expected to increase at a CAGR of 3.90% over the forecast period.

How is the Intimate Wash Care Product Industry in India?

The market is expected to register a CAGR of 6.10% in India from 2024 to 2034.

What will the Future Performance of the Intimate Wash Care Product Market be?

The market is forecasted to reach a size of USD 44,355.00 million by 2034.

Who are the Key Companies in the Market?

Kao Corporation, Kimberly-Clark Corporation, Organic Glide Company, the Honey Pot Company, LLC, Prestige Consumer Healthcare Company, and others.

What is the Top Type of Intimate Wash Care Products?

Intimate wash care products in gel form are mostly preferred.

Explore Similar Insights

Future Market Insights

Intimate Wash Care Product Market