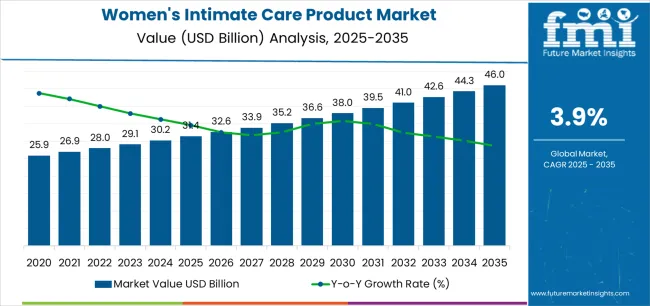
The Women's Intimate Care Product market is witnessing significant growth, driven by the increasing awareness regarding feminine hygiene and personal care among women across age groups. The future outlook of this market is influenced by the growing preference for specialized and gentle formulations that cater to daily hygiene needs. Rising consumer focus on health and wellness, combined with the increasing availability of natural and dermatologically tested products, is supporting the expansion of this market.
Urbanization, higher disposable incomes, and increased media awareness campaigns have further strengthened consumer adoption, particularly in emerging regions. Additionally, the trend toward self-care and personal grooming has fueled demand for products that are convenient, safe, and effective for daily use.
The growing focus on preventing infections and maintaining intimate hygiene, coupled with the influence of e-commerce platforms in improving product accessibility, is expected to propel market growth As consumer education and product innovation continue to evolve, the Women's Intimate Care Product market is projected to sustain robust growth in both developed and emerging markets.

| Metric | Value |
|---|---|
| Women's Intimate Care Product Market Estimated Value in (2025 E) | USD 31.4 billion |
| Women's Intimate Care Product Market Forecast Value in (2035 F) | USD 46.0 billion |
| Forecast CAGR (2025 to 2035) | 3.9% |
The market is segmented by Product Type, Age Group, User, and Sales Channel and region. By Product Type, the market is divided into Intimate Washes, Liners, Oils, Masks, Moisturizers & Cream, Hair Removal, Wipes, Gels, Foams, Exfoliants, Mousses, Mists, Sprays, E products, and Others. In terms of Age Group, the market is classified into 26-40 Years, 12-19 Years, 20-25 Years, 41-50 Years, and 51 And Above. Based on User, the market is segmented into Women With Children and Women Without Children. By Sales Channel, the market is divided into Online and Offline. Regionally, the market is classified into North America, Latin America, Western Europe, Eastern Europe, Balkan & Baltic Countries, Russia & Belarus, Central Asia, East Asia, South Asia & Pacific, and the Middle East & Africa.

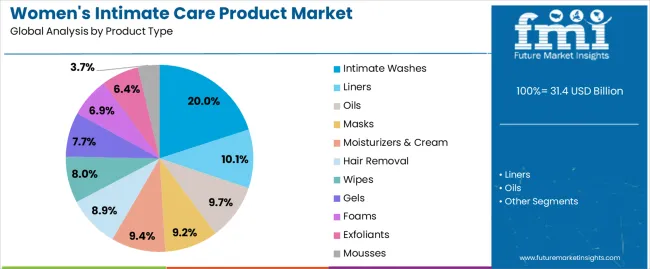
The intimate washes product type segment is projected to hold 20.00% of the market revenue share in 2025, making it a key product category. The growth of this segment is attributed to the increasing consumer preference for daily hygiene solutions that are gentle, pH-balanced, and safe for sensitive areas.
Intimate washes are perceived as essential in maintaining hygiene and preventing infections, which has driven adoption among health-conscious consumers. The availability of a variety of formulations that cater to specific skin needs and preferences has further enhanced the appeal of this segment.
The rise in e-commerce penetration has also made these products more accessible, encouraging frequent purchases and repeat usage Moreover, growing awareness campaigns and social media influence have educated women about the importance of intimate hygiene, reinforcing the dominance of the intimate washes segment in the overall market.
The 26-40 years age group segment is expected to account for 45.00% of the market revenue share in 2025, making it the leading consumer age group. This growth is driven by the heightened awareness of intimate care among women in this age range, who are typically more health-conscious and willing to invest in personal care products.
Women in this demographic are increasingly seeking products that combine safety, effectiveness, and convenience, reflecting their busy lifestyles. Rising disposable incomes and greater exposure to health and wellness education have further encouraged the adoption of intimate care products.
Additionally, this age group often experiences changes related to hormonal fluctuations, maternity, and lifestyle factors that increase the focus on maintaining personal hygiene The combined influence of health awareness, purchasing power, and lifestyle-driven needs has solidified the 26-40 years age group as the leading segment in the market.

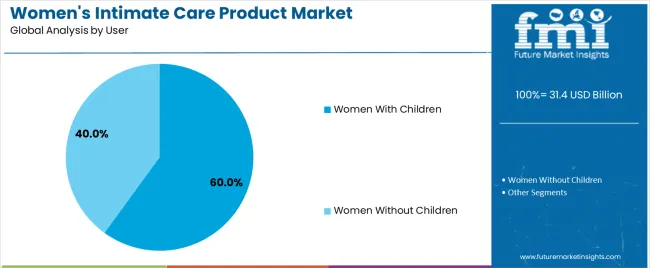
The women with children user segment is anticipated to hold 60.00% of the market revenue share in 2025, establishing it as the dominant consumer category. The growth of this segment is primarily influenced by the increased emphasis on hygiene and personal care during and after pregnancy. Women with children often prioritize products that are safe, gentle, and suitable for postnatal care, which has strengthened the adoption of specialized intimate care products.
Educational campaigns highlighting the importance of maintaining intimate hygiene during childbearing years have further propelled product usage. Convenience, effectiveness, and trust in formulations tailored for sensitive needs have made these products a preferred choice among mothers.
Additionally, word-of-mouth recommendations and increased social awareness have reinforced consumer confidence in the segment As the importance of maternal health and hygiene continues to gain attention, women with children are expected to remain the largest and most influential user group in the intimate care market.
Lack of proper hygiene during intercourse exposes the body to infections since germs thrive well in such an environment. Proper hygiene and cleanliness are essential in maintaining the health of the body and the mind.
Intimate care washes, wipes, and lotions help in restoring the pH balance of the vagina, reducing the itch and bacterial formation, and promote the growth of good bacteria like lactobacillus.
The market of intimate care products is expanding globally because of awareness among the populace and the high demand for sanitary products. People are getting involved in a progressive discussion about periods, women’s sanitary products, and women’s health on social media and it is adding a positive value to the users’ lives.
Further, the increasing incidence of intimate hygiene programs, product premiumization, consumer disposable income, and urbanization are some of the significant factors that are fuelling the growth of the women’s intimate care products market.
Promotion of Intimate Care Solutions by Women Celebs
Rising consumer awareness of the women's intimate care solutions offered by market players has influenced female customers to prioritize genital cleanliness, contributing to the expansion of the women's intimate care products market.
Increased use of intimate wash solutions among sportswomen, rising public awareness of these products, and several celebrities promoting personal care products on social media are major factors driving the sales of intimate care products for women. The growing number of employed women has given them the financial means to spend more on personal hygiene solutions.
Early Age Puberty & Government Initiatives for Women’s Health Awareness Boosting Women’s Hygiene Care Solution Demand
As the average age of early puberty decreases, the requirement for intimate hygiene products also declines. Recent researches indicate that the average age of puberty for girls has reduced from 13 years to 11 years, as presented by the National Health Service (NHS).
The main causes of early puberty in girls are poor nutrition, excessive weight, and stress. In addition, due to poor genital cleanliness, reproductive tract infections are on the rise among adolescents. Therefore, these factors are expected to foster the women’s intimate care solutions market.
Cambodia, Afghanistan, India, and China, are some of the emerging countries, that have inadequate sanitary facilities and sanitation systems. In the rural areas, respective governments are endeavouring to increase awareness of female hygiene products like intimate wash among women.
Also, awareness programs related to health and hygiene are being conducted in schools, offices, and colleges, has a positive impact on the sales of women’s intimate care products.
High Demand for Organic-based Feminine Intimate Care Solutions
Consumer demand for organic ingredients is surging as people become more aware of the dangers of chemicals used in women's hygiene products. As a result of this increased awareness, manufacturers are creating new and creative solutions of higher quality and comfort. Different product types are being introduced by companies for diverse applications.
Organic and natural women's intimate care products, such as intimate wipes, are high in demand. Pesticides, synthetic fibres, chemical additives, colours, scents, and chlorine bleach are all absent from these products, which are made from non-genetically modified (non-GMO) certified organic components.
Lack of Awareness & Cultural Taboo Regarding Menstrual Hygiene Stunting Women's Intimate Care Product Demand
Vaginal hygiene and menstrual hygiene have a social component, and this harms the sales of feminine hygiene solutions in certain regions of the world. In rural and undeveloped areas, a lack of information and understanding about feminine hygiene and care is a key stumbling block to the industry's full potential.
In addition, social discrimination, gender inequality, social stigmas regarding menstruation, and the complete eradication of contemporary feminine hygiene products in various undeveloped and undereducated regions, are some of the primary issues that hinder women's intimate care products market growth.
Asia Pacific Market Expanding Rapidly Due to Rising Disposable Income & Acceptance for Feminine Hygiene & Care Solutions
The women's intimate care products market in Asia Pacific dominated the global landscape in terms of value. Factors such as rising per capita spending power and increased awareness of feminine hygiene and care are expected to fuel growth in this regional market. China's market is predicted to grow at the quickest rate.
Demand for feminine hygiene products is already saturated in North America and Europe, and growth in these regional markets is likely to be consistent. North American and European sales of feminine hygiene products are projected to continue to contribute heavily to worldwide revenue.
Demand for women's intimate care products in the MEA region is predicted to develop steadily, although the cultural taboo associated with menstrual and feminine hygiene could limit the market growth.
| Market Statistics | Details |
|---|---|
| Jan to Jun (H1), 2025 (A) | 3.8% |
| Jul to Dec (H2), 2025 (A) | 3.9% |
| Jan to Jun (H1), 2025 Projected (P) | 3.8% |
| Jan to Jun (H1), 2025 Outlook (O) | 4.2% |
| Jul to Dec (H2), 2025 Outlook (O) | 4.5% |
| Jul to Dec (H2), 2025 Projected (P) | 3.9% |
| Jan to Jun (H1), 2025 Projected (P) | 4.3% |
| BPS Change: H1, 2025 (O) to H1, 2025 (P) | (+) 38 |
| BPS Change: H1, 2025 (O) to H1, 2025 (A) | (+) 42 |
| BPS Change: H2, 2025 (O) to H2, 2025 (P) | (+) 41 |
| BPS Change: H2, 2025 (O) to H2, 2025 (P) | (-) 45 |
| Country | USA |
|---|---|
| Market Share (2025) | 80.5% |
| Market Share (2035) | 83.0% |
| BPS Analysis | (+) 238 |
| Country | China |
|---|---|
| Market Share (2025) | 48.2% |
| Market Share (2035) | 51.2% |
| BPS Analysis | (+) 310 |
| Country | Mexico |
|---|---|
| Market Share (2025) | 23.9% |
| Market Share (2035) | 23.4% |
| BPS Analysis | (-) 41 |
Rapidly Rising Awareness about Women's Hygiene in India
India's large population makes it a profitable market for women's intimate care products, and the country has seen a significant improvement in personal hygiene awareness. This is boosting demand for various personal care hygiene products.
Over the next 10 years, demand for feminine hygiene solutions is predicted to grow significantly as awareness rises, women's empowerment increases exponentially, urbanization keeps growing, and disposable income rises across the country.
China Market Expanding on Back of Rising Population & Increasing Literacy Rate of Women
In China, the women's intimate care products market is projected to expand significantly over the forecast period. The country has a large population, hence a potential market for all personal care solution manufacturers. The demand for women's hygiene products is rising in China and is expected to further boost the potential of the Chinese market.
Such factors as increasing female literacy, a growing female population, and rising income levels are the primary parameters pushing up sales of women's intimate care products in China
Hair Removal Most Popular Women's Intimate Care Product Type
The women's hygiene sector offers a vast range of products, and producers are always researching and creating novel products to increase sales and revenue possibilities. Menstrual hygiene and vaginal hygiene care solutions are the most popular items in the market.
Due to increased consumer knowledge about environmental conservation, demand for efficient and eco-friendly women's intimate hygiene products is predicted to grow significantly over the forecast period. Most intimate care products would have more natural and biodegradable components that would benefit rather than hurt the environment.
For instance, many companies offer natural hair remover wax powder which removes unwanted hair instantly and painlessly.
In addition, intimate washes and cleansers, among other vaginal hygiene products, are becoming more popular as the incidence of vaginal infections, UTIs, and allergic reactions rises. Some of the most popular feminine intimate hygiene items include sanitary pads/napkins, gels, and others, which are leading the sector in terms of sales.
In 2025, depilatories and gels accounted for 60.4% and 48.3% of the global market share, respectively. Razors and exfoliants at present are likely to hold 29.8% & 7.5% of the global market share respectively. Due to increased consumer knowledge about environmental conservation, demand for efficient and eco-friendly women's intimate hygiene products is predicted to grow significantly over the forecast period.
Most intimate care products would have more natural and biodegradable components that would benefit rather than hurt the environment.
Manufacturers of intimate wipes and cleansers, for example, would have to lower their chemical footprint by using chemicals that are more natural. Currently, moisturizers & creams, wipes, foams, mousses, mists, sprays, and e-products together are likely to account for 26.6% of the global market share.

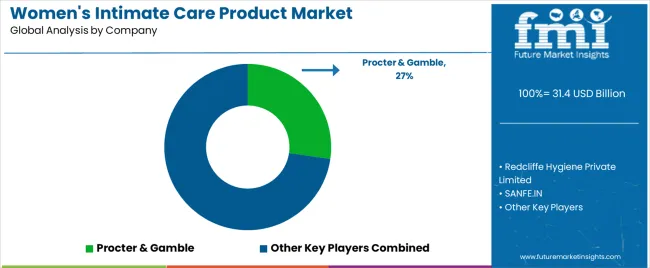
Several established companies dominate the global women's intimate care industry, accounting for a significant part of the market. The majority of leading players in the market continue to place a strategic emphasis on product innovation, quality products, organic and natural product launches, and the expansion of rural sales channels.
Key companies in the women's intimate care landscape are focusing on R&D, technological development, collaborations, partnerships, and organic certifications to keep up with the rise in demand for naturally sourced raw materials in women's intimate care products in countries like the United States, Japan, India, China, Germany, Italy, France, and the United Kingdom.
| Report Attributes | Details |
|---|---|
| Current Total Market Size (2025) | USD 31.4 billion |
| Projected Market Size (2035) | USD 46.0 billion |
| Overall Market CAGR (2025 to 2035) | 3.9% |
| Base Year for Estimation | 2025 |
| Historical Period | 2020 to 2025 |
| Projections Period | 2025 to 2035 |
| Analysis Parameter | Revenue in USD billion/Volume in Units |
| By Product Types | Intimate Washes, Liners, Oils, Masks, Moisturizers & Cream, Hair Removal, Gels, Foams, Exfoliants, Mousses, Mists, Sprays, E Products, And Others |
| By Age Group | 12-19 Years, 20-25 Years, 26-40 Years, 41-50 Years, And 51 And Above |
| By User | Women with Children and Women without Children |
| By Sales Channel | Online and Offline |
| By Regions | North America, Latin America, Europe, Asia Pacific, and the Middle East & Africa |
| Countries Covered | United States, Japan, Germany, India, United Kingdom, France, Italy, Brazil, Canada, South Korea, Australia, Spain, Netherlands, Saudi Arabia, Switzerland |
| Key Players | Redcliffe Hygiene Private Limited, SANFE.IN, Joylux Inc., Hindustan Unilever Limited, Procter & Gamble, Johnson & Johnson, QUEEN V, ALYK, Bodyform, and KCWW. |
| Additional Attributes | Technological Advancements, Regulatory Compliance, Market Dynamics, Product Segment Share, Country-wise Analysis, Company Shares |
| Customization and Pricing | Available upon request |
The global women's intimate care product market is estimated to be valued at USD 31.4 billion in 2025.
The market size for the women's intimate care product market is projected to reach USD 46.0 billion by 2035.
The women's intimate care product market is expected to grow at a 3.9% CAGR between 2025 and 2035.
The key product types in women's intimate care product market are intimate washes, liners, oils, masks, moisturizers & cream, hair removal, razors, wax, depilatories, wipes, gels, foams, exfoliants, mousses, mists, sprays, e products and others.
In terms of age group, 26-40 years segment to command 45.0% share in the women's intimate care product market in 2025.


Our Research Products

The "Full Research Suite" delivers actionable market intel, deep dives on markets or technologies, so clients act faster, cut risk, and unlock growth.

The Leaderboard benchmarks and ranks top vendors, classifying them as Established Leaders, Leading Challengers, or Disruptors & Challengers.

Locates where complements amplify value and substitutes erode it, forecasting net impact by horizon

We deliver granular, decision-grade intel: market sizing, 5-year forecasts, pricing, adoption, usage, revenue, and operational KPIs—plus competitor tracking, regulation, and value chains—across 60 countries broadly.

Spot the shifts before they hit your P&L. We track inflection points, adoption curves, pricing moves, and ecosystem plays to show where demand is heading, why it is changing, and what to do next across high-growth markets and disruptive tech

Real-time reads of user behavior. We track shifting priorities, perceptions of today’s and next-gen services, and provider experience, then pace how fast tech moves from trial to adoption, blending buyer, consumer, and channel inputs with social signals (#WhySwitch, #UX).

Partner with our analyst team to build a custom report designed around your business priorities. From analysing market trends to assessing competitors or crafting bespoke datasets, we tailor insights to your needs.
Supplier Intelligence
Discovery & Profiling
Capacity & Footprint
Performance & Risk
Compliance & Governance
Commercial Readiness
Who Supplies Whom
Scorecards & Shortlists
Playbooks & Docs
Category Intelligence
Definition & Scope
Demand & Use Cases
Cost Drivers
Market Structure
Supply Chain Map
Trade & Policy
Operating Norms
Deliverables
Buyer Intelligence
Account Basics
Spend & Scope
Procurement Model
Vendor Requirements
Terms & Policies
Entry Strategy
Pain Points & Triggers
Outputs
Pricing Analysis
Benchmarks
Trends
Should-Cost
Indexation
Landed Cost
Commercial Terms
Deliverables
Brand Analysis
Positioning & Value Prop
Share & Presence
Customer Evidence
Go-to-Market
Digital & Reputation
Compliance & Trust
KPIs & Gaps
Outputs
Full Research Suite comprises of:
Market outlook & trends analysis
Interviews & case studies
Strategic recommendations
Vendor profiles & capabilities analysis
5-year forecasts
8 regions and 60+ country-level data splits
Market segment data splits
12 months of continuous data updates
DELIVERED AS:
PDF EXCEL ONLINE
Intimate Wash Care Product Market Forecast and Outlook 2025 to 2035
Men's Intimate Care Products Market - Trends, Growth & Forecast 2025 to 2035
Japan Women’s Intimate Care Market Trends – Growth & Forecast 2024-2034
Suncare Products Market Size and Share Forecast Outlook 2025 to 2035
Skincare Products Market Size and Share Forecast Outlook 2025 to 2035
Sun Care Products Market Analysis – Growth, Applications & Outlook 2025–2035
Car Care Products Market Trends - Growth, Demand & Analysis 2025 to 2035
Nail Care Products Market Growth, Trends and Forecast from 2025 to 2035
Foot Care Product Market Analysis by Product Type, Distribution Channel and Region Through 2035
Facial Care Products Market Size and Share Forecast Outlook 2025 to 2035
Dental Care Products Market Size and Share Forecast Outlook 2025 to 2035
Senior Care Product Market Analysis – Size, Share & Forecast 2025 to 2035
Intimate Lightening Products Market Size and Share Forecast Outlook 2025 to 2035
Personal Care Products Filling System Market Size and Share Forecast Outlook 2025 to 2035
The Dementia Care Products Market is segmented by Memory Exercise & Activity Products, Daily Reminder Products and Dining Aids from 2025 to 2035
Men’s Skincare Products Market Size, Growth, and Forecast for 2025 to 2035
Pregnancy Care Products Market Analysis - Size, Share, and Forecast Outlook 2025 to 2035
Post Shave Care Products Market Size and Share Forecast Outlook 2025 to 2035
Baby Teeth Care Products Market Size and Share Forecast Outlook 2025 to 2035
Europe Pet Care Products Market Growth, Trends and Forecast from 2025 to 2035

Thank you!
You will receive an email from our Business Development Manager. Please be sure to check your SPAM/JUNK folder too.
Chat With
MaRIA