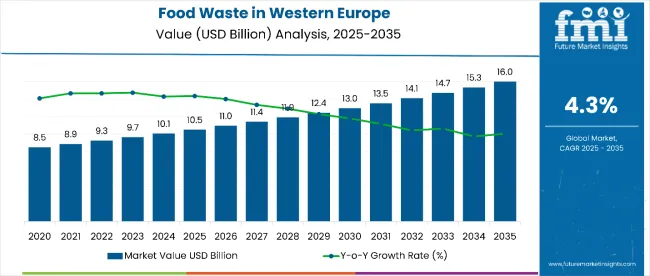
Sales of products from food waste in Western Europe are estimated at USD 10.5 billion in 2025 and are projected to reach USD 16 billion by 2035, reflecting a CAGR of 4.3% over the forecast period. This growth reflects both expanding environmental awareness and increased technological progress in waste valorization. The rise in demand is linked to circular economy principles, environmental regulations, and growing consumer preference for eco-friendly solutions.
| Metric | Value |
|---|---|
| Estimated Size (2025E) | USD 10.5 billion |
| Projected Value (2035F) | USD 16 billion |
| CAGR (2025 to 2035) | 4.3% |
By 2025, per capita consumption in leading Western European countries such as Germany, the United Kingdom, and France average between 15.2 and 18.7 kilograms of food waste-derived products, with projections reaching 23.1 and 28.4 kilograms by 2035. Germany leads among countries, expected to generate USD 5.4 billion in products from food waste sales by 2035, followed by the United Kingdom (USD 3.7 billion), France (USD 2.8 billion), Italy (USD 2.2 billion), and Spain (USD 1.7 billion).
The largest contribution to demand continues to come from food processing applications, which are expected to account for 24% of total sales in 2025, owing to regulatory requirements, cost efficiency benefits, and technological progress in extraction processes. By source, citrus fruits represent a significant contributor, responsible for 19% of all production, while other fruits and vegetables are used in various specialized applications.
Consumer adoption is particularly concentrated among environmentally focused food manufacturers and brands, with circular economy principles and waste reduction emerging as significant drivers of demand. While processing complexity remains a consideration, technological improvements in extraction and valorization have enhanced product quality and cost effectiveness.
Continued innovation in biorefinery technology and expanding applications in cosmetics and pharmaceuticals are expected to accelerate adoption across diverse usage segments. Regional disparities persist, but per capita utilization in countries with lower baseline adoption is narrowing the gap with traditionally strong environmental leaders.
The food waste segment in Western Europe is classified into multiple categories. By source, the key classifications include mango, apples, grapes, citrus fruits, carrots, beetroot, and others (berries). By application, the segment spans food processing, beverage processing, cosmetics & personal care, animal feed, and others (dietary supplements and nutraceuticals). By country, regions such as the UK, Germany, France, Italy, Spain, and the Rest of Western Europe.
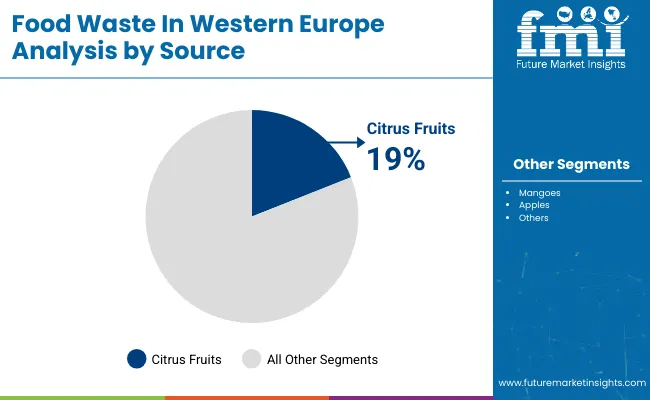
Citrus fruit waste utilization is projected to maintain significant dominance in 2025, supported by abundant waste generation from juice processing, established extraction technologies, and diverse application potential. Other sources show varying growth patterns based on processing innovation and application development.
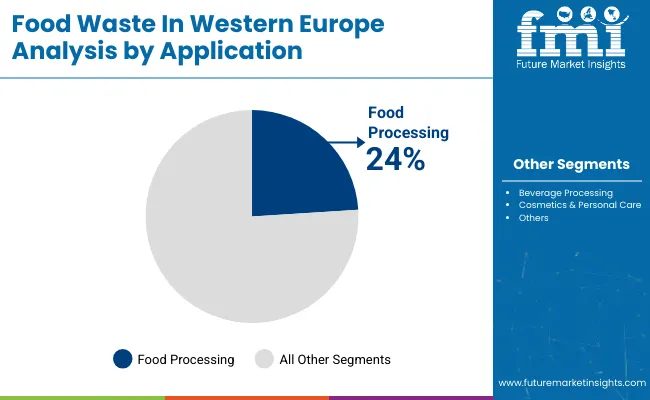
Products from food waste applications in Western Europe serve multiple sectors, with food processing maintaining dominance, while emerging applications in cosmetics and pharmaceuticals show strong growth potential.
| Country | CAGR (2025 to 2035) |
|---|---|
| United Kingdom | 5.6% |
| Spain | 4.8% |
| Italy | 4.5% |
| France | 4.2% |
| Germany | 3.4% |
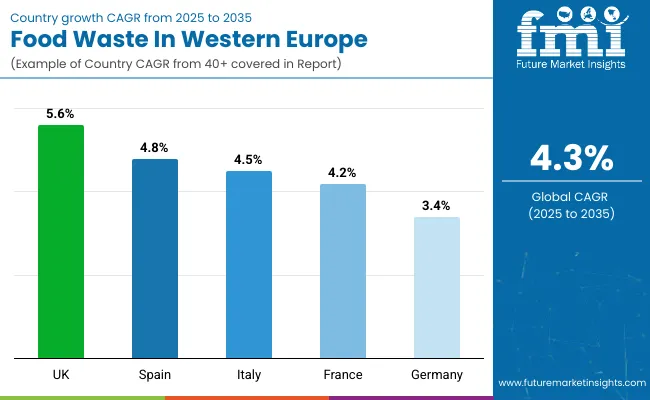
Country growth patterns will demonstrate variation across Western European territories. Emerging processing capabilities and environmental focus benefit countries with lower baseline development, while established leaders expand steadily from higher utilization bases. The table below shows the compound annual growth rate each country is expected to record between 2025 and 2035.
Between 2025 and 2035, demand for products from food waste is projected to expand across all major Western European countries. Still, growth rates will vary based on technology adoption levels, regulatory support, and environmental infrastructure development. Among the countries analyzed, the UK and Spain are expected to register the fastest compound annual growth rates of 5.6% and 4.8% respectively, outpacing more mature processing regions.
This acceleration stems from several factors: innovative technology adoption, regulatory framework development, and expanding commercial applications. In the United Kingdom, per capita waste valorization is projected to rise from 16.8 kg in 2025 to 28.1 kg by 2035, while in Spain, it is expected to increase from 14.2 kg to 22.6 kg over the same period.
Italy and France are forecast to grow at CAGRs of 4.5% and 4.2% respectively, supported by established agricultural processing capabilities and premium product development focus. Both countries maintain strong traditional processing knowledge and luxury application development.
Germany, while maintaining the highest absolute processing volumes, is projected to grow at a CAGR of 3.4%. The country exhibits mature processing infrastructure with established waste management systems and comprehensive regulatory frameworks. Growth will primarily come from technology optimization and expanding application areas rather than basic capacity development.
Products from food waste development across Western European countries vary based on regulatory frameworks, technological infrastructure, and environmental commitments. Germany dominates processing capabilities, while the United Kingdom shows the highest growth rates.
Germany Leading Food Waste Processing Hub
Germany represents the largest products from the food waste processing region, driven by strong regulatory frameworks, advanced technology infrastructure, and established environmental commitments across multiple sectors.
Per capita waste valorization in Germany is projected to reach 28.4 kg by 2035, up from 18.7 kg in 2025, reflecting comprehensive waste management systems and industrial processing capabilities supporting diverse product development applications.
The United Kingdom demonstrates the highest growth potential, driven by innovative technology development, startup ecosystem growth, and increasing environmental focus across the food and beverage sectors.
France shows steady growth supported by agricultural processing capabilities and luxury food culture integration, particularly in premium application development and gourmet ingredient production.
Italy demonstrates strong growth potential through agricultural waste utilization and Mediterranean product specialization, leveraging regional crop characteristics and processing traditions.
Spain shows emerging growth opportunities through fruit processing expansion and renewable energy integration, supporting both waste valorization and renewable energy production.
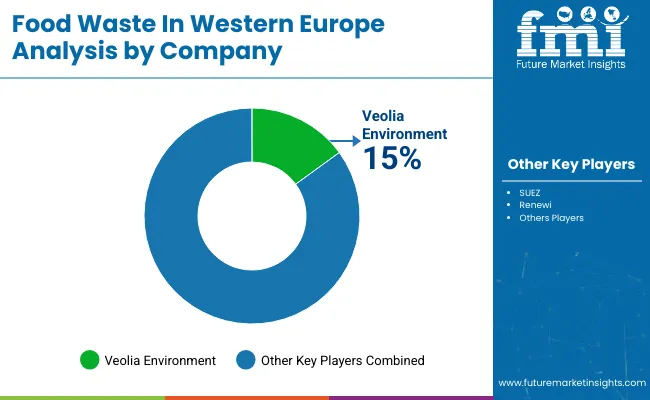
The competitive environment is characterized by a mix of waste management specialists and innovative food technology companies. Processing capabilities and technology innovation remain decisive success factors, with leading suppliers maintaining comprehensive waste processing facilities and advanced valorization technologies. Veolia Environment serves as a prominent participant in the Western European products from food waste segment, leveraging comprehensive waste management expertise and advanced processing technologies to serve multiple application sectors and commercial customers.
SUEZ applies integrated waste management capabilities and circular economy expertise to provide comprehensive food waste valorization solutions, serving food manufacturers, beverage producers, and specialty ingredient companies requiring sustainable processing options. Renewi focuses on environmentally responsible waste processing technologies and circular economy solutions, providing specialized services for food waste conversion into value-added products and renewable energy applications.
Biogen emphasizes anaerobic digestion technology and biogas production capabilities, serving energy generation requirements while producing digestate for agricultural applications and supporting renewable energy objectives. ReFood specializes in food waste collection and processing services, providing comprehensive solutions for food manufacturers and retailers requiring efficient waste management and valorization capabilities.
Innovative startups, including Bio-bean Ltd., GroCycle, and Toast Ale Ltd., drive technology innovation and niche application development, creating specialized products from coffee waste, mushroom cultivation, and brewing byproducts, respectively.
Key Developments
In April 2025, Aeropowder launched PluumoPlus, the world’s first thermal packaging solution made from recycled feathers. Headquartered in London, the company applies circular economy principles to offer an eco-friendly, high-performance alternative for cold chain logistics, replacing traditional insulation materials with sustainable feather-based technology.
| Items | Values |
|---|---|
| Quantitative Units (2025) | USD 10.5 Billion |
| Application | Food Processing, Animal Feed, Biofuels, Fertilizers, Bioplastics, Pharmaceuticals, and Cosmetics |
| Source | Mango, Apples, Grapes, Citrus Fruits, Carrots, Beetroot, and Others (Berries) |
| Country Covered | United Kingdom, Germany, France, Netherlands, Italy |
| Key Companies Profiled | Aeropowder, Bio-bean Ltd., GroCycle, Rubies in the Rubble, Snact Ltd., Toast Ale Ltd., Circular Systems S.P.C., Fruitcycle, Jrink Juicery, Misfit Foods, ReGrained LLC, and Rise Products |
| Additional Attributes | Dollar sales by source and application; investment hotspots in waste valorization; regional circular economy adoption; advances in anaerobic digestion and bioconversion; competitive strategies in food waste upcycling; government waste reduction incentives; and consumer preferences for eco-friendly, sustainable products |
In 2025, total sales of products from food waste in Western Europe are projected to be valued at USD 10.5 billion.
By 2035, sales of products from food waste in Western Europe are forecast to reach USD 16 billion, representing a CAGR of approximately 4.3%.
Citrus fruits are projected to lead the category with a 19% share in 2025, followed by apples with 16% and grapes with 14%.
The UK is projected to record the fastest growth with a CAGR of 5.6% between 2025 and 2035, followed by Spain with 4.8%.
Food processing is projected to lead the application segment with a 24% share in 2025.


Our Research Products

The "Full Research Suite" delivers actionable market intel, deep dives on markets or technologies, so clients act faster, cut risk, and unlock growth.

The Leaderboard benchmarks and ranks top vendors, classifying them as Established Leaders, Leading Challengers, or Disruptors & Challengers.

Locates where complements amplify value and substitutes erode it, forecasting net impact by horizon

We deliver granular, decision-grade intel: market sizing, 5-year forecasts, pricing, adoption, usage, revenue, and operational KPIs—plus competitor tracking, regulation, and value chains—across 60 countries broadly.

Spot the shifts before they hit your P&L. We track inflection points, adoption curves, pricing moves, and ecosystem plays to show where demand is heading, why it is changing, and what to do next across high-growth markets and disruptive tech

Real-time reads of user behavior. We track shifting priorities, perceptions of today’s and next-gen services, and provider experience, then pace how fast tech moves from trial to adoption, blending buyer, consumer, and channel inputs with social signals (#WhySwitch, #UX).

Partner with our analyst team to build a custom report designed around your business priorities. From analysing market trends to assessing competitors or crafting bespoke datasets, we tailor insights to your needs.
Supplier Intelligence
Discovery & Profiling
Capacity & Footprint
Performance & Risk
Compliance & Governance
Commercial Readiness
Who Supplies Whom
Scorecards & Shortlists
Playbooks & Docs
Category Intelligence
Definition & Scope
Demand & Use Cases
Cost Drivers
Market Structure
Supply Chain Map
Trade & Policy
Operating Norms
Deliverables
Buyer Intelligence
Account Basics
Spend & Scope
Procurement Model
Vendor Requirements
Terms & Policies
Entry Strategy
Pain Points & Triggers
Outputs
Pricing Analysis
Benchmarks
Trends
Should-Cost
Indexation
Landed Cost
Commercial Terms
Deliverables
Brand Analysis
Positioning & Value Prop
Share & Presence
Customer Evidence
Go-to-Market
Digital & Reputation
Compliance & Trust
KPIs & Gaps
Outputs
Full Research Suite comprises of:
Market outlook & trends analysis
Interviews & case studies
Strategic recommendations
Vendor profiles & capabilities analysis
5-year forecasts
8 regions and 60+ country-level data splits
Market segment data splits
12 months of continuous data updates
DELIVERED AS:
PDF EXCEL ONLINE
Products from Food Waste Industry Analysis in Korea Size, Share and Forecast Outlook 2025 to 2035
Products from Food Waste in Japan - Size, Share, and Forecast Outlook 2025 to 2035
Products from Food Waste Market Analysis - Size, Growth, and Forecast 2025 to 2035
USA Products from Food Waste Market Growth – Trends, Demand & Outlook 2025-2035
Western Europe Anti-wrinkle Products Market Analysis – Size, Share & Trends 2025 to 2035
Food Waste Shredder Market Size and Share Forecast Outlook 2025 to 2035
Food Waste Disposal Equipment Market Size and Share Forecast Outlook 2025 to 2035
Food Waste Composting Machine Market Size and Share Forecast Outlook 2025 to 2035
Food Waste-Derived Protein Market Size and Share Forecast Outlook 2025 to 2035
Food Waste Management Market Analysis - Size, Share, and Forecast 2025 to 2035
Europe Food Service Equipment Market Outlook – Size, Trends & Forecast 2025–2035
Europe Food Testing Services Market Analysis – Size, Share & Forecast 2025–2035
Europe Food Emulsifier Market Trends – Growth, Demand & Forecast 2025–2035
Europe Food Stabilizers Market Analysis – Size, Share & Forecast 2025–2035
Comprehensive Analysis of Food Premix Market by Form, Ingredient Type, End-Use Application and Function Type through 2035
Western Europe Automotive Performance Tuning & Engine Remapping Market Size and Share Forecast Outlook 2025 to 2035
Western Europe Valve Seat Insert Market Size and Share Forecast Outlook 2025 to 2035
Western Europe Automated People Mover Industry Size and Share Forecast Outlook 2025 to 2035
Western Europe Bicycle Component Aftermarket Analysis Size and Share Forecast Outlook 2025 to 2035
Western Europe Automotive Load Floor IndustryAnalysis in Western Europe Forecast & Analysis 2025 to 2035

Thank you!
You will receive an email from our Business Development Manager. Please be sure to check your SPAM/JUNK folder too.
Chat With
MaRIA