Industrial Film Market Size and Share Forecast Outlook From 2024 to 2034

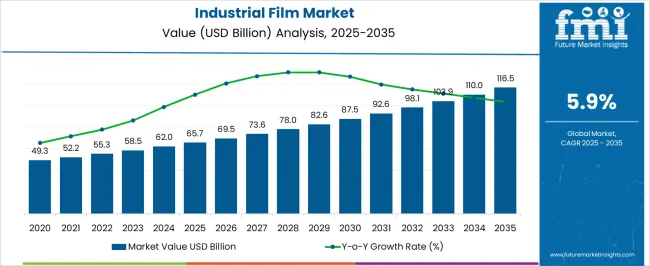
The Industrial Film Market is projected to be valued at USD 62.0 billion in 2024 and rise to USD 110.0 billion by 2034. It is expected to grow at a CAGR of 5.9% from 2024 to 2034.

Attributes Key Statistics
Industrial Film Market Value (2024) USD 62.0 Billion
Anticipated Market Value (2034) USD 110.0 Billion
Estimated Growth (2024 to 2034) 5.9 % CAGR

Top Industrial Film Market Dynamics and Industry Trends

  • The need for functional and protective films to safeguard equipment, materials, and products during manufacturing, storage, and transportation is rising as industries expand and modernize.
  • The growing eCommerce sector and the need for efficient packaging solutions are driving the demand for industrial films in packaging applications. To ensure product protection, tamper resistance, and stability during transit, industrial films are used for shrink, stretch, and pallet wrapping, leading to market growth.
  • Developing high-performance industrial films with enhanced properties such as strength, durability, and chemical resistance, coupled with continuous advancements in material technology, are driving market growth.
  • The innovative films cater to industrial requirements, including weatherproofing, UV protection, and thermal insulation.
  • Growing emphasis on sustainability and environmental concerns has prompted industries to adopt eco-friendly packaging materials, including recyclable and biodegradable industrial films.
  • Stringent regulations and standards governing packaging and industrial processes, particularly concerning product safety, hygiene, and quality assurance, are driving the adoption of industrial films.
  • The rapid industrialization and urbanization in emerging economies, particularly in Asia-Pacific and Latin America, are fueling the demand for industrial films.
  • Industrial films find extensive applications in these sectors for protective wrapping, insulation, lamination, and surface protection.

Key Drivers of Growth in the Industrial Film Market

  • The demand for protective packaging solutions is increasing due to the rising need to safeguard products from damage, moisture, and contamination during storage and transportation across electronics, automotive, and pharmaceutical industries.
  • Industrial films with advanced capabilities like puncture resistance, tear resistance, and UV protection are highly preferred by consumers in the market.
  • Industries favor these films' ability to provide reliable protection for goods and equipment, thereby driving their sales and adoption in various applications.
  • The rapid expansion of the e-commerce sector has significantly boosted the sales of industrial films used for packaging applications.
  • Industrial films are increasingly adopted in construction and infrastructure projects for applications such as moisture barriers, insulation, and surface protection.
  • The preference for durable and weather-resistant films in these sectors drives their adoption, contributing to their popularity and widespread use in construction projects worldwide.
  • Sustainable industrial films made from recyclable or biodegradable materials are gaining popularity due to environmental concerns and regulatory requirements.
  • Industries prefer customized industrial film solutions tailored to their requirements and applications. The availability of personalized films with features such as printability, barrier protection, and specialized adhesives enhances their appeal.

Factors Adversely Affecting the Industrial Film Market

  • Market saturation poses a challenge due to intensified competition and price pressures.
  • Fluctuations in raw material prices can adversely affect profit margins and pricing strategies.
  • Environmental regulations may necessitate changes in manufacturing processes and product formulations, leading to additional costs and compliance challenges.
  • The availability of alternative packaging materials may impact demand and market share for plastic-based products.
  • Slow adoption of advanced technologies and global economic uncertainty can hinder market growth.
  • Increasingly stringent quality and performance standards can pose challenges for market players.

Industrial Film Industry Analysis by Top Investment Segments

Higher Demand for Linear Low-Density Polyethylene due to its Versatility and Cost-Effectiveness

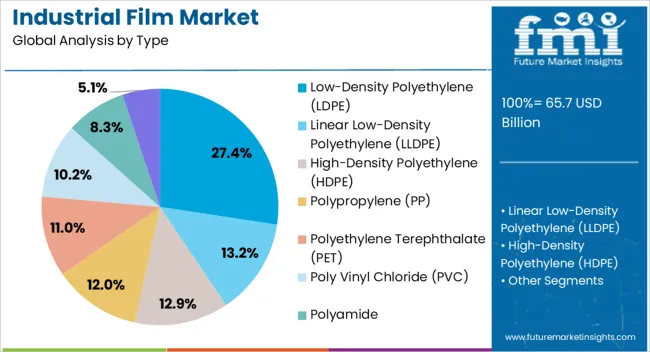
Sales of linear low-density polyethylene are expected to surge at a 5.8% CAGR through 2034.

Attributes Details
Top Type Linear Low-Density Polyethylene
CAGR ( 2024 to 2034) 5.8%

The segment’s rising popularity is attributed to:

  • Linear low-density polyethylene offers superior puncture resistance, tear resistance, and flexibility, making it ideal for manufacturing industrial films used in packaging, agriculture, construction, and other sectors.
  • The excellent mechanical properties ensure reliable protection for goods and materials during storage, transportation, and handling, meeting various industries' stringent requirements.
  • Linear low-density polyethylene films exhibit excellent sealability, allowing for efficient packaging processes and ensuring product integrity.
  • The widespread availability of LLDPE resin and the relative affordability of production contribute to its dominance in the market, offering manufacturers a reliable and cost-efficient solution for meeting various industries' packaging and protective needs.

Demand for Protective Films in Logistics and Transportation

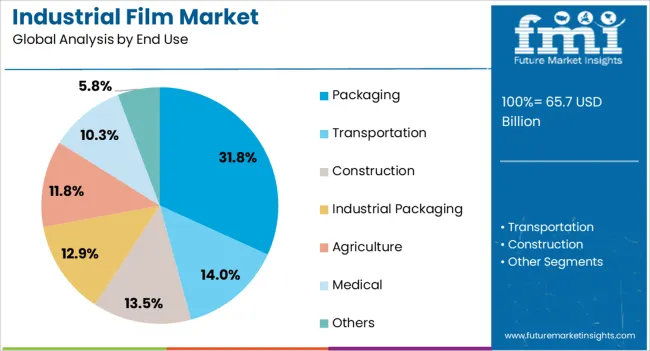
The transportation segment is poised to exhibit a robust 5.6% CAGR through 2034.

Attributes Details
Top End Use Transportation
CAGR ( 2024 to 2034) 5.6%

This rising popularity of the segment is attributed to:

  • Industrial films dominate the transportation industry due to their extensive use in packaging and protection applications.
  • Industrial films are crucial for safeguarding goods during transit, providing durability, weather resistance, and protection against mechanical damage.
  • Industrial films are used for pallet, stretch, and shrink-wrapping applications to secure loads and prevent shifting or damage during transportation by various means.
  • The transportation industry's emphasis on sustainability and cost-effectiveness drives the demand for eco-friendly and cost-effective industrial films.
  • The transportation sector's reliance on industrial films for efficient packaging contributes to its dominance in the industrial film market.

Analysis of Top Countries Producing, Formulating, Packaging, Distributing, and Using Industrial Films

The section analyzes the industrial film market by country, including the United Kingdom, the United States, China, South Korea, and Japan. The table presents the CAGRs for each country, indicating the expected market growth through 2034.

Countries CAGR (2024 to 2034)
United Kingdom 7.1%
South Korea 6.8%
Japan 6.3%
China 6.2%
United States 6.1%

Manufacturing Prowess and Strategic Location is Expanding the Industrial Film Market in the United Kingdom

The United Kingdom remains a key contributor to the market. It is expected to rise at a CAGR of 7.1% through 2034.

The United Kingdom has a thriving manufacturing sector, particularly in the automotive, aerospace, and construction industries. The country's focus on advanced manufacturing technologies and materials innovation has led to the increasing adoption of industrial films for packaging, protection, and insulation purposes. The UK's strategic location as a gateway to European markets also gives it an edge in the global industrial film market.
South Korea's Technological Expertise and Diverse Industrial Applications Drive Market Growth

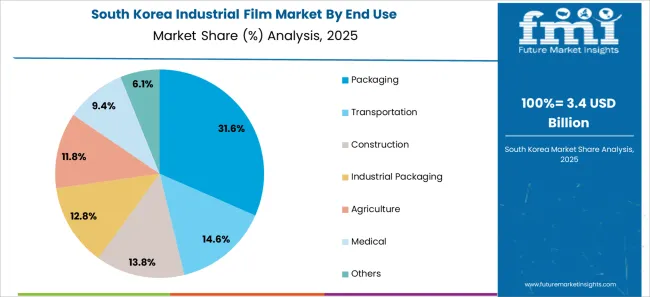
The market in South Korea is expected to grow at a CAGR of 6.8% from 2024 to 2034.

South Korea has advanced manufacturing capabilities and technological expertise, leading to growth in its market. The presence of major players in industries drives the demand for industrial films for protective wrapping, insulation, and electronic component packaging. The country's focus on research and development and its commitment to innovation contribute to developing specialized industrial films tailored to specific industries' needs.
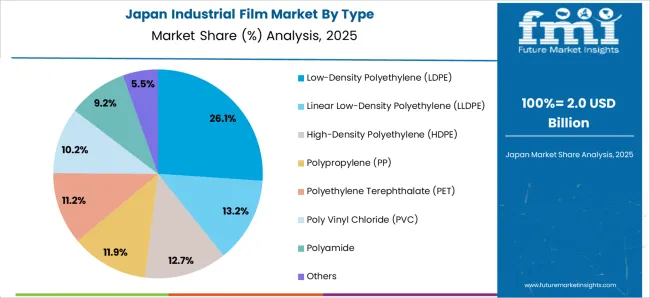
Japan's Growth in the Industrial Film Market Stems from Innovation and Quality

The market in Japan is expected to rise at a CAGR of 6.3% through 2034.

Japan is known for its quality and innovation in manufacturing, leading to its growth in the market. Japanese companies excel in producing high-performance industrial films with advanced functionalities such as barrier protection, heat resistance, and optical clarity.

The adoption of industrial films in Japan is driven by industries like automotive, electronics, and healthcare, which require reliable and durable packaging solutions to ensure product integrity and safety. Japan's focus on environmental sustainability and stringent quality standards further bolster the growth of the country's industrial film market.

China's Growth in the Industrial Film Market Stems from Rapid Industrialization and Manufacturing

The market in China is expected to grow at a CAGR of 6.2% from 2024 to 2034.

China's rapid industrialization and urbanization have created a high demand for industrial films for packaging, construction, agriculture, and automotive applications. The country's booming manufacturing sector and expanding consumer market are the primary drivers of the market's growth.

Government initiatives promoting sustainable development and the adoption of advanced materials are propelling the market by encouraging the use of eco-friendly and high-performance industrial films in various industries across China.

The United States Surpasses the Industrial Film Market due to Technological Advancements and Robust Manufacturing Capabilities

The United States is emerging as a significant contender in the market, with a projected CAGR of 6.1% until 2034.

The United States has a strong industrial base and has made significant investments in infrastructure development, leading to growth in the market. The e-commerce industry's growth and demand for efficient packaging solutions are driving the adoption of industrial films in the USA market, and advancements in material science and manufacturing technologies enable USA companies to produce high-performance industrial films that cater to diverse industrial applications.
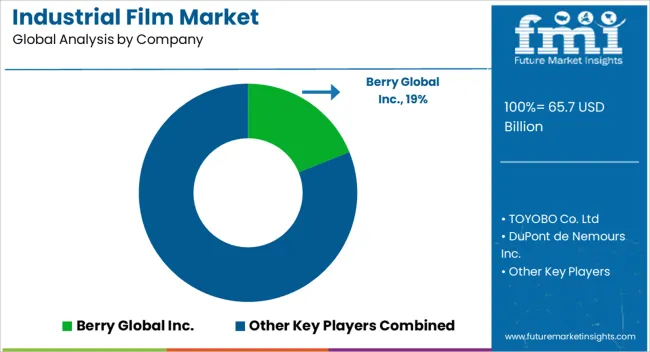
Competitive Landscape of the Industrial Film Market

The industrial film market is witnessing significant growth, owing to the strategic contributions of several major companies and manufacturers. Leading players such as Berry Global Inc., Dow Inc., Exxon Mobil Corporation, DuPont de Nemours Inc., and Mitsubishi Chemical Holdings Corporation invest extensively in research and development to develop new formulations and technologies.

These companies are also focusing on enhancing the sustainability and performance of industrial films to meet evolving market demands.

Strategic partnerships, mergers, and acquisitions facilitate market expansion, enabling companies to broaden their product portfolios and geographical presence. Through targeted marketing initiatives and robust distribution networks, key players are effectively reaching diverse industrial sectors and capitalizing on emerging opportunities in regions with high demand growth.

The competitive landscape is characterized by intense competition among major players striving for market dominance. Companies are vying for market share through product differentiation, pricing strategies, and technological advancements. By leveraging market insights and adapting to changing consumer preferences, leading companies stay ahead of the curve and position themselves for sustained growth in the market.

Recent Developments

  • On April 29, 2022, Raven Engineered Films announced its acquisition by Industrial Opportunity Partners, enabling the company to advance technological innovations in Sioux Falls polymer film and sheeting solutions.
  • In May 2021, Mitsubishi Chemical Holdings Corporation, a Japanese chemical and pharmaceutical firm, completed the acquisition of Nakai Industrial Co. Ltd., a manufacturer of industrial films, to bolster its film coatings production capabilities and address diverse customer needs.
  • In February 2021, INDEVCO Plastics Longview, LLC unveiled new recyclable industrial films and bags containing up to 50% recycled resin. The company introduced a recyclable Shrink Bundling Film tailored for the beverage and processed food sectors, incorporating 50% post-consumer recycled (PCR) resin, aiming to promote sustainability by minimizing the environmental footprint of packaging materials.
  • In September 2019, Bemis Company Inc. inaugurated a new facility within Amcor, located in New Albany, Ohio, to bolster the global expansion of packaging innovation.

Leading Companies in the Industrial Film Market

  • TOYOBO Co. Ltd
  • DuPont de Nemours Inc.
  • TEKRA, MURAPLAST d.o.o.
  • Transcendia Vecom
  • ishakha Polyfab Pvt Ltd
  • Klöckner Pentaplast
  • Dow
  • Soretrac (UK) Limited
  • Hypac Packaging Pte Ltd.
  • Peiyu Plastics Corporation
  • AVI Global Plast
  • Verstraete IML
  • Berry Global Inc.
  • Bemis Company, Inc
  • Jindal Poly Films
  • Mitsui Chemicals, Inc.
  • PLASTIC SUPPLIERS, INC.
  • WINPAK LTD.
  • Polifilm GmbH
  • Avery Dennison
  • DIC CORPORATION

Scope and Coverage of the Industrial Film Market Report

  • Film for industrial applications market
  • Top 10 Industrial Films Suppliers and Producers
  • Comparative Analysis on 3M Films & Sheeting for Manufacturing
  • Compiled List of Top 10 BOPP and PET Films Manufacturers in India
  • How big is the specialty films market
  • Identifying Industrial Films Market's Size and Industry Development Globally

Market Segmentation of the GNSS Simulator Market

By Type:

  • Linear Low-Density Polyethylene (LLDPE)
  • Low-Density Polyethylene (LDPE)
  • High-Density Polyethylene (HDPE)
  • Polypropylene (PP)
  • Polyethylene Terephthalate (PET)
  • Poly Vinyl Chloride (PVC)
  • Polyamide
  • Others

By End Use:

  • Transportation
  • Construction
  • Industrial Packaging
  • Agriculture
  • Medical
  • Others

By Region:

  • North America
  • Latin America
  • Asia Pacific
  • Middle East and Africa (MEA)
  • Europe

Table of Content

  • 1. Executive Summary
  • 2. Market Overview
  • 3. Market Background
  • 4. Global Market Analysis 2019 to 2023 and Forecast, 2024 to 2034
  • 5. Global Market Analysis 2019 to 2023 and Forecast 2024 to 2034, By Type
    • 5.1 Linear Low-Density Polyethylene (LLDPE)
    • 5.2 Low-Density Polyethylene (LDPE)
    • 5.3 High-Density Polyethylene (HDPE)
    • 5.4 Polypropylene (PP)
    • 5.5 Polyethylene Terephthalate (PET)
    • 5.6 Poly Vinyl Chloride (PVC)
    • 5.7 Polyamide
    • 5.8 Others
  • 6. Global Market Analysis 2019 to 2023 and Forecast 2024 to 2034, By End-Use
    • 6.1 Transportation
    • 6.2 Construction
    • 6.3 Industrial Packaging
    • 6.4 Agriculture
    • 6.5 Medical
    • 6.6 Others
  • 7. Global Market Analysis 2019 to 2023 and Forecast 2024 to 2034, By Region
    • 7.1 North America
    • 7.2 Latin America
    • 7.3 Western Europe
    • 7.4 Eastern Europe
    • 7.5 South Asia and Pacific
    • 7.6 East Asia
    • 7.7 Middle East and Africa
  • 8. North America Market Analysis 2019 to 2023 and Forecast 2024 to 2034, By Country
  • 9. Latin America Market Analysis 2019 to 2023 and Forecast 2024 to 2034, By Country
  • 10. Western Europe Market Analysis 2019 to 2023 and Forecast 2024 to 2034, By Country
  • 11. Eastern Europe Market Analysis 2019 to 2023 and Forecast 2024 to 2034, By Country
  • 12. South Asia and Pacific Market Analysis 2019 to 2023 and Forecast 2024 to 2034, By Country
  • 13. East Asia Market Analysis 2019 to 2023 and Forecast 2024 to 2034, By Country
  • 14. Middle East and Africa Market Analysis 2019 to 2023 and Forecast 2024 to 2034, By Country
  • 15. Key Countries Market Analysis
  • 16. Market Structure Analysis
  • 17. Competition Analysis
    • 17.1 TOYOBO Co. Ltd
    • 17.2 DuPont de Nemours Inc.
    • 17.3 TEKRA
    • 17.4 MURAPLAST d.o.o.
    • 17.5 Transcendia
    • 17.6 Mondi
    • 17.7 Mitsui Chemicals Tohcello.Inc.
    • 17.8 HiFi Industrial Films Limited
    • 17.9 Bogucki Folie
    • 17.10 FUJIFILM Corporation
    • 17.11 Pely-plastic GmbH & Co.
    • 17.12 LINTEC EUROPE
    • 17.13 Supreme mill stores
    • 17.14 TAGHLEEF INDUSTRIES GROUP
  • 18. Assumptions & Acronyms Used
  • 19. Research Methodology

List of Tables

Table 1: Global Market Value (US$ Million) Forecast by Region, 2019 to 2034

Table 2: Global Market Volume (Tons) Forecast by Region, 2019 to 2034

Table 3: Global Market Value (US$ Million) Forecast by Type, 2019 to 2034

Table 4: Global Market Volume (Tons) Forecast by Type, 2019 to 2034

Table 5: Global Market Value (US$ Million) Forecast by End-Use, 2019 to 2034

Table 6: Global Market Volume (Tons) Forecast by End-Use, 2019 to 2034

Table 7: North America Market Value (US$ Million) Forecast by Country, 2019 to 2034

Table 8: North America Market Volume (Tons) Forecast by Country, 2019 to 2034

Table 9: North America Market Value (US$ Million) Forecast by Type, 2019 to 2034

Table 10: North America Market Volume (Tons) Forecast by Type, 2019 to 2034

Table 11: North America Market Value (US$ Million) Forecast by End-Use, 2019 to 2034

Table 12: North America Market Volume (Tons) Forecast by End-Use, 2019 to 2034

Table 13: Latin America Market Value (US$ Million) Forecast by Country, 2019 to 2034

Table 14: Latin America Market Volume (Tons) Forecast by Country, 2019 to 2034

Table 15: Latin America Market Value (US$ Million) Forecast by Type, 2019 to 2034

Table 16: Latin America Market Volume (Tons) Forecast by Type, 2019 to 2034

Table 17: Latin America Market Value (US$ Million) Forecast by End-Use, 2019 to 2034

Table 18: Latin America Market Volume (Tons) Forecast by End-Use, 2019 to 2034

Table 19: Western Europe Market Value (US$ Million) Forecast by Country, 2019 to 2034

Table 20: Western Europe Market Volume (Tons) Forecast by Country, 2019 to 2034

Table 21: Western Europe Market Value (US$ Million) Forecast by Type, 2019 to 2034

Table 22: Western Europe Market Volume (Tons) Forecast by Type, 2019 to 2034

Table 23: Western Europe Market Value (US$ Million) Forecast by End-Use, 2019 to 2034

Table 24: Western Europe Market Volume (Tons) Forecast by End-Use, 2019 to 2034

Table 25: Eastern Europe Market Value (US$ Million) Forecast by Country, 2019 to 2034

Table 26: Eastern Europe Market Volume (Tons) Forecast by Country, 2019 to 2034

Table 27: Eastern Europe Market Value (US$ Million) Forecast by Type, 2019 to 2034

Table 28: Eastern Europe Market Volume (Tons) Forecast by Type, 2019 to 2034

Table 29: Eastern Europe Market Value (US$ Million) Forecast by End-Use, 2019 to 2034

Table 30: Eastern Europe Market Volume (Tons) Forecast by End-Use, 2019 to 2034

Table 31: South Asia and Pacific Market Value (US$ Million) Forecast by Country, 2019 to 2034

Table 32: South Asia and Pacific Market Volume (Tons) Forecast by Country, 2019 to 2034

Table 33: South Asia and Pacific Market Value (US$ Million) Forecast by Type, 2019 to 2034

Table 34: South Asia and Pacific Market Volume (Tons) Forecast by Type, 2019 to 2034

Table 35: South Asia and Pacific Market Value (US$ Million) Forecast by End-Use, 2019 to 2034

Table 36: South Asia and Pacific Market Volume (Tons) Forecast by End-Use, 2019 to 2034

Table 37: East Asia Market Value (US$ Million) Forecast by Country, 2019 to 2034

Table 38: East Asia Market Volume (Tons) Forecast by Country, 2019 to 2034

Table 39: East Asia Market Value (US$ Million) Forecast by Type, 2019 to 2034

Table 40: East Asia Market Volume (Tons) Forecast by Type, 2019 to 2034

Table 41: East Asia Market Value (US$ Million) Forecast by End-Use, 2019 to 2034

Table 42: East Asia Market Volume (Tons) Forecast by End-Use, 2019 to 2034

Table 43: Middle East and Africa Market Value (US$ Million) Forecast by Country, 2019 to 2034

Table 44: Middle East and Africa Market Volume (Tons) Forecast by Country, 2019 to 2034

Table 45: Middle East and Africa Market Value (US$ Million) Forecast by Type, 2019 to 2034

Table 46: Middle East and Africa Market Volume (Tons) Forecast by Type, 2019 to 2034

Table 47: Middle East and Africa Market Value (US$ Million) Forecast by End-Use, 2019 to 2034

Table 48: Middle East and Africa Market Volume (Tons) Forecast by End-Use, 2019 to 2034

List of Figures

Figure 1: Global Market Value (US$ Million) by Type, 2024 to 2034

Figure 2: Global Market Value (US$ Million) by End-Use, 2024 to 2034

Figure 3: Global Market Value (US$ Million) by Region, 2024 to 2034

Figure 4: Global Market Value (US$ Million) Analysis by Region, 2019 to 2034

Figure 5: Global Market Volume (Tons) Analysis by Region, 2019 to 2034

Figure 6: Global Market Value Share (%) and BPS Analysis by Region, 2024 to 2034

Figure 7: Global Market Y-o-Y Growth (%) Projections by Region, 2024 to 2034

Figure 8: Global Market Value (US$ Million) Analysis by Type, 2019 to 2034

Figure 9: Global Market Volume (Tons) Analysis by Type, 2019 to 2034

Figure 10: Global Market Value Share (%) and BPS Analysis by Type, 2024 to 2034

Figure 11: Global Market Y-o-Y Growth (%) Projections by Type, 2024 to 2034

Figure 12: Global Market Value (US$ Million) Analysis by End-Use, 2019 to 2034

Figure 13: Global Market Volume (Tons) Analysis by End-Use, 2019 to 2034

Figure 14: Global Market Value Share (%) and BPS Analysis by End-Use, 2024 to 2034

Figure 15: Global Market Y-o-Y Growth (%) Projections by End-Use, 2024 to 2034

Figure 16: Global Market Attractiveness by Type, 2024 to 2034

Figure 17: Global Market Attractiveness by End-Use, 2024 to 2034

Figure 18: Global Market Attractiveness by Region, 2024 to 2034

Figure 19: North America Market Value (US$ Million) by Type, 2024 to 2034

Figure 20: North America Market Value (US$ Million) by End-Use, 2024 to 2034

Figure 21: North America Market Value (US$ Million) by Country, 2024 to 2034

Figure 22: North America Market Value (US$ Million) Analysis by Country, 2019 to 2034

Figure 23: North America Market Volume (Tons) Analysis by Country, 2019 to 2034

Figure 24: North America Market Value Share (%) and BPS Analysis by Country, 2024 to 2034

Figure 25: North America Market Y-o-Y Growth (%) Projections by Country, 2024 to 2034

Figure 26: North America Market Value (US$ Million) Analysis by Type, 2019 to 2034

Figure 27: North America Market Volume (Tons) Analysis by Type, 2019 to 2034

Figure 28: North America Market Value Share (%) and BPS Analysis by Type, 2024 to 2034

Figure 29: North America Market Y-o-Y Growth (%) Projections by Type, 2024 to 2034

Figure 30: North America Market Value (US$ Million) Analysis by End-Use, 2019 to 2034

Figure 31: North America Market Volume (Tons) Analysis by End-Use, 2019 to 2034

Figure 32: North America Market Value Share (%) and BPS Analysis by End-Use, 2024 to 2034

Figure 33: North America Market Y-o-Y Growth (%) Projections by End-Use, 2024 to 2034

Figure 34: North America Market Attractiveness by Type, 2024 to 2034

Figure 35: North America Market Attractiveness by End-Use, 2024 to 2034

Figure 36: North America Market Attractiveness by Country, 2024 to 2034

Figure 37: Latin America Market Value (US$ Million) by Type, 2024 to 2034

Figure 38: Latin America Market Value (US$ Million) by End-Use, 2024 to 2034

Figure 39: Latin America Market Value (US$ Million) by Country, 2024 to 2034

Figure 40: Latin America Market Value (US$ Million) Analysis by Country, 2019 to 2034

Figure 41: Latin America Market Volume (Tons) Analysis by Country, 2019 to 2034

Figure 42: Latin America Market Value Share (%) and BPS Analysis by Country, 2024 to 2034

Figure 43: Latin America Market Y-o-Y Growth (%) Projections by Country, 2024 to 2034

Figure 44: Latin America Market Value (US$ Million) Analysis by Type, 2019 to 2034

Figure 45: Latin America Market Volume (Tons) Analysis by Type, 2019 to 2034

Figure 46: Latin America Market Value Share (%) and BPS Analysis by Type, 2024 to 2034

Figure 47: Latin America Market Y-o-Y Growth (%) Projections by Type, 2024 to 2034

Figure 48: Latin America Market Value (US$ Million) Analysis by End-Use, 2019 to 2034

Figure 49: Latin America Market Volume (Tons) Analysis by End-Use, 2019 to 2034

Figure 50: Latin America Market Value Share (%) and BPS Analysis by End-Use, 2024 to 2034

Figure 51: Latin America Market Y-o-Y Growth (%) Projections by End-Use, 2024 to 2034

Figure 52: Latin America Market Attractiveness by Type, 2024 to 2034

Figure 53: Latin America Market Attractiveness by End-Use, 2024 to 2034

Figure 54: Latin America Market Attractiveness by Country, 2024 to 2034

Figure 55: Western Europe Market Value (US$ Million) by Type, 2024 to 2034

Figure 56: Western Europe Market Value (US$ Million) by End-Use, 2024 to 2034

Figure 57: Western Europe Market Value (US$ Million) by Country, 2024 to 2034

Figure 58: Western Europe Market Value (US$ Million) Analysis by Country, 2019 to 2034

Figure 59: Western Europe Market Volume (Tons) Analysis by Country, 2019 to 2034

Figure 60: Western Europe Market Value Share (%) and BPS Analysis by Country, 2024 to 2034

Figure 61: Western Europe Market Y-o-Y Growth (%) Projections by Country, 2024 to 2034

Figure 62: Western Europe Market Value (US$ Million) Analysis by Type, 2019 to 2034

Figure 63: Western Europe Market Volume (Tons) Analysis by Type, 2019 to 2034

Figure 64: Western Europe Market Value Share (%) and BPS Analysis by Type, 2024 to 2034

Figure 65: Western Europe Market Y-o-Y Growth (%) Projections by Type, 2024 to 2034

Figure 66: Western Europe Market Value (US$ Million) Analysis by End-Use, 2019 to 2034

Figure 67: Western Europe Market Volume (Tons) Analysis by End-Use, 2019 to 2034

Figure 68: Western Europe Market Value Share (%) and BPS Analysis by End-Use, 2024 to 2034

Figure 69: Western Europe Market Y-o-Y Growth (%) Projections by End-Use, 2024 to 2034

Figure 70: Western Europe Market Attractiveness by Type, 2024 to 2034

Figure 71: Western Europe Market Attractiveness by End-Use, 2024 to 2034

Figure 72: Western Europe Market Attractiveness by Country, 2024 to 2034

Figure 73: Eastern Europe Market Value (US$ Million) by Type, 2024 to 2034

Figure 74: Eastern Europe Market Value (US$ Million) by End-Use, 2024 to 2034

Figure 75: Eastern Europe Market Value (US$ Million) by Country, 2024 to 2034

Figure 76: Eastern Europe Market Value (US$ Million) Analysis by Country, 2019 to 2034

Figure 77: Eastern Europe Market Volume (Tons) Analysis by Country, 2019 to 2034

Figure 78: Eastern Europe Market Value Share (%) and BPS Analysis by Country, 2024 to 2034

Figure 79: Eastern Europe Market Y-o-Y Growth (%) Projections by Country, 2024 to 2034

Figure 80: Eastern Europe Market Value (US$ Million) Analysis by Type, 2019 to 2034

Figure 81: Eastern Europe Market Volume (Tons) Analysis by Type, 2019 to 2034

Figure 82: Eastern Europe Market Value Share (%) and BPS Analysis by Type, 2024 to 2034

Figure 83: Eastern Europe Market Y-o-Y Growth (%) Projections by Type, 2024 to 2034

Figure 84: Eastern Europe Market Value (US$ Million) Analysis by End-Use, 2019 to 2034

Figure 85: Eastern Europe Market Volume (Tons) Analysis by End-Use, 2019 to 2034

Figure 86: Eastern Europe Market Value Share (%) and BPS Analysis by End-Use, 2024 to 2034

Figure 87: Eastern Europe Market Y-o-Y Growth (%) Projections by End-Use, 2024 to 2034

Figure 88: Eastern Europe Market Attractiveness by Type, 2024 to 2034

Figure 89: Eastern Europe Market Attractiveness by End-Use, 2024 to 2034

Figure 90: Eastern Europe Market Attractiveness by Country, 2024 to 2034

Figure 91: South Asia and Pacific Market Value (US$ Million) by Type, 2024 to 2034

Figure 92: South Asia and Pacific Market Value (US$ Million) by End-Use, 2024 to 2034

Figure 93: South Asia and Pacific Market Value (US$ Million) by Country, 2024 to 2034

Figure 94: South Asia and Pacific Market Value (US$ Million) Analysis by Country, 2019 to 2034

Figure 95: South Asia and Pacific Market Volume (Tons) Analysis by Country, 2019 to 2034

Figure 96: South Asia and Pacific Market Value Share (%) and BPS Analysis by Country, 2024 to 2034

Figure 97: South Asia and Pacific Market Y-o-Y Growth (%) Projections by Country, 2024 to 2034

Figure 98: South Asia and Pacific Market Value (US$ Million) Analysis by Type, 2019 to 2034

Figure 99: South Asia and Pacific Market Volume (Tons) Analysis by Type, 2019 to 2034

Figure 100: South Asia and Pacific Market Value Share (%) and BPS Analysis by Type, 2024 to 2034

Figure 101: South Asia and Pacific Market Y-o-Y Growth (%) Projections by Type, 2024 to 2034

Figure 102: South Asia and Pacific Market Value (US$ Million) Analysis by End-Use, 2019 to 2034

Figure 103: South Asia and Pacific Market Volume (Tons) Analysis by End-Use, 2019 to 2034

Figure 104: South Asia and Pacific Market Value Share (%) and BPS Analysis by End-Use, 2024 to 2034

Figure 105: South Asia and Pacific Market Y-o-Y Growth (%) Projections by End-Use, 2024 to 2034

Figure 106: South Asia and Pacific Market Attractiveness by Type, 2024 to 2034

Figure 107: South Asia and Pacific Market Attractiveness by End-Use, 2024 to 2034

Figure 108: South Asia and Pacific Market Attractiveness by Country, 2024 to 2034

Figure 109: East Asia Market Value (US$ Million) by Type, 2024 to 2034

Figure 110: East Asia Market Value (US$ Million) by End-Use, 2024 to 2034

Figure 111: East Asia Market Value (US$ Million) by Country, 2024 to 2034

Figure 112: East Asia Market Value (US$ Million) Analysis by Country, 2019 to 2034

Figure 113: East Asia Market Volume (Tons) Analysis by Country, 2019 to 2034

Figure 114: East Asia Market Value Share (%) and BPS Analysis by Country, 2024 to 2034

Figure 115: East Asia Market Y-o-Y Growth (%) Projections by Country, 2024 to 2034

Figure 116: East Asia Market Value (US$ Million) Analysis by Type, 2019 to 2034

Figure 117: East Asia Market Volume (Tons) Analysis by Type, 2019 to 2034

Figure 118: East Asia Market Value Share (%) and BPS Analysis by Type, 2024 to 2034

Figure 119: East Asia Market Y-o-Y Growth (%) Projections by Type, 2024 to 2034

Figure 120: East Asia Market Value (US$ Million) Analysis by End-Use, 2019 to 2034

Figure 121: East Asia Market Volume (Tons) Analysis by End-Use, 2019 to 2034

Figure 122: East Asia Market Value Share (%) and BPS Analysis by End-Use, 2024 to 2034

Figure 123: East Asia Market Y-o-Y Growth (%) Projections by End-Use, 2024 to 2034

Figure 124: East Asia Market Attractiveness by Type, 2024 to 2034

Figure 125: East Asia Market Attractiveness by End-Use, 2024 to 2034

Figure 126: East Asia Market Attractiveness by Country, 2024 to 2034

Figure 127: Middle East and Africa Market Value (US$ Million) by Type, 2024 to 2034

Figure 128: Middle East and Africa Market Value (US$ Million) by End-Use, 2024 to 2034

Figure 129: Middle East and Africa Market Value (US$ Million) by Country, 2024 to 2034

Figure 130: Middle East and Africa Market Value (US$ Million) Analysis by Country, 2019 to 2034

Figure 131: Middle East and Africa Market Volume (Tons) Analysis by Country, 2019 to 2034

Figure 132: Middle East and Africa Market Value Share (%) and BPS Analysis by Country, 2024 to 2034

Figure 133: Middle East and Africa Market Y-o-Y Growth (%) Projections by Country, 2024 to 2034

Figure 134: Middle East and Africa Market Value (US$ Million) Analysis by Type, 2019 to 2034

Figure 135: Middle East and Africa Market Volume (Tons) Analysis by Type, 2019 to 2034

Figure 136: Middle East and Africa Market Value Share (%) and BPS Analysis by Type, 2024 to 2034

Figure 137: Middle East and Africa Market Y-o-Y Growth (%) Projections by Type, 2024 to 2034

Figure 138: Middle East and Africa Market Value (US$ Million) Analysis by End-Use, 2019 to 2034

Figure 139: Middle East and Africa Market Volume (Tons) Analysis by End-Use, 2019 to 2034

Figure 140: Middle East and Africa Market Value Share (%) and BPS Analysis by End-Use, 2024 to 2034

Figure 141: Middle East and Africa Market Y-o-Y Growth (%) Projections by End-Use, 2024 to 2034

Figure 142: Middle East and Africa Market Attractiveness by Type, 2024 to 2034

Figure 143: Middle East and Africa Market Attractiveness by End-Use, 2024 to 2034

Figure 144: Middle East and Africa Market Attractiveness by Country, 2024 to 2034

Frequently Asked Questions

What is the Estimated Valuation of the Industrial Film Market in 2024?

The industrial film market is predicted to be valued at USD 62.0 billion in 2024.

What is the Sales Forecast for the Industrial Films by 2034?

The market is expected to reach USD 110.0 billion by 2034.

At What Rate is the Market Expected to Grow through 2034?

The market is expected to grow at a CAGR of 5.9% from 2024 to 2034.

Who are the Key Manufacturers in the Market?

TOYOBO Co. Ltd, DuPont de Nemours Inc., TEKRA, MURAPLAST d.o.o., and Transcendia are among the major companies actively contributing to the global market growth.

What is the Top Type in the Market?

Linear Low-Density Polyethylene (LLDPE) is the top type in the market.

Explore Similar Insights

Future Market Insights

Industrial Film Market