Reports

- Global Locations -

Headquarters

Future Market Insights, Inc.

Christiana Corporate, 200
Continental Drive, Suite 401,
Newark, Delaware - 19713,
United States

T: +1-845-579-5705

Americas

Future Market Insights, Inc.

616 Corporate Way, Suite 2-9018,
Valley Cottage, NY 10989, United States

T: +1-347-918-3531

MEA

Future Market Insights

1602-6 Jumeirah Bay X2 Tower, Plot No: JLT-PH2-X2A,
Jumeirah Lakes Towers, Dubai,
United Arab Emirates

Europe

Future Market Insights

3rd Floor, 207 Regent Street,
W1B 3HH London
United Kingdom

T: + 44 (0) 20 8123 9659
D: +44 (0) 20 3287 4268

Asia Pacific

Future Market Insights

IndiaLand Global Tech Park, Unit UG-1, Behind Grand HighStreet, Phase 1, Hinjawadi, MH, Pune – 411057, India

Eco-friendly Tea Packaging Market Outlook for 2024 to 2034

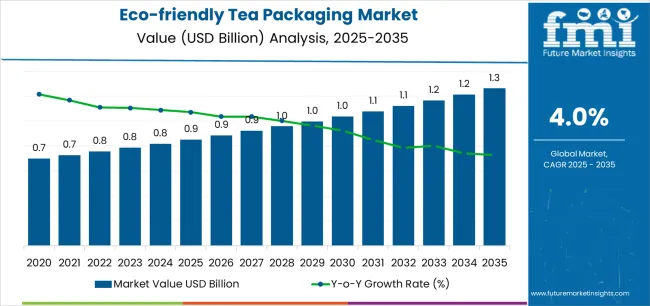
The global consumption of eco-friendly tea packaging products stood at around US$ 820.1 million in 2024. The overall market is slated to witness a CAGR of 4% to reach a valuation of US$ 1,213.8 million by 2034. The top 5 companies are anticipated to hold 15 to 20% of the overall eco-friendly tea packaging industry in 2024.

Report Attribute Details
Eco-friendly Tea Packaging Market Size (2024) US$ 820.1 million
Market Anticipated Forecast Value (2034) US$ 1,213.8 million
Market Projected Growth Rate (2024 to 2034) 4% CAGR

Don't pay for what you don't need

Customize your report by selecting specific countries or regions and save 30%!

Eco-friendly Tea Packaging Market Trends & Analysis

  • Amid increasing environmental concerns, conventional tea packaging manufacturers are shifting to sustainable and eco-friendly packaging solutions.
  • Eco-friendly tea packaging that keeps the freshness and scent of tea leaves for longer periods of time is in high demand.
  • East Asia and South Asia are anticipated to create lucrative opportunities for eco-friendly tea packaging manufacturers during the forecast period due to the high production of tea in these regions.
  • Famous tea companies using sustainability to differentiate brands have evolved the market dynamics of environmentally friendly tea packaging fast.

Global Eco-friendly Tea Packaging Market Historical Analysis (2019 to 2023) Vs Forecast Outlook (2024 to 2034)

The global eco-friendly tea packaging market was valued at US$ 651.2 million in 2019. During the historic period between 2019 and 2023, eco-friendly tea packaging sales increased at a CAGR of 3.6%. The overall market value was about US$ 778.7 million by 2023.

Attributes Details
Eco-friendly Tea Packaging Market Value (2019) US$ US$ 651.2 million
Market Revenue (2023) US$ 778.7 million
Market Historical Growth Rate (CAGR 2019 to 2023) 3.6% CAGR
Ismail Sutaria
Ismail Sutaria

Principal Consultant

Talk to Analyst

Find your sweet spots for generating winning opportunities in this market.

Prominent Factors Fuelling the Global Eco-friendly Tea Packaging Market Growth

Tea has several medicinal benefits and is becoming increasingly popular around the world. Several local initiatives to increase tea production beyond Asian countries are expected to improve the eco-conscious tea packaging market overview during the forecast period.

In comparison to many other materials like plastic or glass, which are more expensive than paper packaging, paper packaging is preferred due to its low cost and environmental sustainability.

The density, gloss-coating, and opacity of paper are some aspects that are used to assess its quality. Tea is packaged in paper because it has a lower impact on the environment than any type of packaging. It contains no chemicals or undergoes chlorine treatment.

Comparative View of Adjacent Eco-friendly Tea Packaging Market

This section explains the opportunities and challenges for the sustainable tea packaging industry in the context of two related emerging markets. The eco-friendly tea packaging is estimated to represent around 5 to 7% of the overall beverage packaging market over the forecast period.

The global FMCG packaging market also presents some lucrative growth opportunities for the industry players operating in the packaging sector.

Eco-friendly Tea Packaging Market:

Attributes Eco-friendly Tea Packaging Market
CAGR (2024 to 2034) 4%
Growth Factor A notable rise in the popularity of tea in countries beyond Asia has increased the export of tea from South Asia.
Market Opportunities Research into new environmentally friendly materials including plant-based plastics or biopolymers.
Market Challenges Use of eco-friendly packaging materials raises the cost of production for result in higher pricing and sales reduction.

Beverage Packaging Market:

Attributes Beverage Packaging Market
CAGR (2024 to 2034) 4.2%
Growth Factor Ready-to-drink or RTD companies are diversifying their product lines fast to appeal to a wide range of consumers.
Market Opportunities Rising demand for metal and glass containers reflects a move toward recyclable and eco-friendly packaging solutions.
Market Challenges Strong government laws to address packaging waste disposal and reduction is anticipated to impede the market expansion.

FMCG Packaging Market:

Attributes FMCG Packaging Market
CAGR (2024 to 2034) 5.8%
Growth Factor Prevalence of convenience and low-cost stores as well as rising food and beverage industry output.
Market Opportunities As e-commerce platforms have surged packaged food products sales companies are experimenting more with sustainable packaging options.
Market Challenges Biodegradable packaging materials used in the FMCG industry's final product production expenses are higher compared to other materials.

Get the data you need at a Fraction of the cost

Personalize your report by choosing insights you need
and save 40%!

Country-wise Insights

The table below lists the countries where ecofriendly material manufacturers are anticipated to witness greater growth opportunities in the tea packaging sector.

Regional Market Comparison CAGR (2024 to 2034)
United States 1.6%
Germany 1%
United Kingdom 1.3%
India 5.5%
China 4.4%

Manufacturers in the USA are Preferring Biodegradable Tea Packaging

The United States eco-friendly tea packaging market sales are likely to witness a CAGR of 1.6% through 2034.

The USA is expected to dominate the North American biodegradable tea packaging market over the assessment period. Innovation in material technologies in the USA, along with the emergence of numerous organic tea start-ups are anticipated to create new growth opportunities in the coming days.

Increasing Sales of Loose Leaf Tea Packaging to Augment Growth in Germany

Sales of eco-friendly tea packaging products are anticipated to grow at a rate of 1% per year during the forecast period.

Stricter laws governing the usage of plastic and other polymer packaging have surged the demand for eco-friendly tea packaging options in Germany. Moreover, the growing popularity of tea leaves sold loose in Germany and other European countries has increased the use of eco-friendly packaging bags to retain the flavor and freshness of the product.

Organic Move is driving the Market in the United Kingdom

Demand for eco-friendly tea packaging options in the United Kingdom is projected to rise at a higher rate of 1.3% till 2034.

The need for sustainable choices has heightened in the country due to consumers' preference for goods that minimize their environmental impact and reduce plastic waste. In addition, emerging trends in biodegradable tea packaging fit perfectly with the increasing preference for organic tea and herbal tea trends in the United Kingdom.

Export Companies have bolstered the Renewable Tea Packaging Market in China

The eco-friendly tea packaging industry of China is forecasted to thrive with a CAGR of 4.4% between 2024 and 2034.

Biodegradable materials like paper, cardboard, or compostable plastics production have increased substantially in China in the last few years. Tea exporters have also witnessed eco-friendly packaging attracting more customers and propelling sales abroad.

Also, because single-use plastics are becoming illegal or subject to regulations around the globe, tea companies are shifting toward an environmentally friendly tea packaging market more and more.

India Eco-friendly Tea Packaging Market to Remain Lucrative in the Future

As per the study, sales in the Indian market are likely to grow at a rate of 5.5% per year over the assessment period.

Several industries, including food products & agriculture, e-commerce, and logistics, have experienced substantial industrialization and expansion as a result of increased international commerce and favorable measures by the Indian government.

The demand for eco-friendly tea packaging for effective storage and transportation of tea is being driven by the high consumption of tea among individuals in the country.

Category-wise Insights

Sales of Boxes and Cartons have Boosted After the e-Commerce Proliferation

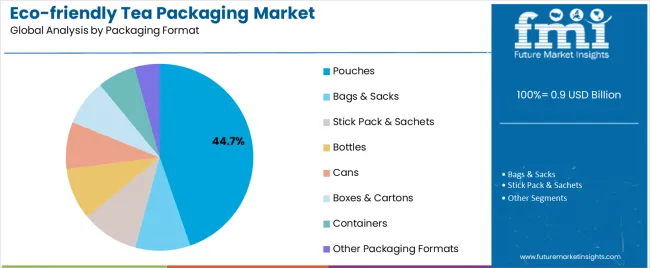
In terms of packaging format, demand for boxes and cartons is expected to contribute to 46.8% of the total sales in 2024.

Attributes Details
Top Packaging Format or Segment Boxes & Cartons
Total Market Share in 2024 to 2034 46.8%

Increasing demand for sustainable packaging solutions for transport and delivery through e-commerce is observed to augment the market share of this segment. However, due to high durability, and strength the industrial demand for bags and sacks is likely to grow at a faster rate over the forecast years.

Sales of Paperboard and Paper-based Tea Packaging Products to Remain High

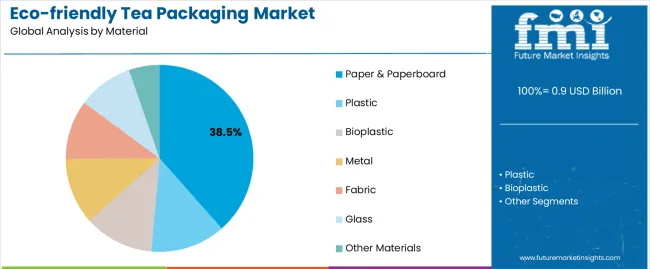
Based on material, the paper and paperboard tea packaging segment is expected to account for over 37.9% of the total market share in 2024.

Attributes Details
Top Material Type or Segment Paper & Paperboard
Total Market Share in 2024 37.9%

Demand for paper and paperboard packaging is high as it is sustainable and recyclable. Moreover, paper and paper-board materials are popular in the retail sector and are preferred more for packing tea in small amounts.
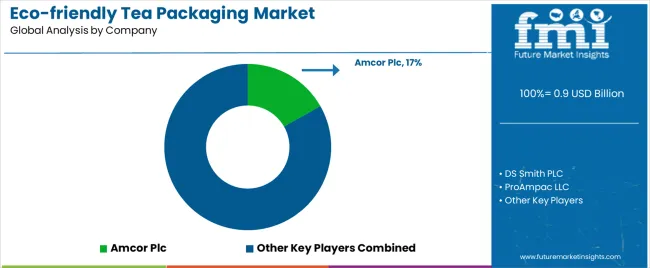
Competitive Landscape for Eco-friendly Tea Packaging Market

The overall market has turned highly competitive after the entry of many start-ups with eco-friendly material innovations and packaging solutions. Leading players in the global eco-friendly tea packaging market are investing in promotional strategies to improve sales. They are launching lightweight and cost-effective products to gain a competitive edge in the market.

Recent Developments in the Global Eco-friendly Tea Packaging Market

  • Amcor Plc is attempting to improve its manufacturing processes to lower its carbon footprint and develop sustainable eco-friendly tea packaging.
  • WestRock Company is planning to expand its paper-based line to replace plastic packaging in e-commerce with a recyclable solution created from socially sourced renewable materials.

Key Players Profiled in the Eco-friendly Tea Packaging Market Report

  • Amcor Plc
  • DS Smith PLC
  • ProAmpac LLC
  • WestRock Company
  • Mondi PLC
  • Crown Holdings, Inc.
  • Sonoco Products Company
  • Graham Packaging Company
  • Novolex Holdings, Inc.
  • Pacific Bag, Inc.
  • Goglio SpA
  • Co-Pack Inc.
  • Dongguan Min Lee Packaging Materials Co, Ltd
  • Shenzhen Color Hoyo Paper & Plastic Products Co, Ltd
  • Dongguan Jmei Packaging Company Limited
  • Shenzhen Packmate Packaging Co., Ltd.
  • PBFY Flexible Packaging
  • Sixto Packaging
  • Qingdao Dejili Packing Material Co. Ltd
  • Color Hoyo Paper & Plastic Products Co., Ltd

Key Coverage in the Eco-friendly Tea Packaging Market Report

  • Adjacent study on green tea packaging market.
  • An overview of eco-friendly tea companies.
  • Other eco-friendly packaging examples in food & beverage sector.
  • Popularizing eco-friendly food packaging ideas.

Eco-friendly Tea Packaging Market Report Scope

Attribute Details
Estimated Market Size (2024) US$ 820.1 million
Projected Market Size (2034) US$ 1,213.8 million
Anticipated Growth Rate (2024 to 2034) 4%
Forecast Period 2024 to 2034
Historical Data Available for 2019 to 2023
Market Analysis US$ million or billion for Value and Units for Volume
Key Regions Covered North America, Latin America, Europe, Middle East & Africa (MEA), East Asia, South Asia and Oceania
Key Countries Covered United States, Canada, Brazil, Mexico, Germany, Spain, Italy, France, United Kingdom, Russia, China, India, Australia & New Zealand, GCC Countries, and South Africa
Key Segments Covered By Material Type, By Format, By Distribution Channel, By End User Verticals, and By Region
Key Companies Profiled
  • Amcor Plc
  • DS Smith PLC
  • ProAmpac LLC
  • WestRock Company
  • Mondi PLC
  • Crown Holdings, Inc.
  • Sonoco Products Company
  • Graham Packaging Company
  • Novolex Holdings, Inc.
  • Pacific Bag, Inc.
  • Goglio SpA
  • Co-Pack Inc
  • Dongguan Min Lee Packaging Materials Co, Ltd
  • Shenzhen Color Hoyo Paper & Plastic Products Co, Ltd
  • Dongguan Jmei Packaging Company Limited
  • Shenzhen Packmate Packaging Co., Ltd.
  • PBFY Flexible Packaging
  • Sixto Packaging
  • Qingdao Dejili Packing Material Co. Ltd
  • Color Hoyo Paper & Plastic Products Co., Ltd
Report Coverage Market Forecast, Company Share Analysis, Competition Intelligence, DROT Analysis, Market Dynamics and Challenges, and Strategic Growth Initiatives
Customization & Pricing Available upon Request

Key Segments Covered by Eco-friendly Tea Packaging Industry Survey Report

By Material Type:

  • Plastic
  • Bioplastic
  • Metal
  • Fabric
  • Paper & Paperboard
  • Glass
  • Other Materials

By Distribution Channel:

  • Online Sales Channel
  • Offline Sales Channel

By Packaging Format:

  • Pouches
  • Bags & Sacks
  • Stick Pack & Sachets
  • Bottles
  • Cans
  • Boxes & Cartons
  • Containers
  • Other Packaging Formats

By End User Verticals:

  • Institutional
  • Commercial

By Region:

  • North America
  • Latin America
  • Europe
  • East Asia
  • South Asia and Pacific
  • Middle East and Africa (MEA)

Frequently Asked Questions

How Big is the Global Eco-friendly Tea Packaging Market Currently?

The global eco-friendly tea packaging market is estimated to be around US$ 820.1 million in 2024.

What is the Growth Outlook of the Global Eco-friendly Tea Packaging Market?

The global eco-friendly tea packaging market is to grow at 4% during the forecast period.

What is the projected Value of Global Eco-friendly Tea Packaging Market by 2034?

The global eco-friendly tea packaging market is predicted to be valued at US$ 1,213.8 million by 2034.

What was the Historical Size of the Global Eco-friendly Tea Packaging Market?

The global eco-friendly tea packaging market was valued at US$ US$ 651.2 million in 2019.

Which Materials are Used More by Global Eco-friendly Tea Packaging Industry Players?

Paper and paperboard materials contribute for 37.9% revenue share of the global eco-friendly tea packaging market.

Which Regional Eco-friendly Tea Packaging Market has the Highest Growth Potential?

India is predicted to witness a CAGR of 5.5% in sales of eco-friendly tea packaging through 2034.

Table of Content

1. Executive Summary

    1.1. Global Market Outlook

    1.2. Demand-side Trends

    1.3. Supply-side Trends

    1.4. Technology Roadmap Analysis

    1.5. Analysis and Recommendations

2. Market Overview

    2.1. Market Coverage / Taxonomy

    2.2. Market Definition / Scope / Limitations

3. Market Background

    3.1. Market Dynamics

        3.1.1. Drivers

        3.1.2. Restraints

        3.1.3. Opportunity

        3.1.4. Trends

    3.2. Scenario Forecast

        3.2.1. Demand in Optimistic Scenario

        3.2.2. Demand in Likely Scenario

        3.2.3. Demand in Conservative Scenario

    3.3. Opportunity Map Analysis

    3.4. Product Life Cycle Analysis

    3.5. Supply Chain Analysis

        3.5.1. Supply Side Participants and their Roles

            3.5.1.1. Manufacturer

        3.5.2. Value Added and Value Created at Node in the Supply Chain

        3.5.3. List of Raw Material Suppliers

        3.5.4. List of Existing and Potential Buyer’s

    3.6. Investment Feasibility Matrix

    3.7. Value Chain Analysis

        3.7.1. Profit Margin Analysis

    3.8. PESTLE and Porter’s Analysis

    3.9. Regulatory Landscape

        3.9.1. By Key Regions

        3.9.2. By Key Countries

    3.10. Regional Parent Market Outlook

    3.11. Production and Consumption Statistics

    3.12. Import and Export Statistics

4. Global Market Analysis 2019 to 2023 and Forecast, 2024 to 2034

    4.1. Historical Market Size Value (US$ Million) & Volume (Units) Analysis, 2019 to 2023

    4.2. Current and Future Market Size Value (US$ Million) & Volume (Units) Projections, 2024 to 2034

        4.2.1. Y-o-Y Growth Trend Analysis

        4.2.2. Absolute $ Opportunity Analysis

5. Global Market Analysis 2019 to 2023 and Forecast 2024 to 2034, By Material

    5.1. Introduction / Key Findings

    5.2. Historical Market Size Value (US$ Million) & Volume (Units) Analysis By Material, 2019 to 2023

    5.3. Current and Future Market Size Value (US$ Million) & Volume (Units) Analysis and Forecast By Material, 2024 to 2034

        5.3.1. Plastic

        5.3.2. Metal

        5.3.3. Paper

        5.3.4. Glass

        5.3.5. Others

    5.4. Y-o-Y Growth Trend Analysis By Material, 2019 to 2023

    5.5. Absolute $ Opportunity Analysis By Material, 2024 to 2034

6. Global Market Analysis 2019 to 2023 and Forecast 2024 to 2034, By Packaging Format

    6.1. Introduction / Key Findings

    6.2. Historical Market Size Value (US$ Million) & Volume (Units) Analysis By Packaging Format, 2019 to 2023

    6.3. Current and Future Market Size Value (US$ Million) & Volume (Units) Analysis and Forecast By Packaging Format, 2024 to 2034

        6.3.1. Pouches

        6.3.2. Bags & Sacks

        6.3.3. Stick Pack & Sachets

        6.3.4. Bottles

        6.3.5. Cans

        6.3.6. Containers & Boxes

    6.4. Y-o-Y Growth Trend Analysis By Packaging Format, 2019 to 2023

    6.5. Absolute $ Opportunity Analysis By Packaging Format, 2024 to 2034

7. Global Market Analysis 2019 to 2023 and Forecast 2024 to 2034, By Distribution Channel

    7.1. Introduction / Key Findings

    7.2. Historical Market Size Value (US$ Million) & Volume (Units) Analysis By Distribution Channel, 2019 to 2023

    7.3. Current and Future Market Size Value (US$ Million) & Volume (Units) Analysis and Forecast By Distribution Channel, 2024 to 2034

        7.3.1. Online

        7.3.2. Offline

    7.4. Y-o-Y Growth Trend Analysis By Distribution Channel, 2019 to 2023

    7.5. Absolute $ Opportunity Analysis By Distribution Channel, 2024 to 2034

8. Global Market Analysis 2019 to 2023 and Forecast 2024 to 2034, By Region

    8.1. Introduction

    8.2. Historical Market Size Value (US$ Million) & Volume (Units) Analysis By Region, 2019 to 2023

    8.3. Current Market Size Value (US$ Million) & Volume (Units) Analysis and Forecast By Region, 2024 to 2034

        8.3.1. North America

        8.3.2. Latin America

        8.3.3. Western Europe

        8.3.4. Eastern Europe

        8.3.5. South Asia and Pacific

        8.3.6. East Asia

        8.3.7. Middle East and Africa

    8.4. Market Attractiveness Analysis By Region

9. North America Market Analysis 2019 to 2023 and Forecast 2024 to 2034, By Country

    9.1. Historical Market Size Value (US$ Million) & Volume (Units) Trend Analysis By Market Taxonomy, 2019 to 2023

    9.2. Market Size Value (US$ Million) & Volume (Units) Forecast By Market Taxonomy, 2024 to 2034

        9.2.1. By Country

            9.2.1.1. USA

            9.2.1.2. Canada

        9.2.2. By Material

        9.2.3. By Packaging Format

        9.2.4. By Distribution Channel

    9.3. Market Attractiveness Analysis

        9.3.1. By Country

        9.3.2. By Material

        9.3.3. By Packaging Format

        9.3.4. By Distribution Channel

    9.4. Key Takeaways

10. Latin America Market Analysis 2019 to 2023 and Forecast 2024 to 2034, By Country

    10.1. Historical Market Size Value (US$ Million) & Volume (Units) Trend Analysis By Market Taxonomy, 2019 to 2023

    10.2. Market Size Value (US$ Million) & Volume (Units) Forecast By Market Taxonomy, 2024 to 2034

        10.2.1. By Country

            10.2.1.1. Brazil

            10.2.1.2. Mexico

            10.2.1.3. Rest of Latin America

        10.2.2. By Material

        10.2.3. By Packaging Format

        10.2.4. By Distribution Channel

    10.3. Market Attractiveness Analysis

        10.3.1. By Country

        10.3.2. By Material

        10.3.3. By Packaging Format

        10.3.4. By Distribution Channel

    10.4. Key Takeaways

11. Western Europe Market Analysis 2019 to 2023 and Forecast 2024 to 2034, By Country

    11.1. Historical Market Size Value (US$ Million) & Volume (Units) Trend Analysis By Market Taxonomy, 2019 to 2023

    11.2. Market Size Value (US$ Million) & Volume (Units) Forecast By Market Taxonomy, 2024 to 2034

        11.2.1. By Country

            11.2.1.1. Germany

            11.2.1.2. UK

            11.2.1.3. France

            11.2.1.4. Spain

            11.2.1.5. Italy

            11.2.1.6. Rest of Western Europe

        11.2.2. By Material

        11.2.3. By Packaging Format

        11.2.4. By Distribution Channel

    11.3. Market Attractiveness Analysis

        11.3.1. By Country

        11.3.2. By Material

        11.3.3. By Packaging Format

        11.3.4. By Distribution Channel

    11.4. Key Takeaways

12. Eastern Europe Market Analysis 2019 to 2023 and Forecast 2024 to 2034, By Country

    12.1. Historical Market Size Value (US$ Million) & Volume (Units) Trend Analysis By Market Taxonomy, 2019 to 2023

    12.2. Market Size Value (US$ Million) & Volume (Units) Forecast By Market Taxonomy, 2024 to 2034

        12.2.1. By Country

            12.2.1.1. Poland

            12.2.1.2. Russia

            12.2.1.3. Czech Republic

            12.2.1.4. Romania

            12.2.1.5. Rest of Eastern Europe

        12.2.2. By Material

        12.2.3. By Packaging Format

        12.2.4. By Distribution Channel

    12.3. Market Attractiveness Analysis

        12.3.1. By Country

        12.3.2. By Material

        12.3.3. By Packaging Format

        12.3.4. By Distribution Channel

    12.4. Key Takeaways

13. South Asia and Pacific Market Analysis 2019 to 2023 and Forecast 2024 to 2034, By Country

    13.1. Historical Market Size Value (US$ Million) & Volume (Units) Trend Analysis By Market Taxonomy, 2019 to 2023

    13.2. Market Size Value (US$ Million) & Volume (Units) Forecast By Market Taxonomy, 2024 to 2034

        13.2.1. By Country

            13.2.1.1. India

            13.2.1.2. Bangladesh

            13.2.1.3. Australia

            13.2.1.4. New Zealand

            13.2.1.5. Rest of South Asia and Pacific

        13.2.2. By Material

        13.2.3. By Packaging Format

        13.2.4. By Distribution Channel

    13.3. Market Attractiveness Analysis

        13.3.1. By Country

        13.3.2. By Material

        13.3.3. By Packaging Format

        13.3.4. By Distribution Channel

    13.4. Key Takeaways

14. East Asia Market Analysis 2019 to 2023 and Forecast 2024 to 2034, By Country

    14.1. Historical Market Size Value (US$ Million) & Volume (Units) Trend Analysis By Market Taxonomy, 2019 to 2023

    14.2. Market Size Value (US$ Million) & Volume (Units) Forecast By Market Taxonomy, 2024 to 2034

        14.2.1. By Country

            14.2.1.1. China

            14.2.1.2. Japan

            14.2.1.3. South Korea

        14.2.2. By Material

        14.2.3. By Packaging Format

        14.2.4. By Distribution Channel

    14.3. Market Attractiveness Analysis

        14.3.1. By Country

        14.3.2. By Material

        14.3.3. By Packaging Format

        14.3.4. By Distribution Channel

    14.4. Key Takeaways

15. Middle East and Africa Market Analysis 2019 to 2023 and Forecast 2024 to 2034, By Country

    15.1. Historical Market Size Value (US$ Million) & Volume (Units) Trend Analysis By Market Taxonomy, 2019 to 2023

    15.2. Market Size Value (US$ Million) & Volume (Units) Forecast By Market Taxonomy, 2024 to 2034

        15.2.1. By Country

            15.2.1.1. GCC Countries

            15.2.1.2. South Africa

            15.2.1.3. Israel

            15.2.1.4. Rest of MEA

        15.2.2. By Material

        15.2.3. By Packaging Format

        15.2.4. By Distribution Channel

    15.3. Market Attractiveness Analysis

        15.3.1. By Country

        15.3.2. By Material

        15.3.3. By Packaging Format

        15.3.4. By Distribution Channel

    15.4. Key Takeaways

16. Key Countries Market Analysis

    16.1. USA

        16.1.1. Pricing Analysis

        16.1.2. Market Share Analysis, 2023

            16.1.2.1. By Material

            16.1.2.2. By Packaging Format

            16.1.2.3. By Distribution Channel

    16.2. Canada

        16.2.1. Pricing Analysis

        16.2.2. Market Share Analysis, 2023

            16.2.2.1. By Material

            16.2.2.2. By Packaging Format

            16.2.2.3. By Distribution Channel

    16.3. Brazil

        16.3.1. Pricing Analysis

        16.3.2. Market Share Analysis, 2023

            16.3.2.1. By Material

            16.3.2.2. By Packaging Format

            16.3.2.3. By Distribution Channel

    16.4. Mexico

        16.4.1. Pricing Analysis

        16.4.2. Market Share Analysis, 2023

            16.4.2.1. By Material

            16.4.2.2. By Packaging Format

            16.4.2.3. By Distribution Channel

    16.5. Germany

        16.5.1. Pricing Analysis

        16.5.2. Market Share Analysis, 2023

            16.5.2.1. By Material

            16.5.2.2. By Packaging Format

            16.5.2.3. By Distribution Channel

    16.6. UK

        16.6.1. Pricing Analysis

        16.6.2. Market Share Analysis, 2023

            16.6.2.1. By Material

            16.6.2.2. By Packaging Format

            16.6.2.3. By Distribution Channel

    16.7. France

        16.7.1. Pricing Analysis

        16.7.2. Market Share Analysis, 2023

            16.7.2.1. By Material

            16.7.2.2. By Packaging Format

            16.7.2.3. By Distribution Channel

    16.8. Spain

        16.8.1. Pricing Analysis

        16.8.2. Market Share Analysis, 2023

            16.8.2.1. By Material

            16.8.2.2. By Packaging Format

            16.8.2.3. By Distribution Channel

    16.9. Italy

        16.9.1. Pricing Analysis

        16.9.2. Market Share Analysis, 2023

            16.9.2.1. By Material

            16.9.2.2. By Packaging Format

            16.9.2.3. By Distribution Channel

    16.10. Poland

        16.10.1. Pricing Analysis

        16.10.2. Market Share Analysis, 2023

            16.10.2.1. By Material

            16.10.2.2. By Packaging Format

            16.10.2.3. By Distribution Channel

    16.11. Russia

        16.11.1. Pricing Analysis

        16.11.2. Market Share Analysis, 2023

            16.11.2.1. By Material

            16.11.2.2. By Packaging Format

            16.11.2.3. By Distribution Channel

    16.12. Czech Republic

        16.12.1. Pricing Analysis

        16.12.2. Market Share Analysis, 2023

            16.12.2.1. By Material

            16.12.2.2. By Packaging Format

            16.12.2.3. By Distribution Channel

    16.13. Romania

        16.13.1. Pricing Analysis

        16.13.2. Market Share Analysis, 2023

            16.13.2.1. By Material

            16.13.2.2. By Packaging Format

            16.13.2.3. By Distribution Channel

    16.14. India

        16.14.1. Pricing Analysis

        16.14.2. Market Share Analysis, 2023

            16.14.2.1. By Material

            16.14.2.2. By Packaging Format

            16.14.2.3. By Distribution Channel

    16.15. Bangladesh

        16.15.1. Pricing Analysis

        16.15.2. Market Share Analysis, 2023

            16.15.2.1. By Material

            16.15.2.2. By Packaging Format

            16.15.2.3. By Distribution Channel

    16.16. Australia

        16.16.1. Pricing Analysis

        16.16.2. Market Share Analysis, 2023

            16.16.2.1. By Material

            16.16.2.2. By Packaging Format

            16.16.2.3. By Distribution Channel

    16.17. New Zealand

        16.17.1. Pricing Analysis

        16.17.2. Market Share Analysis, 2023

            16.17.2.1. By Material

            16.17.2.2. By Packaging Format

            16.17.2.3. By Distribution Channel

    16.18. China

        16.18.1. Pricing Analysis

        16.18.2. Market Share Analysis, 2023

            16.18.2.1. By Material

            16.18.2.2. By Packaging Format

            16.18.2.3. By Distribution Channel

    16.19. Japan

        16.19.1. Pricing Analysis

        16.19.2. Market Share Analysis, 2023

            16.19.2.1. By Material

            16.19.2.2. By Packaging Format

            16.19.2.3. By Distribution Channel

    16.20. South Korea

        16.20.1. Pricing Analysis

        16.20.2. Market Share Analysis, 2023

            16.20.2.1. By Material

            16.20.2.2. By Packaging Format

            16.20.2.3. By Distribution Channel

    16.21. GCC Countries

        16.21.1. Pricing Analysis

        16.21.2. Market Share Analysis, 2023

            16.21.2.1. By Material

            16.21.2.2. By Packaging Format

            16.21.2.3. By Distribution Channel

    16.22. South Africa

        16.22.1. Pricing Analysis

        16.22.2. Market Share Analysis, 2023

            16.22.2.1. By Material

            16.22.2.2. By Packaging Format

            16.22.2.3. By Distribution Channel

    16.23. Israel

        16.23.1. Pricing Analysis

        16.23.2. Market Share Analysis, 2023

            16.23.2.1. By Material

            16.23.2.2. By Packaging Format

            16.23.2.3. By Distribution Channel

17. Market Structure Analysis

    17.1. Competition Dashboard

    17.2. Competition Benchmarking

    17.3. Market Share Analysis of Top Players

        17.3.1. By Regional

        17.3.2. By Material

        17.3.3. By Packaging Format

        17.3.4. By Distribution Channel

18. Competition Analysis

    18.1. Competition Deep Dive

        18.1.1. Amcor Plc

            18.1.1.1. Overview

            18.1.1.2. Product Portfolio

            18.1.1.3. Profitability by Market Segments

            18.1.1.4. Sales Footprint

            18.1.1.5. Strategy Overview

                18.1.1.5.1. Marketing Strategy

                18.1.1.5.2. Product Strategy

                18.1.1.5.3. Channel Strategy

        18.1.2. DS Smith PLC

            18.1.2.1. Overview

            18.1.2.2. Product Portfolio

            18.1.2.3. Profitability by Market Segments

            18.1.2.4. Sales Footprint

            18.1.2.5. Strategy Overview

                18.1.2.5.1. Marketing Strategy

                18.1.2.5.2. Product Strategy

                18.1.2.5.3. Channel Strategy

        18.1.3. ProAmpac LLC

            18.1.3.1. Overview

            18.1.3.2. Product Portfolio

            18.1.3.3. Profitability by Market Segments

            18.1.3.4. Sales Footprint

            18.1.3.5. Strategy Overview

                18.1.3.5.1. Marketing Strategy

                18.1.3.5.2. Product Strategy

                18.1.3.5.3. Channel Strategy

        18.1.4. WestRock Company

            18.1.4.1. Overview

            18.1.4.2. Product Portfolio

            18.1.4.3. Profitability by Market Segments

            18.1.4.4. Sales Footprint

            18.1.4.5. Strategy Overview

                18.1.4.5.1. Marketing Strategy

                18.1.4.5.2. Product Strategy

                18.1.4.5.3. Channel Strategy

        18.1.5. Mondi PLC

            18.1.5.1. Overview

            18.1.5.2. Product Portfolio

            18.1.5.3. Profitability by Market Segments

            18.1.5.4. Sales Footprint

            18.1.5.5. Strategy Overview

                18.1.5.5.1. Marketing Strategy

                18.1.5.5.2. Product Strategy

                18.1.5.5.3. Channel Strategy

        18.1.6. Crown Holdings, Inc

            18.1.6.1. Overview

            18.1.6.2. Product Portfolio

            18.1.6.3. Profitability by Market Segments

            18.1.6.4. Sales Footprint

            18.1.6.5. Strategy Overview

                18.1.6.5.1. Marketing Strategy

                18.1.6.5.2. Product Strategy

                18.1.6.5.3. Channel Strategy

        18.1.7. Sonoco Products Company

            18.1.7.1. Overview

            18.1.7.2. Product Portfolio

            18.1.7.3. Profitability by Market Segments

            18.1.7.4. Sales Footprint

            18.1.7.5. Strategy Overview

                18.1.7.5.1. Marketing Strategy

                18.1.7.5.2. Product Strategy

                18.1.7.5.3. Channel Strategy

        18.1.8. Graham Packaging Company

            18.1.8.1. Overview

            18.1.8.2. Product Portfolio

            18.1.8.3. Profitability by Market Segments

            18.1.8.4. Sales Footprint

            18.1.8.5. Strategy Overview

                18.1.8.5.1. Marketing Strategy

                18.1.8.5.2. Product Strategy

                18.1.8.5.3. Channel Strategy

        18.1.9. Novolex Holdings, Inc

            18.1.9.1. Overview

            18.1.9.2. Product Portfolio

            18.1.9.3. Profitability by Market Segments

            18.1.9.4. Sales Footprint

            18.1.9.5. Strategy Overview

                18.1.9.5.1. Marketing Strategy

                18.1.9.5.2. Product Strategy

                18.1.9.5.3. Channel Strategy

        18.1.10. Pacific Bag, Inc

            18.1.10.1. Overview

            18.1.10.2. Product Portfolio

            18.1.10.3. Profitability by Market Segments

            18.1.10.4. Sales Footprint

            18.1.10.5. Strategy Overview

                18.1.10.5.1. Marketing Strategy

                18.1.10.5.2. Product Strategy

                18.1.10.5.3. Channel Strategy

        18.1.11. Goglio SpA

            18.1.11.1. Overview

            18.1.11.2. Product Portfolio

            18.1.11.3. Profitability by Market Segments

            18.1.11.4. Sales Footprint

            18.1.11.5. Strategy Overview

                18.1.11.5.1. Marketing Strategy

                18.1.11.5.2. Product Strategy

                18.1.11.5.3. Channel Strategy

19. Assumptions & Acronyms Used

20. Research Methodology

List of Tables

Table 1: Global Market Value (US$ Million) Forecast by Region, 2019 to 2034

Table 2: Global Market Volume (Units) Forecast by Region, 2019 to 2034

Table 3: Global Market Value (US$ Million) Forecast by Material, 2019 to 2034

Table 4: Global Market Volume (Units) Forecast by Material, 2019 to 2034

Table 5: Global Market Value (US$ Million) Forecast by Packaging Format, 2019 to 2034

Table 6: Global Market Volume (Units) Forecast by Packaging Format, 2019 to 2034

Table 7: Global Market Value (US$ Million) Forecast by Distribution Channel, 2019 to 2034

Table 8: Global Market Volume (Units) Forecast by Distribution Channel, 2019 to 2034

Table 9: North America Market Value (US$ Million) Forecast by Country, 2019 to 2034

Table 10: North America Market Volume (Units) Forecast by Country, 2019 to 2034

Table 11: North America Market Value (US$ Million) Forecast by Material, 2019 to 2034

Table 12: North America Market Volume (Units) Forecast by Material, 2019 to 2034

Table 13: North America Market Value (US$ Million) Forecast by Packaging Format, 2019 to 2034

Table 14: North America Market Volume (Units) Forecast by Packaging Format, 2019 to 2034

Table 15: North America Market Value (US$ Million) Forecast by Distribution Channel, 2019 to 2034

Table 16: North America Market Volume (Units) Forecast by Distribution Channel, 2019 to 2034

Table 17: Latin America Market Value (US$ Million) Forecast by Country, 2019 to 2034

Table 18: Latin America Market Volume (Units) Forecast by Country, 2019 to 2034

Table 19: Latin America Market Value (US$ Million) Forecast by Material, 2019 to 2034

Table 20: Latin America Market Volume (Units) Forecast by Material, 2019 to 2034

Table 21: Latin America Market Value (US$ Million) Forecast by Packaging Format, 2019 to 2034

Table 22: Latin America Market Volume (Units) Forecast by Packaging Format, 2019 to 2034

Table 23: Latin America Market Value (US$ Million) Forecast by Distribution Channel, 2019 to 2034

Table 24: Latin America Market Volume (Units) Forecast by Distribution Channel, 2019 to 2034

Table 25: Western Europe Market Value (US$ Million) Forecast by Country, 2019 to 2034

Table 26: Western Europe Market Volume (Units) Forecast by Country, 2019 to 2034

Table 27: Western Europe Market Value (US$ Million) Forecast by Material, 2019 to 2034

Table 28: Western Europe Market Volume (Units) Forecast by Material, 2019 to 2034

Table 29: Western Europe Market Value (US$ Million) Forecast by Packaging Format, 2019 to 2034

Table 30: Western Europe Market Volume (Units) Forecast by Packaging Format, 2019 to 2034

Table 31: Western Europe Market Value (US$ Million) Forecast by Distribution Channel, 2019 to 2034

Table 32: Western Europe Market Volume (Units) Forecast by Distribution Channel, 2019 to 2034

Table 33: Eastern Europe Market Value (US$ Million) Forecast by Country, 2019 to 2034

Table 34: Eastern Europe Market Volume (Units) Forecast by Country, 2019 to 2034

Table 35: Eastern Europe Market Value (US$ Million) Forecast by Material, 2019 to 2034

Table 36: Eastern Europe Market Volume (Units) Forecast by Material, 2019 to 2034

Table 37: Eastern Europe Market Value (US$ Million) Forecast by Packaging Format, 2019 to 2034

Table 38: Eastern Europe Market Volume (Units) Forecast by Packaging Format, 2019 to 2034

Table 39: Eastern Europe Market Value (US$ Million) Forecast by Distribution Channel, 2019 to 2034

Table 40: Eastern Europe Market Volume (Units) Forecast by Distribution Channel, 2019 to 2034

Table 41: South Asia and Pacific Market Value (US$ Million) Forecast by Country, 2019 to 2034

Table 42: South Asia and Pacific Market Volume (Units) Forecast by Country, 2019 to 2034

Table 43: South Asia and Pacific Market Value (US$ Million) Forecast by Material, 2019 to 2034

Table 44: South Asia and Pacific Market Volume (Units) Forecast by Material, 2019 to 2034

Table 45: South Asia and Pacific Market Value (US$ Million) Forecast by Packaging Format, 2019 to 2034

Table 46: South Asia and Pacific Market Volume (Units) Forecast by Packaging Format, 2019 to 2034

Table 47: South Asia and Pacific Market Value (US$ Million) Forecast by Distribution Channel, 2019 to 2034

Table 48: South Asia and Pacific Market Volume (Units) Forecast by Distribution Channel, 2019 to 2034

Table 49: East Asia Market Value (US$ Million) Forecast by Country, 2019 to 2034

Table 50: East Asia Market Volume (Units) Forecast by Country, 2019 to 2034

Table 51: East Asia Market Value (US$ Million) Forecast by Material, 2019 to 2034

Table 52: East Asia Market Volume (Units) Forecast by Material, 2019 to 2034

Table 53: East Asia Market Value (US$ Million) Forecast by Packaging Format, 2019 to 2034

Table 54: East Asia Market Volume (Units) Forecast by Packaging Format, 2019 to 2034

Table 55: East Asia Market Value (US$ Million) Forecast by Distribution Channel, 2019 to 2034

Table 56: East Asia Market Volume (Units) Forecast by Distribution Channel, 2019 to 2034

Table 57: Middle East and Africa Market Value (US$ Million) Forecast by Country, 2019 to 2034

Table 58: Middle East and Africa Market Volume (Units) Forecast by Country, 2019 to 2034

Table 59: Middle East and Africa Market Value (US$ Million) Forecast by Material, 2019 to 2034

Table 60: Middle East and Africa Market Volume (Units) Forecast by Material, 2019 to 2034

Table 61: Middle East and Africa Market Value (US$ Million) Forecast by Packaging Format, 2019 to 2034

Table 62: Middle East and Africa Market Volume (Units) Forecast by Packaging Format, 2019 to 2034

Table 63: Middle East and Africa Market Value (US$ Million) Forecast by Distribution Channel, 2019 to 2034

Table 64: Middle East and Africa Market Volume (Units) Forecast by Distribution Channel, 2019 to 2034

List of Charts

Figure 1: Global Market Value (US$ Million) by Material, 2024 to 2034

Figure 2: Global Market Value (US$ Million) by Packaging Format, 2024 to 2034

Figure 3: Global Market Value (US$ Million) by Distribution Channel, 2024 to 2034

Figure 4: Global Market Value (US$ Million) by Region, 2024 to 2034

Figure 5: Global Market Value (US$ Million) Analysis by Region, 2019 to 2034

Figure 6: Global Market Volume (Units) Analysis by Region, 2019 to 2034

Figure 7: Global Market Value Share (%) and BPS Analysis by Region, 2024 to 2034

Figure 8: Global Market Y-o-Y Growth (%) Projections by Region, 2024 to 2034

Figure 9: Global Market Value (US$ Million) Analysis by Material, 2019 to 2034

Figure 10: Global Market Volume (Units) Analysis by Material, 2019 to 2034

Figure 11: Global Market Value Share (%) and BPS Analysis by Material, 2024 to 2034

Figure 12: Global Market Y-o-Y Growth (%) Projections by Material, 2024 to 2034

Figure 13: Global Market Value (US$ Million) Analysis by Packaging Format, 2019 to 2034

Figure 14: Global Market Volume (Units) Analysis by Packaging Format, 2019 to 2034

Figure 15: Global Market Value Share (%) and BPS Analysis by Packaging Format, 2024 to 2034

Figure 16: Global Market Y-o-Y Growth (%) Projections by Packaging Format, 2024 to 2034

Figure 17: Global Market Value (US$ Million) Analysis by Distribution Channel, 2019 to 2034

Figure 18: Global Market Volume (Units) Analysis by Distribution Channel, 2019 to 2034

Figure 19: Global Market Value Share (%) and BPS Analysis by Distribution Channel, 2024 to 2034

Figure 20: Global Market Y-o-Y Growth (%) Projections by Distribution Channel, 2024 to 2034

Figure 21: Global Market Attractiveness by Material, 2024 to 2034

Figure 22: Global Market Attractiveness by Packaging Format, 2024 to 2034

Figure 23: Global Market Attractiveness by Distribution Channel, 2024 to 2034

Figure 24: Global Market Attractiveness by Region, 2024 to 2034

Figure 25: North America Market Value (US$ Million) by Material, 2024 to 2034

Figure 26: North America Market Value (US$ Million) by Packaging Format, 2024 to 2034

Figure 27: North America Market Value (US$ Million) by Distribution Channel, 2024 to 2034

Figure 28: North America Market Value (US$ Million) by Country, 2024 to 2034

Figure 29: North America Market Value (US$ Million) Analysis by Country, 2019 to 2034

Figure 30: North America Market Volume (Units) Analysis by Country, 2019 to 2034

Figure 31: North America Market Value Share (%) and BPS Analysis by Country, 2024 to 2034

Figure 32: North America Market Y-o-Y Growth (%) Projections by Country, 2024 to 2034

Figure 33: North America Market Value (US$ Million) Analysis by Material, 2019 to 2034

Figure 34: North America Market Volume (Units) Analysis by Material, 2019 to 2034

Figure 35: North America Market Value Share (%) and BPS Analysis by Material, 2024 to 2034

Figure 36: North America Market Y-o-Y Growth (%) Projections by Material, 2024 to 2034

Figure 37: North America Market Value (US$ Million) Analysis by Packaging Format, 2019 to 2034

Figure 38: North America Market Volume (Units) Analysis by Packaging Format, 2019 to 2034

Figure 39: North America Market Value Share (%) and BPS Analysis by Packaging Format, 2024 to 2034

Figure 40: North America Market Y-o-Y Growth (%) Projections by Packaging Format, 2024 to 2034

Figure 41: North America Market Value (US$ Million) Analysis by Distribution Channel, 2019 to 2034

Figure 42: North America Market Volume (Units) Analysis by Distribution Channel, 2019 to 2034

Figure 43: North America Market Value Share (%) and BPS Analysis by Distribution Channel, 2024 to 2034

Figure 44: North America Market Y-o-Y Growth (%) Projections by Distribution Channel, 2024 to 2034

Figure 45: North America Market Attractiveness by Material, 2024 to 2034

Figure 46: North America Market Attractiveness by Packaging Format, 2024 to 2034

Figure 47: North America Market Attractiveness by Distribution Channel, 2024 to 2034

Figure 48: North America Market Attractiveness by Country, 2024 to 2034

Figure 49: Latin America Market Value (US$ Million) by Material, 2024 to 2034

Figure 50: Latin America Market Value (US$ Million) by Packaging Format, 2024 to 2034

Figure 51: Latin America Market Value (US$ Million) by Distribution Channel, 2024 to 2034

Figure 52: Latin America Market Value (US$ Million) by Country, 2024 to 2034

Figure 53: Latin America Market Value (US$ Million) Analysis by Country, 2019 to 2034

Figure 54: Latin America Market Volume (Units) Analysis by Country, 2019 to 2034

Figure 55: Latin America Market Value Share (%) and BPS Analysis by Country, 2024 to 2034

Figure 56: Latin America Market Y-o-Y Growth (%) Projections by Country, 2024 to 2034

Figure 57: Latin America Market Value (US$ Million) Analysis by Material, 2019 to 2034

Figure 58: Latin America Market Volume (Units) Analysis by Material, 2019 to 2034

Figure 59: Latin America Market Value Share (%) and BPS Analysis by Material, 2024 to 2034

Figure 60: Latin America Market Y-o-Y Growth (%) Projections by Material, 2024 to 2034

Figure 61: Latin America Market Value (US$ Million) Analysis by Packaging Format, 2019 to 2034

Figure 62: Latin America Market Volume (Units) Analysis by Packaging Format, 2019 to 2034

Figure 63: Latin America Market Value Share (%) and BPS Analysis by Packaging Format, 2024 to 2034

Figure 64: Latin America Market Y-o-Y Growth (%) Projections by Packaging Format, 2024 to 2034

Figure 65: Latin America Market Value (US$ Million) Analysis by Distribution Channel, 2019 to 2034

Figure 66: Latin America Market Volume (Units) Analysis by Distribution Channel, 2019 to 2034

Figure 67: Latin America Market Value Share (%) and BPS Analysis by Distribution Channel, 2024 to 2034

Figure 68: Latin America Market Y-o-Y Growth (%) Projections by Distribution Channel, 2024 to 2034

Figure 69: Latin America Market Attractiveness by Material, 2024 to 2034

Figure 70: Latin America Market Attractiveness by Packaging Format, 2024 to 2034

Figure 71: Latin America Market Attractiveness by Distribution Channel, 2024 to 2034

Figure 72: Latin America Market Attractiveness by Country, 2024 to 2034

Figure 73: Western Europe Market Value (US$ Million) by Material, 2024 to 2034

Figure 74: Western Europe Market Value (US$ Million) by Packaging Format, 2024 to 2034

Figure 75: Western Europe Market Value (US$ Million) by Distribution Channel, 2024 to 2034

Figure 76: Western Europe Market Value (US$ Million) by Country, 2024 to 2034

Figure 77: Western Europe Market Value (US$ Million) Analysis by Country, 2019 to 2034

Figure 78: Western Europe Market Volume (Units) Analysis by Country, 2019 to 2034

Figure 79: Western Europe Market Value Share (%) and BPS Analysis by Country, 2024 to 2034

Figure 80: Western Europe Market Y-o-Y Growth (%) Projections by Country, 2024 to 2034

Figure 81: Western Europe Market Value (US$ Million) Analysis by Material, 2019 to 2034

Figure 82: Western Europe Market Volume (Units) Analysis by Material, 2019 to 2034

Figure 83: Western Europe Market Value Share (%) and BPS Analysis by Material, 2024 to 2034

Figure 84: Western Europe Market Y-o-Y Growth (%) Projections by Material, 2024 to 2034

Figure 85: Western Europe Market Value (US$ Million) Analysis by Packaging Format, 2019 to 2034

Figure 86: Western Europe Market Volume (Units) Analysis by Packaging Format, 2019 to 2034

Figure 87: Western Europe Market Value Share (%) and BPS Analysis by Packaging Format, 2024 to 2034

Figure 88: Western Europe Market Y-o-Y Growth (%) Projections by Packaging Format, 2024 to 2034

Figure 89: Western Europe Market Value (US$ Million) Analysis by Distribution Channel, 2019 to 2034

Figure 90: Western Europe Market Volume (Units) Analysis by Distribution Channel, 2019 to 2034

Figure 91: Western Europe Market Value Share (%) and BPS Analysis by Distribution Channel, 2024 to 2034

Figure 92: Western Europe Market Y-o-Y Growth (%) Projections by Distribution Channel, 2024 to 2034

Figure 93: Western Europe Market Attractiveness by Material, 2024 to 2034

Figure 94: Western Europe Market Attractiveness by Packaging Format, 2024 to 2034

Figure 95: Western Europe Market Attractiveness by Distribution Channel, 2024 to 2034

Figure 96: Western Europe Market Attractiveness by Country, 2024 to 2034

Figure 97: Eastern Europe Market Value (US$ Million) by Material, 2024 to 2034

Figure 98: Eastern Europe Market Value (US$ Million) by Packaging Format, 2024 to 2034

Figure 99: Eastern Europe Market Value (US$ Million) by Distribution Channel, 2024 to 2034

Figure 100: Eastern Europe Market Value (US$ Million) by Country, 2024 to 2034

Figure 101: Eastern Europe Market Value (US$ Million) Analysis by Country, 2019 to 2034

Figure 102: Eastern Europe Market Volume (Units) Analysis by Country, 2019 to 2034

Figure 103: Eastern Europe Market Value Share (%) and BPS Analysis by Country, 2024 to 2034

Figure 104: Eastern Europe Market Y-o-Y Growth (%) Projections by Country, 2024 to 2034

Figure 105: Eastern Europe Market Value (US$ Million) Analysis by Material, 2019 to 2034

Figure 106: Eastern Europe Market Volume (Units) Analysis by Material, 2019 to 2034

Figure 107: Eastern Europe Market Value Share (%) and BPS Analysis by Material, 2024 to 2034

Figure 108: Eastern Europe Market Y-o-Y Growth (%) Projections by Material, 2024 to 2034

Figure 109: Eastern Europe Market Value (US$ Million) Analysis by Packaging Format, 2019 to 2034

Figure 110: Eastern Europe Market Volume (Units) Analysis by Packaging Format, 2019 to 2034

Figure 111: Eastern Europe Market Value Share (%) and BPS Analysis by Packaging Format, 2024 to 2034

Figure 112: Eastern Europe Market Y-o-Y Growth (%) Projections by Packaging Format, 2024 to 2034

Figure 113: Eastern Europe Market Value (US$ Million) Analysis by Distribution Channel, 2019 to 2034

Figure 114: Eastern Europe Market Volume (Units) Analysis by Distribution Channel, 2019 to 2034

Figure 115: Eastern Europe Market Value Share (%) and BPS Analysis by Distribution Channel, 2024 to 2034

Figure 116: Eastern Europe Market Y-o-Y Growth (%) Projections by Distribution Channel, 2024 to 2034

Figure 117: Eastern Europe Market Attractiveness by Material, 2024 to 2034

Figure 118: Eastern Europe Market Attractiveness by Packaging Format, 2024 to 2034

Figure 119: Eastern Europe Market Attractiveness by Distribution Channel, 2024 to 2034

Figure 120: Eastern Europe Market Attractiveness by Country, 2024 to 2034

Figure 121: South Asia and Pacific Market Value (US$ Million) by Material, 2024 to 2034

Figure 122: South Asia and Pacific Market Value (US$ Million) by Packaging Format, 2024 to 2034

Figure 123: South Asia and Pacific Market Value (US$ Million) by Distribution Channel, 2024 to 2034

Figure 124: South Asia and Pacific Market Value (US$ Million) by Country, 2024 to 2034

Figure 125: South Asia and Pacific Market Value (US$ Million) Analysis by Country, 2019 to 2034

Figure 126: South Asia and Pacific Market Volume (Units) Analysis by Country, 2019 to 2034

Figure 127: South Asia and Pacific Market Value Share (%) and BPS Analysis by Country, 2024 to 2034

Figure 128: South Asia and Pacific Market Y-o-Y Growth (%) Projections by Country, 2024 to 2034

Figure 129: South Asia and Pacific Market Value (US$ Million) Analysis by Material, 2019 to 2034

Figure 130: South Asia and Pacific Market Volume (Units) Analysis by Material, 2019 to 2034

Figure 131: South Asia and Pacific Market Value Share (%) and BPS Analysis by Material, 2024 to 2034

Figure 132: South Asia and Pacific Market Y-o-Y Growth (%) Projections by Material, 2024 to 2034

Figure 133: South Asia and Pacific Market Value (US$ Million) Analysis by Packaging Format, 2019 to 2034

Figure 134: South Asia and Pacific Market Volume (Units) Analysis by Packaging Format, 2019 to 2034

Figure 135: South Asia and Pacific Market Value Share (%) and BPS Analysis by Packaging Format, 2024 to 2034

Figure 136: South Asia and Pacific Market Y-o-Y Growth (%) Projections by Packaging Format, 2024 to 2034

Figure 137: South Asia and Pacific Market Value (US$ Million) Analysis by Distribution Channel, 2019 to 2034

Figure 138: South Asia and Pacific Market Volume (Units) Analysis by Distribution Channel, 2019 to 2034

Figure 139: South Asia and Pacific Market Value Share (%) and BPS Analysis by Distribution Channel, 2024 to 2034

Figure 140: South Asia and Pacific Market Y-o-Y Growth (%) Projections by Distribution Channel, 2024 to 2034

Figure 141: South Asia and Pacific Market Attractiveness by Material, 2024 to 2034

Figure 142: South Asia and Pacific Market Attractiveness by Packaging Format, 2024 to 2034

Figure 143: South Asia and Pacific Market Attractiveness by Distribution Channel, 2024 to 2034

Figure 144: South Asia and Pacific Market Attractiveness by Country, 2024 to 2034

Figure 145: East Asia Market Value (US$ Million) by Material, 2024 to 2034

Figure 146: East Asia Market Value (US$ Million) by Packaging Format, 2024 to 2034

Figure 147: East Asia Market Value (US$ Million) by Distribution Channel, 2024 to 2034

Figure 148: East Asia Market Value (US$ Million) by Country, 2024 to 2034

Figure 149: East Asia Market Value (US$ Million) Analysis by Country, 2019 to 2034

Figure 150: East Asia Market Volume (Units) Analysis by Country, 2019 to 2034

Figure 151: East Asia Market Value Share (%) and BPS Analysis by Country, 2024 to 2034

Figure 152: East Asia Market Y-o-Y Growth (%) Projections by Country, 2024 to 2034

Figure 153: East Asia Market Value (US$ Million) Analysis by Material, 2019 to 2034

Figure 154: East Asia Market Volume (Units) Analysis by Material, 2019 to 2034

Figure 155: East Asia Market Value Share (%) and BPS Analysis by Material, 2024 to 2034

Figure 156: East Asia Market Y-o-Y Growth (%) Projections by Material, 2024 to 2034

Figure 157: East Asia Market Value (US$ Million) Analysis by Packaging Format, 2019 to 2034

Figure 158: East Asia Market Volume (Units) Analysis by Packaging Format, 2019 to 2034

Figure 159: East Asia Market Value Share (%) and BPS Analysis by Packaging Format, 2024 to 2034

Figure 160: East Asia Market Y-o-Y Growth (%) Projections by Packaging Format, 2024 to 2034

Figure 161: East Asia Market Value (US$ Million) Analysis by Distribution Channel, 2019 to 2034

Figure 162: East Asia Market Volume (Units) Analysis by Distribution Channel, 2019 to 2034

Figure 163: East Asia Market Value Share (%) and BPS Analysis by Distribution Channel, 2024 to 2034

Figure 164: East Asia Market Y-o-Y Growth (%) Projections by Distribution Channel, 2024 to 2034

Figure 165: East Asia Market Attractiveness by Material, 2024 to 2034

Figure 166: East Asia Market Attractiveness by Packaging Format, 2024 to 2034

Figure 167: East Asia Market Attractiveness by Distribution Channel, 2024 to 2034

Figure 168: East Asia Market Attractiveness by Country, 2024 to 2034

Figure 169: Middle East and Africa Market Value (US$ Million) by Material, 2024 to 2034

Figure 170: Middle East and Africa Market Value (US$ Million) by Packaging Format, 2024 to 2034

Figure 171: Middle East and Africa Market Value (US$ Million) by Distribution Channel, 2024 to 2034

Figure 172: Middle East and Africa Market Value (US$ Million) by Country, 2024 to 2034

Figure 173: Middle East and Africa Market Value (US$ Million) Analysis by Country, 2019 to 2034

Figure 174: Middle East and Africa Market Volume (Units) Analysis by Country, 2019 to 2034

Figure 175: Middle East and Africa Market Value Share (%) and BPS Analysis by Country, 2024 to 2034

Figure 176: Middle East and Africa Market Y-o-Y Growth (%) Projections by Country, 2024 to 2034

Figure 177: Middle East and Africa Market Value (US$ Million) Analysis by Material, 2019 to 2034

Figure 178: Middle East and Africa Market Volume (Units) Analysis by Material, 2019 to 2034

Figure 179: Middle East and Africa Market Value Share (%) and BPS Analysis by Material, 2024 to 2034

Figure 180: Middle East and Africa Market Y-o-Y Growth (%) Projections by Material, 2024 to 2034

Figure 181: Middle East and Africa Market Value (US$ Million) Analysis by Packaging Format, 2019 to 2034

Figure 182: Middle East and Africa Market Volume (Units) Analysis by Packaging Format, 2019 to 2034

Figure 183: Middle East and Africa Market Value Share (%) and BPS Analysis by Packaging Format, 2024 to 2034

Figure 184: Middle East and Africa Market Y-o-Y Growth (%) Projections by Packaging Format, 2024 to 2034

Figure 185: Middle East and Africa Market Value (US$ Million) Analysis by Distribution Channel, 2019 to 2034

Figure 186: Middle East and Africa Market Volume (Units) Analysis by Distribution Channel, 2019 to 2034

Figure 187: Middle East and Africa Market Value Share (%) and BPS Analysis by Distribution Channel, 2024 to 2034

Figure 188: Middle East and Africa Market Y-o-Y Growth (%) Projections by Distribution Channel, 2024 to 2034

Figure 189: Middle East and Africa Market Attractiveness by Material, 2024 to 2034

Figure 190: Middle East and Africa Market Attractiveness by Packaging Format, 2024 to 2034

Figure 191: Middle East and Africa Market Attractiveness by Distribution Channel, 2024 to 2034

Figure 192: Middle East and Africa Market Attractiveness by Country, 2024 to 2034

Recommendations

Packaging

Eco-friendly Bottle Market

Published : February 2024

Packaging

Eco-friendly Paper Plates Market

Published : August 2023

Explore Packaging Insights

View Reports

Eco-friendly Tea Packaging Market